Iodine, a trace element, is a component of the thyroid hormones tri-iodothyronine and thyroxine. Iodine deficiency disorders (IDD) include a range of conditions that occur throughout life, but are preventable with increased dietary intake. Iodine deficiency is a worldwide public health target. Universal salt iodisation has been selected as the best strategy to eliminate IDD( 1 ).
Estimated iodine intake is higher in Japanese than in other populations. Japanese have a culture of eating seaweeds, and some edible seaweeds contain markedly high amounts of iodine; in particular, iodine content in Laminaria (kelp) is over 200 mg/100 g( 2 ). According to seaweed consumption data and a literature-based analysis, the estimated iodine intake of Japanese adults is 1–3 mg/d( Reference Zava and Zava 3 ). Although this value exceeds the tolerable upper intake level (UL) of American adults (1100 μg/d)( Reference Trumbo, Yates and Schlicker 4 ), the prevalence of hypothyroidism in Japan does not differ from that in other iodine-replete countries, including the USA( Reference Vanderpump 5 ). Although the risk of hypothyroidism in Japan might be reduced by the ‘escape phenomenon’ (escape from Wolff–Chaikoff effect), in which iodide transportation into the thyroid cells decreases with high intake( Reference Eng, Cardona and Fang 6 ), or the non-continuous character of intake of iodine-rich foods in Japan( Reference Tsubota-Utsugi, Imai and Nakade 7 ), evidence for this has been scarce. A few studies in Japanese have reported that excess iodine intake (over 20 mg/d for more than 1 month) causes hypothyroidism or goitre( Reference Namba, Yamashita and Kimura 8 ), and that some cases of hypothyroidism are reversible after intake is restricted( Reference Miyai, Tokushige and Kondo 9 ). The RDA of iodine for adults is 130 μg/d, and the UL is 3000 μg/d in Japan( 10 ); however, these values were derived from papers from other countries or case reports of thyroid dysfunction caused by extraordinary intake of iodine, and evidence to determine threshold amounts causing adverse effects in Japanese remains scarce. Therefore, more information about iodine intake is required before a Japanese Dietary Reference Intake value for iodine can be established.
The iodine content of Japanese foods was first reported in the ‘Standard Tables of Food Composition in Japan 2010’ (STFCJ)( 2 ), but only for 515 of the 1878 food items listed. Since then, a few papers have estimated iodine intake in Japanese using diet records; however, one of these papers did not include critical information on the major iodine intake contributor, soup stock made from kelp( Reference Imaeda, Kuriki and Fujiwara 11 ), while the others estimated iodine intake with regard to these limited food items only( Reference Tsubota-Utsugi, Imai and Nakade 7 , Reference Tsukada, Urakawa and Yokoyama 12 , Reference Kato, Otsuka and Imai 13 ).
Here, we developed a comprehensive iodine database that augments the STFCJ and estimated the iodine intake of Japanese using 16 d diet records (DR) over four seasons.
Methods
Development of the iodine content database
The composition tables of the STFCJ list the iodine content of only 518 (27·6 %) of a total of 1878 food items( 2 ). To substitute missing values for the remaining 1363 food items, we used the data-gathering method proposed by Rand et al. ( Reference Rand, Pennington and Murphy 14 ) and established by previous papers( Reference Sasaki, Kobayashi and Tsugane 15 – Reference Suga, Murakami and Sasaki 17 ). Food groups used in the present study were in accordance with grouping in the STFCJ.
Data sources
First, we conducted a literature search to identify papers reporting the iodine content of Japanese foods. We searched for papers written in English or Japanese in Pubmed, Ovid Medline, CiNii, Ichushi-Web (a database for Japanese papers) using the search terms ‘iodine’ or ‘iodide’ and ‘Japan’ and/or ‘food,’ in English and Japanese. References from relevant articles were manually searched. Although iodine content for the standard composition table was measured by inductively coupled plasma MS (ICP-MS), none of the retrieved papers used ICP-MS to assess iodine content. Two papers measured the iodine concentration of various food items; however, one used GC (139 items)( Reference Kikuchi, Takebayashi and Sasaki 18 ) and the second used colorimetric analysis (fifty-three items)( Reference Katsura and Nakamichi 19 ). In the paper using GC, both ashing and extraction were used based on the difference in the water affinity of the samples. The paper using colorimetric analysis was published in 1960, and nutrient composition might have changed since then. When we were unable to estimate the values from similar foods or recipes in the STFCJ, we used the GC paper values.
Second, the STFCJ has reported that the iodine content of seaweed and processed foods that contain kelp extract (noodles and soup stocks) would be expected to be higher than that of other foods. Since missing values of these foods might considerably affect the total iodine intake, the literature search was conducted again in the same literature sources with the added terms ‘kelp’ or ‘seaweed’. This identified two papers that measured the iodine content of seaweed by ICP-MS( Reference Yoshida 20 , Reference Dawczynski, Schafer and Leiterer 21 ) and one paper that assessed iodine content of processed foods( Reference Nishiyama, Migeta and Kiwaki 22 ).
Finally, when the iodine content could not be estimated or substituted with analytic data, data from the food composition tables of other countries were used. Data for beef and pork were obtained from databases of Australia( 23 ) and Denmark( 24 ), the main sources of Japanese imports, respectively. Although fish was expected to have a higher iodine content than other foods except seaweed, few food composition tables listed the iodine content of fish and seafood. We therefore used the databases of several countries (Norway( 25 ), UK( 26 ) and Australia( 23 )) for fish described as ‘imported’ in the STFCJ and several other types of seafood (n 13). For other food items described as ‘imported’ for which data from the exporting countries were not available and for those not ‘imported’ but identical to foods that could be found in composition tables from other countries, the foreign databases were used (mainly UK and Australia; n 44). Iodine content in the food composition tables of these other countries was assessed by ICP-MS. Of note, the food composition tables of the United States Department of Agriculture and of Asian countries neighbouring Japan do not provide iodine content.
Determination of iodine content
The comprehensive iodine content database was established according to the following five-step method.
-
(1) Step 1: Use of data from the Standard Table of Food Composition in Japan. When iodine content was listed in the STFCJ, this value was used (n 518).
-
(2) Step 2: Assignation of values of similar foods.
-
(a) Step 2-a: Estimated from a different form of the same food.Iodine values of some foods in the STFCJ were listed only in the raw form and not in the form after cooking. When the missing value of a cooked food was imputed using the value of the raw form, consideration should be given to the loss or gain of nutrients due to cooking (i.e. yields and nutrient retention factors). Since the iodine content of foods except fish, eggs and seaweed was almost 0 (all < 10 μg/100 g food), nutrient retention for these items was not considered (n 240). Regarding fish, eggs and seaweed, the value was calculated from the ratio of dry weight between the raw and cooked form (n 69).
-
(b) Step 2-b: Estimated from a biologically similar food.When the iodine content was unavailable in Steps 1 or 2-a, the values from a similar food (same family or order) were assigned after comparing total energy and other nutrients (n 295).
-
-
(3) Step 3: Estimated for multi-ingredient foods.When the iodine content was unavailable in Steps 1 or 2 and the food was composed of multiple ingredients, the values were calculated from ingredient lists in the supplement of the STFCJ or from recipes provided by the manufacturer (n 195).
-
(4) Step 4: Use of analytical values from other papers.When the content could not be estimated using the previous steps, we used data from a paper that listed the iodine content of various Japanese food items, but using a different analytical method (GC)( Reference Kikuchi, Takebayashi and Sasaki 18 ) (n 17). Because the iodine content of seaweed and processed foods with kelp extract was likely to be high, we conducted an additional literature search and used data from papers that measured with ICP-MS( Reference Yoshida 20 – Reference Nishiyama, Migeta and Kiwaki 22 ) (n 8); if these values were unavailable, we used values from a paper that used a different analytical method( Reference Kikuchi, Takebayashi and Sasaki 18 , Reference Saenko, Kravtsova and Ivanenko 27 , Reference Ito, Miyoshi and Fujii 28 ) (n 5). All seaweeds that appeared in the DR were substituted at this process.
-
(5) Step 5: Use of data from the food composition table of other countries.When the content could not be estimated using the previous steps, we used the food composition tables of other countries, as mentioned above.
-
(6) Step 5-a: When a specific food was available in other food composition tables, that value was assigned after comparison of total energy and other nutrients (n 99).
-
(7) Step 5-b: When a different form of a specific food was available in other food composition tables, the value was estimated according to the method of Step 2-a (n 20).
-
(8) Step 5-c: When the content could not be estimated using the previous steps but the value of a biologically similar food was available, the value was estimated according to the method of Step 2-b (n 47).
-
Estimation of iodine intake among Japanese adults
Study population
The survey was conducted in four geographically separated areas of Japan, namely Osaka (Osaka City, urban area), Okinawa (Ginowan City, urban island area), Nagano (Matsumoto City, rural inland area) and Tottori (Kurayoshi City, rural coastal area). Details of the survey have been described elsewhere( Reference Murakami, Sasaki and Takahashi 29 ). Briefly, apparently healthy women aged 30–69 years who lived with their husbands at the time of the survey and who were both willing to participate were recruited. Women were recruited according to their age class, with eight women in each 10-year age class (30–39, 40–49, 50–59 and 60–60) in each area scheduled for inclusion. The husbands participated in the survey regardless of age. This sample size was determined for the primary purpose of this survey, the validation of a diet history questionnaire, based on the sample size of previous validation studies( Reference Tsugane, Sasaki and Kobayashi 30 , Reference Sasaki, Matsumura and Ishihara 31 ) and feasibility. Among the 121 women and 121 men who completed the dietary record, men aged over 80 years (n 1) and women whose body weight was apparently mistyped in the data set (n 1) were excluded, leaving 120 women and 120 men for inclusion in the analysis. The study purpose and protocol were explained to the participants in group orientations and written informed consent was obtained from each participant. The use of data from the present study was approved by the ethics committee of the University of Tokyo, Faculty of Medicine (no. 3421).
Anthropometry data
Body height was measured in the standing position without shoes to the nearest 0·1 cm. Body weight was measured to the nearest 0·1 kg with light indoor clothing. BMI was calculated as body weight (in kg) divided by the square of body height (in m).
Diet records
A semi-weighed DR of four non-consecutive days (3 weekdays and 1 weekend day) was conducted in each of the four seasons, approximately 3 months apart. Details of the recording have been provided elsewhere( Reference Murakami, Sasaki and Takahashi 29 ). Briefly, DR1 was recorded in November or December 2002, DR2 in February 2003, DR3 in May 2003 and DR4 in August or September 2003. Recording sheets and digital scales were provided and participants were asked to record and weigh the amount of foods and beverages consumed on the recording days. When weighing was difficult (i.e. when eating out), participants were asked to record the size and quantity of foods as precisely as possible instead of measuring their weight. Collected records were checked and coded by registered dietitians. Regarding kelp, this food is typically sold in a dried form and reconstituted in water before cooking. Rehydrated kelp is approximately four times heavier than dried kelp( Reference Tsukada, Urakawa and Yokoyama 12 ). Although kelp should have been recorded as dry weight in accordance with the methodology of the STFCJ, some of the recorded weights were obviously excessive. Therefore, kelp weights over 100 g were assumed to be the wet weight and were converted to the dry weight by multiplying by 1/4 (n 2).
Calculation of iodine intake and comparison with the Dietary Reference Intakes
Energy intake was calculated from the amount of foods and the STFCJ. Iodine intake was calculated based on the database created in the presented study. Since Japanese soup stock is made from kelp and/or bonito and the amount of kelp used likely differs among individuals, and because instant granule-type soup stock (kelp and bonito flavour) products are also widely used in Japan( Reference Kataoka and Mantjoro 32 ), we used three different iodine contents of kelp soup stock for comparison. Method A used values from the STFCJ; Method B used the value from a report that assessed the iodine content of soup stock made from a smaller amount of kelp than in STFCJ( Reference Yoshida 20 ) (8200 μg/100 g in STFCJ v. 430 μg/100 g in Method B); and Method C used instant soup granules in place of the iodine content of soup stock made from kelp and dried bonito (2200 μg/100 g in STFCJ v. 317 μg/100 g in Method C), on the basis that instant soup stock is widely used in fast food chain restaurants and is often contained in ready-made foods. Also, some soup stock recorded in the DR as extracted from kelp and dried bonito was considered to be instant soup stock.
Method A was then used to estimate habitual iodine intake and to examine the contribution of each food group to total iodine intake. Since the UL and RDA of iodine in the Dietary Reference Intakes (DRI) for Japanese 2015( 10 ) are 3000 and 130 μg/d, respectively, we calculated the proportion of participants whose calculated iodine intake and estimated habitual intake was 3000 μg/d or more and less than 130 μg/d. The iodide content of Japanese water is low( Reference Guruge, Wu and Kannan 33 ), and salt iodisation has not been implemented.
Statistical analyses
Habitual intake was estimated using the Best-power method proposed by Nusser et al. ( Reference Nusser, Carriquiry and Dodd 34 ). Details of this method have been reported elsewhere( Reference Dodd, Guenther and Freedman 35 ). Briefly, the distribution of iodine intake was converted to a nearly normal distribution by Box–Cox transformation and intake was adjusted for within-person variability. Back-transformation was then conducted with the bias adjustment method to obtain the distribution of habitual iodine intake. The result of this method is presented as Method D. All processes of the Best-power method were conducted with SAS (SAS Institute).
Because of differences in soup stock recipes, a total of four different methods were used to calculate the iodine intake of Japanese. In Japan, kelp or other types of soup stocks are included in many dishes, and their iodine content varies depending on differences in ingredients and extraction methods. Method A: values from the STFCJ was used after imputing missing values; Method B: the value of kelp soup stock in Method A was replaced by the analysed value of iodine content of soup stock made from a smaller amount of kelp (from 8200 μg/100 g in the STFCJ to 430 μg/100 g in Method B); Method C: the iodine content of soup stock made from kelp and dried bonito was replaced with that of instant soup granules, which are convenient and widely used in home cooking (from 2200 μg/100 g in the STFCJ to 317 μg/100 g in Method C); Method D: estimated habitual intake was calculated with the Best-power method by Nusser et al. ( Reference Nusser, Carriquiry and Dodd 34 ). The substitution method of iodine content was according to Method A.
The results are presented as mean, standard deviation, and median 1 and median 2. Mean, standard deviation, median 1, percentiles and percentages of inadequate participants compared with DRI values were calculated after calculation of the mean iodine intake of 16 d in each participant. In other words, ‘Median 1’ was the median of the mean iodine intake in the 120 participants (i.e. mean iodine intake over 16 d was calculated in each participant and then the median of these means was calculated). ‘Median 2’ was the median of iodine intake on all observed days (1920 d, 120 participants × 16 d per sex). Iodine intake in each recording day in each participant was regarded as one observed value and the median of these 1920 values per sex was calculated.
To compare iodine intake between the younger and older subjects, we defined the younger population as aged less than 50 years and the older population as aged 50 years or more. Statistical differences of median values based on Method A were calculated using the Wilcoxon rank-sum test.
All analyses were performed using SAS version 9.3 (SAS Institute). A two-sided P value of 0·05 was considered statistically significant.
Results
Table 1 shows the number of food items whose iodine content was substituted during database development. Among the 1360 foods without iodine content in the STFCJ, suitable substitution methods could be found for 995 (73·0 %). In contrast, substitutions could not be found for 365 foods, but 188 of these did not appear in the DR. Most of the remaining 177 foods were meat (n 52), vegetables (n 36) and fish (n 32). The iodine content of meat and vegetables appearing in the STFCJ were less than 20 μg/100 g, with most about 0 μg/100 g. Although fish might contain a non-negligible amount of iodine, the appearance frequency of these fish in the DR was only about 0·8 % of the total food items recorded. In total, among 1878 foods, the iodine content of 1513 foods (81 %) could be used to estimate iodine intake, including 518 foods (28 %) originally listed in the STFCJ and 995 foods (53 %) substituted in the present study.
Table 1 Number of food items in each step of iodine database development
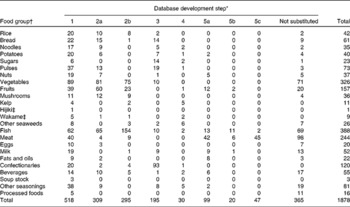
* Step 1: values in the Standard Tables of Food Composition in Japan 2010 (STFCJ); 2a: substitution with values of different form (e.g. raw or cooked form) of the same food in the STFCJ; 2b: substitution with values of biologically similar food items in the STFCJ; 3: imputed values by reference to recipes; 4: assignation of values in the literature; 5a: assignation with values in food composition databases of other countries (mainly exporting countries); 5b: substitution with values of different form (e.g. raw or cooked form) of the same food in food composition tables of other countries; 5c: substitution using values of biologically similar food items in food composition tables of other countries.
† Food groups are defined in the STFCJ.
‡ Hijiki: Hijikia fusiforme; Wakame: Undaria pinnatifida.
The participants in the iodine intake estimation are characterised in Table 2. Fig. 1 shows the distribution of iodine intake in 24 h on all survey days (iodine intake per d of 1920 d (120 participants × 16 d for each sex)) and the mean intake of the 16 d in each subject (individual mean iodine intake for each sex). The distribution of iodine intake in 24 h was highly skewed, at < 300 μg in approximately 55 % of observed days. Although individual mean iodine intake was also highly skewed, the skewness of the distribution was much milder than that of iodine intake in 24 h in all survey days, because all subjects consumed iodine-rich foods (kelp or soup stock) on at least one of the sixteen survey days and nobody had a mean iodine intake of 0 μg/d.
Table 2 Basic characteristics of study participants (Mean values and standard deviations)
* Younger: 30–49 years old; older: 50–69 years old (women) and 50–76 years old (men).

Fig. 1 Histograms of iodine intake in 24 h in all survey days (iodine intake per d of 1920 d (120 participants × 16 d for each sex)) and mean iodine intake of 16 d in each subject among 120 women (■) and 120 men (□). (a) Iodine intake in 24 h in 1920 survey days (120 participants × 16 d per sex). The range of iodine intake was presented from 0 to 15 000 μg/d (left). The distribution of iodine intake was presented from 0 to 500 μg/d (right). (b) Individual mean iodine intake of 16 d for 120 participants per sex. The range of iodine intake was from 0 to 15 000 μg/d (left). The distribution of iodine intake was from 0 to 500 μg/d (right).
Estimated iodine intake of women and men is shown in Table 3; three methods (A, B and C) were used to estimate the iodine intake of each survey day (16 d × 240 participants). In Method A, median 1 (median of mean iodine intake in 16 d in the 120 participants) was 2310 μg/d for women and 1918 μg/d for men. Median 2 (median of iodine intake in 24 h on all observed days) was 229 μg/d for women and 273 μg/d for men. Comparing with DRI values, the percentages of participants with inadequate intake who exceeded 3000 μg/d were 38·3 % of women and 37·5 % of men while approximately 5 % of participants consumed less than 130 μg/d. When the value of soup stock with less kelp or instant soup granules was used (Methods B and C), median 1 was 1443 μg/d for women and 1585 μg/d for men, and 1103 μg/d for women and 1110 μg/d for men, respectively. Mean and median habitual iodine intake estimated with the Best-power method were 1414 (sd 1622) μg/d and 857 μg/d for women and 1572 (sd 1906) μg/d and 1031 μg/d for men (Method D). Habitual intake exceeded the UL of the DRI for Japanese 2015 in about 10 % of both men and women.
Table 3 Estimated iodine intake and the proportion of subjects whose iodine intake was above the tolerable upper intake level or below the RDA by the four estimation methods (Mean values, standard deviations, medians, 25th and 75th percentiles, number of subjects and percentages)
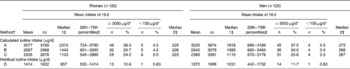
* 3000 μg/d is the tolerable upper intake level and 130 μg/d is the RDA in the Dietary Reference Intakes for Japanese version 2015.
† Method A: values from the Standard Tables of Food Composition in Japan 2010 (STFCJ) were used after imputing missing values; Method B: the value of kelp soup stock in Method A was altered by replacement with the analysed value of iodine content of soup stock made from a small amount of kelp (from 8200 μg/100 g in STFCJ to 430 μg/100 g in Method B); Method C: the iodine content of soup stock made from kelp and dried bonito was replaced with that of instant soup granules (from 2200 μg/100 g in STFCJ to 317 μg/100 g in Method C); Method D: estimated habitual intake was calculated with the Best-power method of Nusser et al. ( Reference Nusser, Carriquiry and Dodd 34 ). Substitution method of iodine content was according to Method A.
‡ Median 1: median of individual mean intake for 16 d (i.e. mean of iodine intake in 16 d was calculated for each participant and then the median of these means was calculated); percentile: percentiles of individual mean intake for 16 d; median 2: median of iodine intake over 24 h in all survey days (1920 d, 120 subjects multiplied by sixteen survey days per sex).
Table 4 compares the iodine intake of the younger and older subject groups. When calculated based on Method A, the younger participants consumed significantly less iodine than the older participants (P= 0·0006 in women and P= 0·0001 in men). Habitual intake in most of the younger participants was between the RDA and UL of the Japanese 2015 DRI, but exceeded 3000 μg/d (UL of DRI for Japanese 2015) in 20·6 % of older women and 18·2 % of older men, and none consumed less than 130 μg/d (RDA of Japanese 2015 DRI).
Table 4 Calculated and habitual iodine intake estimated with the Best-power method (μg/d) by age and sex among 240 Japanese adults (Mean values, standard deviations, medians, 25th and 75th percentiles, number of subjects and percentages)
* Statistical differences in the median were calculated using the Wilcoxon rank-sum test.
† Mean and median were the mean and median of individual mean intake of sixteen recording days based on Method A data (i.e. mean and median were calculated after calculation of mean intake of sixteen recording days for each person).
‡ The percentage shows the proportion of participants whose habitual iodine intake was above the tolerable upper intake level (3000 μg/d) or below the RDA (130 μg/d) in the Dietary Reference Intakes for Japanese version 2015.
§ Younger: 30–49 years old; older: 50–69 years old (women) and 50–76 years old (men).
The contribution of each food group according to the STFCJ to total iodine intake is shown in Table 5. Kelp made the greatest contribution to iodine intake (60 %), followed by soup stock (30 %). Major edible seaweeds in Japan such as hijiki (Hijikia fusiforme) and wakame (Undaria pinnatifida) contributed 4 and 2 %, respectively.
Table 5 Contribution (%) of each food group to total iodine intake among 240 Japanese adults

* Food groups are defined in the Standard Tables of Food Composition in Japan 2010.
† Soup stock includes soup stock made from kelp or from both kelp and bonito and instant granule-type soup stock.
‡ Hijiki: Hijikia fusiforme; Wakame: Undaria pinnatifida.
Discussion
We developed a database of the iodine content in food by combining values in the STFCJ with those from the literature and similar foods, as well as imputed values from a wide variety of foods. Based on this database, the median of individual mean iodine intake was 2310 μg/d for women and 1918 μg/d for men. By sex, the median habitual iodine intake was 857 μg/d for women and 1031 μg/d for men and was higher in older than in younger participants. None of the older participants were estimated to consume less iodine than the RDA for Japanese based on habitual intake, whereas about 3 % of younger participants were below the RDA. Kelp and soup stock contributed nearly 90 % of total iodine intake.
This is the first study to reveal that the distribution of iodine intake among Japanese adults is skewed. Further, it is the first study to evaluate habitual iodine intake from an imputed iodine content database and DR, which included information on iodine-rich food items such as soup stock. Previously, iodine intake among Japanese adults was estimated at 1000–3000 μg/d based on a review of literature( Reference Zava and Zava 3 ). Four more recent studies reported the estimated iodine intake of Japanese based on diet records( Reference Tsubota-Utsugi, Imai and Nakade 7 , Reference Imaeda, Kuriki and Fujiwara 11 – Reference Kato, Otsuka and Imai 13 ); however, all except one did not impute values missing in the STFCJ, and iodine intake was lower than that estimated in our results (mean iodine intake in these studies was 638–2160 μg/d). One study that imputed some values missing in the STFCJ did not include information about soup stock( Reference Imaeda, Kuriki and Fujiwara 11 ). Iodine intakes calculated in this previous study were lower than ours, even compared with our results using the soup stock with the low iodine content (median iodine intake of women in the present study was 1103 μg/d v. 882 μg/d in the previous study). Considering that soup stock accounted for 30 % of total iodine intake in the present study and that seaweed intake in the previous study was lower than in National Health and Nutrition Survey, our results do not appear too discrepant from the previous results using dietary records and appear to provide better information about the iodine intake of Japanese than these previous reports.
Iodine intake was lower in the younger than in the older participants. This result is consistent with previous studies in Japan( Reference Tsukada, Urakawa and Yokoyama 12 ). Although the calculation method differed from ours, one study has reported that iodine intake was less than the RDA in 30 % of Japanese students (age 21 years)( Reference Tsukada, Urakawa and Yokoyama 12 ). Since the younger group in the present study included people aged 30–49 years, the iodine intake of only about 3 % of our participants was below the RDA for Japanese. However, younger Japanese may tend to consume less seaweeds. This speculation is supported by the National Health and Nutrition Survey in Japan( 36 ) and also the Family Income and Expenditure Survey in Japan, which found that expenditure for kelp and seaweeds was lower in younger people( 37 ). The Family Income and Expenditure Survey in Japan also showed that the quantity of kelp purchased by households has decreased in the last 20 years, among both younger and older generations. Since the dietary record in the present paper was obtained in 2002 and 2003, the iodine intake of Japanese might now be less than the values we calculated in the present paper. This supports the possibility that iodine deficiency will occur in Japan in future, consistent with changes in dietary habits. Although salt iodisation is not implemented in Japan now, this trend of decreasing iodine intake should be carefully followed. Moreover, careful observation for subclinical deficiency is required even today, particularly for the younger generations.
Regarding the older participants, the proportion of subjects whose habitual iodine intake was over the UL of the DRI for Japanese 2015 was 18–21 % in the present study. Habitual intake for women calculated in another study without information on soup stock was under the UL( Reference Imaeda, Kuriki and Fujiwara 11 ). The high percentage in the present study might be derived from the imputation of missing values. Japanese consume seaweed intermittently, particularly kelp. In the present study, the frequency of kelp intake over 16 d ranged from 0 to 12 d, and kelp was consumed on average about once every 7 d. This intermittency and other biological functions might lead to lower clinical impact, even if iodine intake is over the UL value. However, although an association between subclinical hypothyroidism and excess iodine intake assessed with urine samples has been reported( Reference Konno, Makita and Yuri 38 ), the relationship between iodine intake and clinical outcomes requires further investigation. Moreover, symptoms related to insufficient and excess iodine among Japanese should be examined by age.
Mean iodine intake and the major food groups contributing to total iodine intake totally differ between Japan and Western countries. This is particularly due to the Japanese consumption of kelp. Nevertheless, when we calculated mean iodine intake in diets without seaweeds, soup stock or seasonings with soup stock, using the data collected on days without their consumption (17–19 % of 16 d diets), the mean intake was 86 μg/d for women and 100 μg/d for men. The contributing food groups were fish (37–47 %) and dairy products (20–31 %). These are consistent with Norwegian( Reference Dahl, Johansson and Julshamn 39 ) and UK data( Reference Bates, Lennox and Prentice 40 ), even though the main contributor in these countries is dairy products. Therefore, although everyone consumed seaweed and soup stock at least once every 16 d in the present study, people in Japan who do not frequently consume a Japanese-type diet, including seaweed, are at a similar risk of iodine deficiency as people in other countries. In contrast, iodine intake among people in other countries without a culture of seaweed consumption might be increased by consumption of kelp products, including soup stock. In this regard, frequent consumption or consumption without notification that the foods include seaweeds such as kelp may lead to excess consumption.
Several limitations of the present study warrant mention. First, iodine content was not available for all foods, and some of the analytical values used for imputation were not analysed with the same analytical methods as at STFCJ. In addition, the estimations from similar foods or from recipes may be biased, and some processed items might include a small amount of seaweed extract to improve flavour. Nevertheless, the influence of missing values and different analytical methods was not particularly large, because missing values for fish, which might contain at least some iodine, accounted for only 0·8 % of the total food items in the dietary records; and kelp and seaweeds, which accounted for nearly 90 % of total iodine intake, were measured with ICP-MS. Further studies comparing calculated v. analysed iodine intake from sampling diets have reported similar results for diets without kelp products when missing iodine contents were imputed with the iodine values of similar foods, or with the mean iodine content of respective food groups( Reference Yoshida, Kojima and Miyoshi 41 , Reference Matsumoto, Yoshida and Sawamura 42 ). Second, the reliability of the dietary assessment for iodine based on the food composition table has not been definitely established. Actual iodine intake is naturally influenced by the iodine contents of foods, especially kelp and soup stock in Japan. Even when values in a standard composition table are used, actual intake might differ from calculated values, because the iodine content of foods in the table are the mean of iodine contents in random samples. Given that the iodine content of kelp varies( Reference Yoshida 20 ), the mean is likely quite different from the actual iodine content in kelp in any particular dish. A discrepancy between actual and calculated values is thus unavoidable when intake in individual subjects is estimated using a DR, particularly in those with high consumption of kelp or soup stock. Mean iodine intake in individual subjects can be estimated more accurately if the number of survey days is large, because differences between content in standard composition tables v. that in actually consumed foods is expected to occur randomly. Sample size was not specifically determined for the present study, and it is possible that a 16 d DR with 120 participants per sex was not sufficient to estimate iodine intake, albeit that the DR used in this analysis was considered to be as long as practically possible. Since no other established method for retrospectively assessing habitual iodine intake existed in Japan, we used the Best-power method in the present study. In addition, estimation of actual iodine content in soup stock and kelp products is considered difficult, because both soup stock recipes and the amount of cooking loss might differ between dishes. These difficulties are specific to iodine and might indicate that iodine levels derived from the standard composition table are less reliable than those for other nutrients. Certainly, Matsumoto et al. ( Reference Matsumoto, Yoshida and Sawamura 42 ) reported that differences between calculated and analysed values were obvious in kelp-containing diets. To deal with these uncertainties, we estimated intake using several assumptions for the iodine content of soup stocks. Third, although dietary records can assess details of the individual diet, this method is self-reported and the possibility of measurement error remains. Seaweed is regarded as a ‘healthy food’ and might be subject to over-reporting. To minimise error, we provided participants with written and oral instructions on how to maintain their dietary record, and dietitians performed both coding and checking. Nevertheless, comparison with a biomarker such as urinary iodine concentration is required. Fourth, it is possible that the data set from the DR and iodine intake, which had a skewed distribution, did not perfectly fit the Best-power method. However, the 24 h recall method has not been established in Japan and the Best-power method is robust to mild departures from normality and can be applied to data from complex surveys( Reference Dodd, Guenther and Freedman 35 ). Moreover, the iodine intake of Japanese was characterised by the intermittency of high iodine-containing foods, with individuals having days with both low and high consumption( Reference Tsubota-Utsugi, Imai and Nakade 7 ). This was the reason for the difference between median 1 (median of the mean of 16 d) and median 2 (median of all survey days) and might also be concerned with the fitness of the Best-power method. Although the habitual intake calculated from the statistical program is the ‘model’ habitual intake, it is considered to be valuable for Japanese nutrition policy and future research. Finally, participants were volunteers and might have been more health conscious than others. However, the body weight and height of participants were close to the data from National Health and Nutrition Survey in Japan( 36 ). Participants were selected from four areas in Japan, both urban and rural. This selection from various areas might have decreased the impact of regional cultural differences in seaweed consumption. Although data from more participants are required, the participants in the present study can be generalised to Japanese populations of the same age range.
In conclusion, we compensated for missing data on iodine content in the Standard Table of Food Composition in Japan, and estimated the iodine intake of Japanese. Since the habitual intake of about 10 % of participants was above the UL for Japanese, and in particularly given that intake was higher in older than in younger participants, future studies will investigate the association between iodine intake and excess symptoms. Meanwhile, lower seaweed consumption and iodine intake in younger generations indicate the need for careful observation for iodine deficiency, even in Japan.
Acknowledgements
The authors thank all the members and participants for their participation and data collection.
The present study was funded by the Ministry of Health and Welfare, Japan (H13 Health Sciences Research Grant Kenkoukagakusougoukenkyujigyou). The Ministry of Health and Welfare had no role in the design and analysis of the study or in the writing of this article.
The authors' contributions are as follows: R. K. developed the iodine food composition table, performed the statistical analyses and wrote the manuscript; K. A. assisted in the writing of the manuscript; S. S. designed the study, collected the data and assisted in the writing of the manuscript; N. H., A. N., A. M., H. T., M. F. and C. D. contributed to the study design, data collection and management. All authors read the final manuscript.
None of the authors has any conflict of interest to declare.