


Na is an essential nutrient, mainly provided by the salt contained in foods and table salt used as condiment. Nevertheless, excessive Na consumption has adverse health outcomes, including high blood pressure and an increased risk of CVD and stroke(Reference Aburto, Ziolkovska and Hooper1–Reference Strazzullo, D’Elia and Kandala6). The average level of Na consumption has been estimated to be 3·95 g/d (equivalent to 10 g of salt) in sixty-six countries worldwide(Reference Mozaffarian, Fahimi and Singh7), which is almost twice as much the amount recommended by the WHO (<2 g/d of Na)(8). Therefore, the reduction of population salt intake is a public health priority. However, quantification of discretionary salt (added by individuals) is particularly difficult in diet surveys(Reference McLean, Farmer and Nettleton9) and accurate monitoring of salt intake can be challenging.
As approximately 90 % of daily Na intake is excreted in the urine throughout the day(Reference Lucko, Doktorchik and Woodward10), 24-h urine collection is considered as the ‘gold standard’ method for assessing Na consumption(Reference McLean, Farmer and Nettleton9, Reference Elliott and Brown11). However, urine collections over a 24-h period are difficult to obtain, as this method is logistic and cost intensive as well as burdensome for participants, limiting its use in large-scale surveys and epidemiological studies(Reference Cogswell, Maalouf and Elliott12, Reference McLean13). To overcome these difficulties, alternative methods have been proposed, such as the use of spot and timed urine samples, which are easier and cheaper to collect, and better accepted by participants. Thereby, different equations have been developed to predict 24-h urinary Na (24-hUNa) excretion from spot urine samples(Reference Kawasaki, Itoh and Uezono14–Reference Zhou, Tian and Fu21). While most of these studies have been conducted in Asian populations(Reference Kawasaki, Itoh and Uezono14, Reference Tanaka, Okamura and Miura15, Reference Zhou, Tian and Fu21), recent validation studies have shown that the INTERSALT equation(Reference Brown, Dyer and Chan16) provided the least biased predictions in Western population(Reference Cogswell, Wang and Chen18–Reference McLean, Williams and Mann20). This sex-specific equation takes into account Na, K and creatinine concentrations from spot urine samples, age, sex, geographical region and BMI of the individuals.
The use of predictive equations from spot urine samples exhibits many advantages and appears promising for monitoring population Na intake, yet this method remains controversial as results differ depending on the studies and populations. Some previous studies concluded, however, that it may be a useful tool for monitoring 24-hUNa excretion at the population level, but predictions perform poorly at the individual level, due to day-to-day within-person and within-day variability of Na excretion(Reference McLean13, Reference Tanaka, Okamura and Miura15, Reference Cogswell, Wang and Chen18–Reference Ji, Sykes and Paul25). Therefore, accuracy and suitability of predicting equations need improvement. Most studies so far have focused on the timing of urine collection and on the benefits of using multiple spot urine samples to produce estimates(Reference Brown, Dyer and Chan16, Reference Allen, Zhao and Loria23, Reference Ji, Sykes and Paul25–Reference Wang, Cogswell and Loria29). Some authors also recommended the use of ‘population-specific’ equations or study-specific calibrations against 24-h urine collections to ensure the validity of spot urine samples to predict population Na intake(Reference Cogswell, Maalouf and Elliott12, Reference Brown, Dyer and Chan16, 22).
Our study has four objectives: (1) validation, whereby predicted 24-hUNa excretion from spot urine obtained by INTERSALT equation is compared with measured 24-hUNa excretion; (2) calibration on French data of the INTERSALT equation; (3) assessment of the original and calibrated INTERSALT equation to assess salt intake of French adults and (4) comparison of predicted salt intake from spot urine samples with self-reported salt intake from 24-h dietary recalls. Objectives (1) and (2) were conducted in a validation study of 193 healthy volunteers, and objectives (3) and (4) on a nationally representative sample of 1720 French adults.
Methods
Validation study
Study population
The study population included volunteers from a randomly selected sample of NutriNet-Santé study participants, involved in the Dietary Validation Study(Reference Lassale, Castetbon and Laporte30). The NutriNet-Santé study (ClinicalTrials.gov identifier: NCT03335644) is an ongoing web-based cohort launched in France in 2009, which included volunteers over 18 years old. Details of aims and methods have been described elsewhere(Reference Hercberg, Castetbon and Czernichow31). The Dietary Validation Study was conducted in 2012–2013 to investigate the validity of a web-based, self-administered dietary record tool against urinary biomarkers(Reference Lassale, Castetbon and Laporte30). It included a randomly selected sample of 199 participants of the NutriNet-Santé study, stratified by sex, age (<45 years, >45 years) and educational level (primary and secondary up to some college, university graduate). Participants were excluded if they were pregnant, had a known history of heart failure or diabetes. The sample size was calculated in accordance with the main objective of the Dietary Validation Study, that is 200 participants were needed to detect correlation coefficients greater than or equal to 0·17 at the 5 % significance level and with 80 % power. This sample size was also sufficient to detect a difference of 1 g around a mean of 8 g of salt intake per d compared with an average population of 2000 individuals (at the 5 % significance level and with 80 % power). The protocol of the study was approved by the Consultation Committee for the Protection of Participants in Biomedical Research of Paris Saint-Louis (no. 2011/22) and the French National Information and Citizen Freedom Committee (DR-2012-467). Participants provided written informed consent.
Study design
Data were collected during two visits performed in a clinical centre (Hôtel Dieu Hospital, Paris), both in a fasting state. At the first visit, anthropometric and clinical measurements were taken (height, weight, blood pressure) and participants were given instructions for the 24-h urine collection. Approximately 3 weeks later, a second visit was realised with the same clinical examination. At each of the two visits, a morning fasting spot urine was collected at the clinical centre. Between the two visits, three 24-h dietary records were completed and two 24-h urine samples were collected per participant. More details of material and methods are available elsewhere(Reference Lassale, Castetbon and Laporte30).
24-h urine collection
A written explanation of the 24-h urine collection process was provided to all participants with material necessary for collection. Volunteers were instructed to discard the first urine of the day of collection, and then to collect all urine passed during the next 24 h, including the first urine the following morning. They were given para-aminobenzoic acid pills to take throughout the day to check completeness of the urine collection. Participants had to record the start and finish times of urine collection, the time at which para-aminobenzoic acid pills were taken, any missing void (urine discarded during the collection) and medications taken during the 24-h period. The urine container was kept at room temperature in a dark place. Urine samples were processed less than 12 h after the end of the collection: they were weighed, carefully mixed and aliquoted into 1 ml samples and stored at –80°C. Urinary electrolyte levels in the two 24-h urine collections and in the two spot urine samples were analysed in the laboratory of the biochemistry platform of the University Hospital (CHU) of Grenoble. Na and K concentrations were measured by ion-selective electrodes (Siemens Dimension Vista), and creatinine concentration was measured by alkaline picrate kinetic (Siemens Dimension Vista). The intra-assay CV for all three measures were < 3 %.
Application study
Study sample
The study sample comprised all adults aged 18–74 years included in the French Nutrition and Health Survey (Etude Nationale Nutrition Santé, ENNS). The ENNS is a nationwide survey conducted in 2006–2007 to describe dietary intake, physical activity and nutritional status in a nationally representative sample of adults and children living in France. The protocol was approved by the Ethical Committee (Hôpital Cochin, Paris, no. 2264), the Consultative Committee on Information Treatment of the Ministry of Research and the French Data Protection Authority (authorisation no. 905481). All participants signed informed consents.
Study design
The ENNS is a cross-sectional study using a multistage sampling design, already described in detail elsewhere(Reference Castetbon, Vernay and Malon32). In brief, data collection included a questionnaire survey, three 24-h dietary recalls and a health examination with clinical and biochemical markers measurements for each participant. Social and demographic characteristics and physical activity were collected at home via face-to-face interview. Clinical (height, weight, blood pressure) and biochemical markers measurements were collected at health examination centres of National Health Insurance system, or at home with a nurse (if subjects did not want to go to a health centre). Recruitment was carried out for 1 year to take into account the seasonality of the diet.
Dietary recalls
Dietary intake was assessed using three non-consecutive 24-h dietary recalls, one of them being during the weekend, randomly distributed within a period of 2 weeks. Trained dietitians asked participants to describe everything they ate or drank the day before the interview, from midnight to midnight. Subjects gave information according to a precise and standard methodology detailed elsewhere(Reference Castetbon, Vernay and Malon32). Information on discretionary salt (added in cooking or at the table) was specifically collected, that is a summary of all food items consumed was provided, which participants had to review and describe if additional salt was consumed, and if so, in what quantity (household units or g).
Urine samples
On the day of health examination, participants were asked to collect first-morning urine and store it at +4°C. Samples were then carried up to the field laboratories within 4 h after collection in frozen containers and stored at –80°C until their transport to central laboratory at the end of the fieldwork. Na, K and creatinine concentrations were measured in the same laboratory using the same methods and materials as for the validation study. The intra-assay CV for all three measures were < 3 %.
Statistical methods
Covariates
BMI was calculated as weight (kg)/height2 (m2). The reference values used to define BMI classes (underweight <18·5 kg/m2, normal 18·5–24·9 kg/m2, overweight 25·0–29·9 kg/m2 and obese ≥30·0 kg/m2) were those recommended by the WHO(33). Tobacco status was categorised as: never smoke, former smoker and current smoker; alcohol use as abstainers and consumers (even occasional) and educational level as low (up to high school), medium (some college) and high (university graduate).
Characteristics of participants in the validation study were compared using t tests or χ2 tests, as appropriate. Analyses in the application study (ENNS) were weighted taking into account individual probabilities of inclusion, seasonal period of data collection and calibration based on national census data. Characteristics of participants in the application study were compared using tests for complex survey designs: t tests for continuous variables (adjusted Wald F statistic) and χ2 tests for frequencies (Rao and Scott second-order corrected Pearson statistic).
Validation study
Twenty-four-hour urine collections were determined as valid if collection time was between 22 and 26 h, urine volume was ≥ 500 ml, estimated volume missed void was less than 5 % of the total volume and creatinine was >10 mg/kg for women or >15 mg/kg for men.
The mean 24-hUNa excretion (mmol/d) from the two 24-h urine collections and the mean Na, K and creatinine concentrations (mmol/l) from the two spot samples were calculated. If only one spot urine sample was collected or only one 24-h urine collection was considered as valid, the only available value was used. Due to the skewed distribution, geometric means (and 95 % CI) were presented.
The INTERSALT formula developed in North American and European populations(Reference Brown, Dyer and Chan16) was used to estimate 24-hUNa excretion from spot urine samples. The following sex-specific equations for Western Europe were used:
For men:
Predicted 24-hUNa excretion (mmol/d) = 17·05 + (0·46 × spot Na (mmol/l)) – (2·75 × spot creatinine (mmol/l)) – (0·13 × spot K (mmol/l)) + (4·10 × BMI (kg/m2)) + (0·26 × age (years)).
For women:
Predicted 24-hUNa excretion (mmol/d) = 12·82 + (0·34 × spot Na (mmol/l)) – (2·16 × spot creatinine (mmol/l)) – (0·09 × spot K (mmol/l)) + (2·39 × BMI (kg/m2)) + (2·35 × age (years)) – (0·03 × age2 (years)).
The measured and predicted 24-hUNa excretions were compared by the Mann–Whitney U test.
Spearman correlation coefficients were calculated to examine their relationship for the total sample and separately for men and women.
Bland–Altman plots(Reference Bland and Altman34) were used to validate the agreement between measured and predicted 24-hUNa excretion. The degree of bias (i.e. mean difference between measured and predicted 24-hUNa excretion) and 95 % limits of agreement were estimated.
The percentage error(Reference Rhee, Kim and Shin35) was calculated as: 1·96 × (sd of the difference between measured and predicted 24-hUNa excretion)/(mean of measured 24-hUNa excretion) × 100.
Finally, the ratio of the geometric means of measured to predicted 24-hUNa excretions was used to quantify the difference between measure and prediction: a ratio of 1 representing no difference between measured and predicted 24-hUNa excretion; a ratio <1 reporting an overestimation of the prediction and a ratio >1 an underestimation. This ratio, expressed as a percentage, was then used to calibrate the predictive INTERSALT equation on the French adult population and thus provides a corrected equation.
Application study
A first estimation of daily Na intake was realised from the 24-h dietary recalls. To get the salt equivalent, Na intake was multiplied by 2·54.
A second estimation of daily Na intake was realised from urinary spot samples: 24-hUNa excretion was estimated from predictive INTERSALT equation, and, assuming that approximately 93 % of Na intake is urinary excreted in 24 h(Reference Lucko, Doktorchik and Woodward10), predicted daily Na intake was then calculated as follows:
Predicted Naintake (mg/d) = 24-hUNaexcreted (mmol/d) × 23 (conversion factor from mmol of Na to mg)/0·93.
The two Na intake estimations (from dietary recalls and from INTERSALT equation) were compared by t tests and the difference was quantified by the ratio of the two values and expressed as a percentage.
Finally, all predicted values (24-hUNa excretion, predicted Na intake and salt equivalent) were recalculated by applying the calibration coefficients obtained in the validation study.
All analyses were carried out with Stata® software version 14 (StataCorp). All tests were two-tailed, and P values <0·05 were considered statistically significant. Survey data analyses (in the application study) were realised using the ‘svyset’ function (for the declaration of the complex sampling scheme) and ‘svy:’ option.
Results
Validation study
Both 24-h urine collections were invalid for four women and two men, hence six participants were excluded from the analysis. The validation sample was then composed of 102 men (52·8 %) and 91 women (47·2 %; Table 1). Mean age was 50·1 (sd 16·5) years and mean BMI was 23·9 (sd 3·5) kg/m2. Spot urine samples concentration of electrolytes and measured and predicted 24-hUNa excretions are presented in Table 2. The geometric mean Na concentration was 72·4 mmol/l for men and 63·5 mmol/l for women. A statistically significant difference was observed between men and women for creatinine urinary concentration but not for Na and K. The geometric mean of measured 24-hUNa excretion was 123·3 mmol/d (2836 mg/d) and the one predicted was 108·0 mmol/d (2484 mg/d). The predicted 24-hUNa excretion was significantly different from the measured 24-hUNa (P < 0·001). Urinary Na excretion was significantly higher in men than in women (P < 0·001) for both 24-hUNa excretions derived from direct measurement and prediction. Correlation between measured and predicted 24-hUNa excretions was moderate in men (r 0·43; P < 0·001) and weak, albeit statistically significant (r 0·34; P < 0·001) in women (Table 3).
Table 1. Baseline characteristics of participants in the validation study (n 193)
(Mean values and standard deviations; percentages and 95 % confidence intervals)

* P value for the difference between men and women was calculated by t test or χ 2 test as appropriate.
Table 2. Spot urine samples concentration of electrolytes and 24-h urinary sodium (24-hUNa) excretion (measured and predicted) in the validation study (n 193)
(Geometric means and 95 % confidence intervals)
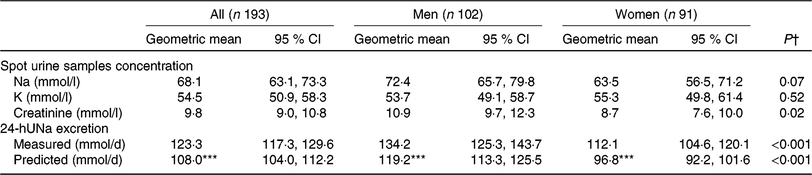
*** Mean value was significantly different from that for 24-hUNa measured (P < 0·001; Mann–Whitney U test).
† P value for the difference between men and women was calculated by the Mann–Whitney U test.
Table 3. Agreement between measured and predicted 24-h urinary sodium excretion in the validation study (n 193)
(Spearman correlation coefficients; mean values and standard deviations; 95 % limits of agreement)

*** P value for the Spearman correlation test was statistically significant (P<0·001).
The agreement between the measured 24-hUNa excretion and the prediction from spot urine samples by the INTERSALT equation was analysed by Bland–Altman plots (Fig. 1). The plots showed an underestimation at lower excretion level and overestimation at higher level. The degree of bias at the group level was 19·2 mmol/d (442 mg/d) and the agreement limits are from –61·4 to 99·7 mmol/d (–1412 to 2293 mg/d) (Table 3). The ratio of geometric means indicates that the measured 24-hUNa excretion was on average 14 % higher than the predicted (13 % in men and 16 % in women; Table 3), therefore that the equation underestimated the Na excretion. Furthermore, the percentage error was 60·4 % (equivalent for men and women).
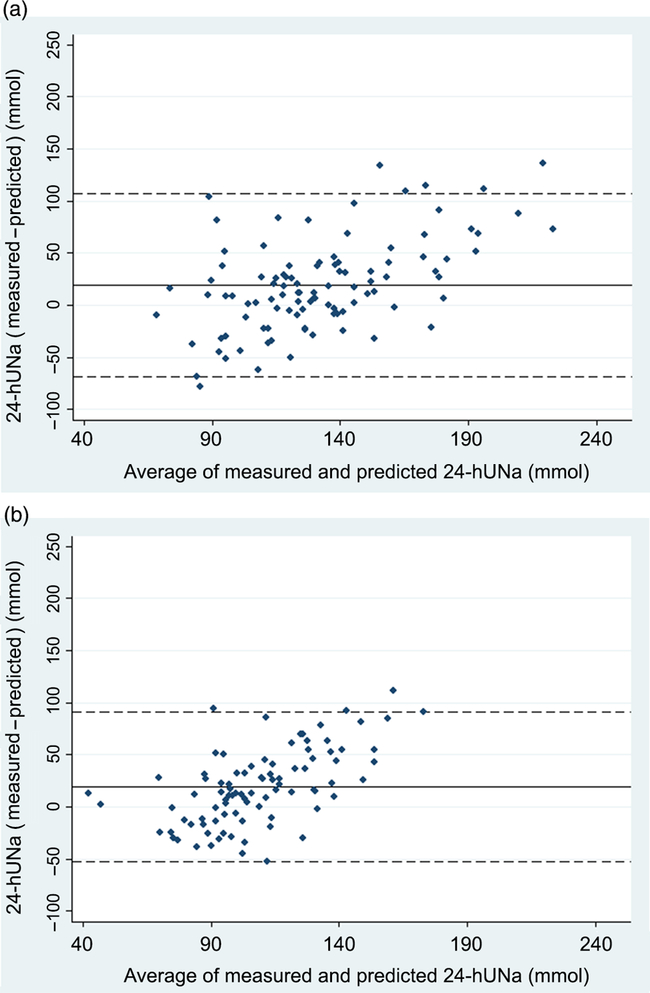
Fig. 1. Bland–Altman plots for agreement between measured 24-h urinary sodium (24-hUNa) excretion and predicted 24-hUNa excretion from spot urine samples and INTERSALT equation in the validation study in 102 men (a) and 91 women (b). The solid line represents the mean of paired difference and the dashed lines represent the 95 % limits of agreement (mean ±2 sd).
Application study
Among the 2102 adults included in the ENNS study who participated in the biochemical part, 1720 (81·8 %) had complete spot urine samples (a specific weighting strategy based on census data has been realised for this subpopulation). Women represented 50·3 % of the weighted population. The weighted mean age was 45·2 years for total population, with women older than men (46·0 v. 44·5 years; Table 4).
The weighted mean of Na, K and creatinine were 93·1 mmol/l, 31·4 mmol/l and 11·0 mmol/l, respectively (Table 5). Concentrations were higher in men than in women. The mean Na intake measured from the 24-h dietary recalls was 3159 mg/d (3681 mg/d for men and 2642 mg/d for women), whereas the mean predicted Na intake by the INTERSALT equation was 3188 mg/d (3480 mg/d for men and 2898 mg/d for women). Na intake reported in the 24-h dietary recalls was greater than that estimated by the INTERSALT equation by +5·5 % in men (P<0·01), but lower in women (–9·7 %; P<0·001).
Table 4. Baseline characteristics of participants in the application study (n 1720)
(Mean values and standard deviations; percentages and 95 % confidence intervals)

* P values were calculated by design-based t tests or χ 2 tests as appropriate.
Table 5. Urine spot samples electrolyte concentrations and estimations of daily sodium intake and excreted in the application study (n 1720)
(Mean values and standard deviations)

24-hUNa, 24-h urinary sodium.
Difference between sodium intake estimated from 24-h dietary recalls and sodium intake predicted from INTERSALT equation (with and without calibration) was statistically significant: ** P<0·01, *** P<0·001 (t test).
† P values were calculated by design-based t tests or χ 2 tests as appropriate.
‡ n 1718 (662 men/1056 women).
§ n 1719 (662 men/1057 women).
‖ Predictions from INTERSALT equation using spot urine samples.
¶ n 1717 (662 men/1055 women).
†† Predicted sodium intake was calculated using the following formula: 100 × 24-hUNa excreted/93; 93 % is the percentage of sodium which is excreted in 24 h compared with sodium intake.
‡‡ Corrected using calibration coefficient calculated in the validation study (13 % for men and 16 % for women).
When the INTERSALT calculated values were corrected using sex-specific calibration coefficients calculated in the validation study (+13 % for men and +16 % for women), the predicted Na intake was 3646 mg/d (3932 mg/d for men and 3362 mg/d for women), equivalent to 9·3 g of salt consumed daily (10·0 g for men and 8·5 g for women). Therefore, compared with the calibrated predicted values, Na intake calculated from dietary recalls was underestimated by 15·4 % (6·8 % among men and 27·2 % among women).
Discussion
This study assessed the validity of the predictive INTERSALT equation to estimate the 24-hUNa excretion from spot urine samples and produced calibration coefficients for the French adult population.
In the present validation study, while being significantly correlated (r 0·42; P<0·001), prediction was underestimated by 14 % compared with measured 24-hUNa excretion. Results of previous studies using the INTERSALT equation showed fluctuations in the accuracy of predictions(Reference Brown, Dyer and Chan16, Reference Cogswell, Wang and Chen18, Reference Mente, O’Donnell and Dagenais36, Reference Polonia, Lobo and Martins37), and some previous works also observed such an underestimation(Reference Kelly, Geaney and Fitzgerald19, Reference McLean, Williams and Mann20, Reference Rhee, Kim and Shin35, Reference Pfeiffer, Hughes and Cogswell38). To complement correlation coefficients, it is recommended to use a Bland–Altman analysis(Reference McLean, Farmer and Nettleton9, Reference Bland and Altman34) in validations studies. In our study, the mean bias (between measured and predicted 24-hUNa excretion) in Bland–Altman analysis was moderate (19·2 mmol/d) and comparable with that reported by Kelly et al. (Reference Kelly, Geaney and Fitzgerald19) for INTERSALT predictions based on morning urinary spots (15 mmol/d). Those results (significant correlation and moderate bias) show the possible use of the INTERSALT equation to predict 24-hUNa excretion from spot urine samples at a population level. They also provide calibration coefficients for the French population. However, similar to the results of Rhee et al. (Reference Rhee, Kim and Shin35), the limits of agreement (from –61·4 to 99·7 mmol/d) and the percentage error (greater than 60 %) show important variability around the mean difference and limit the use of this method at an individual level. So, our findings are consistent with the general consensus that spot urinary Na could be a useful alternative to 24-h urine collection in populations but a poor predictor of 24-hUNa excretion in individuals(Reference McLean13, Reference Cogswell, Wang and Chen18, Reference McLean, Williams and Mann20–22, Reference Ji, Sykes and Paul25, Reference Conkle and van der Haar39). This method may be useful to estimate global Na intake in the French population, but given the underestimation and the important variability, caution remains when using it for public health purposes. It can be used to estimate population-level salt intake in cross-sectional studies such as nationwide survey, and to adapt public health recommendations and actions, but its usefulness to evaluate actions may be limited by the relatively small changes in population salt intake that can be seen in response to population-level interventions over time(Reference Cappuccio and D’Elia40).
In the present validation study, correlations between predicted and measured 24-hUNa excretions (r 0·43 for men and r 0·34 for women) were below than those previously published(Reference Brown, Dyer and Chan16, Reference Cogswell, Wang and Chen18, Reference McLean, Williams and Mann20). It can be explained by the difference in the urine collection times between our study (including only morning spots) and the others (with urinary spot samples collected at different times). Indeed, metabolic studies indicate that urinary Na excretion displays circadian variations, and that Na would be more excreted in the afternoon and evening(Reference Wang, Cogswell and Loria29, Reference Dyer, Martin and Burton41, Reference Stow and Gumz42). Mann & Gerber(Reference Mann and Gerber27) showed that mean predicted 24-hUNa excretion from spot based on samples collected in the afternoon and evening was a more relevant approximation of real mean of 24-hUNa excretion compared with samples collected in the morning or overnight. In our study, although having two spots per participant in the validation study, all spot urine samples were collected in the morning due to protocol constraints. As mentioned in previous studies, the use of multiple spots, collected at different times of the day, would be a better indicator for predictions(Reference Brown, Dyer and Chan16, Reference Ji, Sykes and Paul25, Reference Mann and Gerber27, Reference Uechi, Asakura and Ri28).
In the application study, we found an average intake of 3159 mg/d (equivalent to ∼8 g/d of salt) using dietary recalls, which overestimates by 5·5 % in men and underestimates by 9·7 % in women compared with the INTERSALT predicted Na intake. The result obtained in women is consistent with another study which reported that Na intake measured from dietary recalls was subject to underestimation (about 10 % for women and 7 % for men in comparison with the Na biomarkers)(Reference Rhodes, Murayi and Clemens43). This is not found in men in the present study. This could be explained by a better estimate of Na intake in dietary recalls in men compared with women, or by other factors that could lead to further Na losses. Indeed, different factors have been reported to affect estimates of Na excretion such as health status, circadian variations, hydration status or excessive sweating, and some behaviours such as vigorous physical activity or short-term exposure to high temperature were not measured in this study. Our results show, however, that the estimation of Na intake by dietary recalls is fairly accurate in men, but that it requires some improvements in women for whom Na intake is largely underestimated (by almost 10 % in comparison with original INTERSALT prediction and by more than 27 % when applying calibration coefficients).
A strength of this study was the use of two 24-h urine collections and two spot urine samples to carry out the validation study. Wang et al. (Reference Wang, Cogswell and Loria29) reported important within-person variance in 24-h urines and timed spot urine samples (ranging from 16 to 29 % and 21 to 41 %, respectively) of mean excretion, concluding that repeated measurements are necessary to overcome within-person variation(Reference Uechi, Asakura and Ri28, Reference Iwahori, Ueshima and Miyagawa44–Reference Liu, Dyer and Cooper46). Another strength of this study was the use of three 24-h dietary recalls to estimate Na intake in general adult French population. Three 24-h dietary recalls have been reported to be optimal for estimating individual energy intake(Reference Ma, Olendzki and Pagoto47). In general, the method used in the present study meets the majority of the recommendations for validation studies reported by McLean et al. (Reference McLean, Farmer and Nettleton9) regarding the 24-h dietary recalls (multiple non-consecutive days, inclusion of an estimate of discretionary salt used), the 24-h urine collections (multiple non-consecutive collections per participant, undertaken over the same period of assessment as the dietary assessment, with the use of a suitable method to measure completeness) and the statistical analysis (multiple methods used, including correlation and Bland–Altman methods and with a sample size carefully calculated). Finally, the NutriNet-Santé and ENNS studies used for the present analysis are comparable, since these two studies employed the same methodology to assess dietary intake (the same 24-h dietary assessment instrument and a unique food composition table) and carried out their biological assays in the same laboratory.
However, some limitations should be noted. First, the timing of spot urine samples differed between the validation and application studies. In the validation study, morning spot urine samples were collected (likely not the first-morning urine as it was collected during the visit), while it was a first-morning urine spot sample (corresponding to overnight urine, collected at home) in the application study. Wang et al. (Reference Wang, Cogswell and Loria29) showed that overnight specimens had lower Na concentrations compared with morning specimens; therefore, this difference of protocol may have contributed to underestimate the 24-hUNa predictions made in the application sample. However, the morning sample in the validation study was done in a fasting state and may not differ that much from an overnight sample. Second, only healthy volunteers were included in the validation study. Previous work has studied the non-representative nature of the overall sample of NutriNet-Santé study where women and well-educated individuals are over-represented compared with national data(Reference Andreeva, Salanave and Castetbon48). This volunteer bias was partly limited by the sampling strategy of the Dietary Validation Study. In addition, the ENNS showed that salt intake of French adults differed according to sex but not according to age or education level(49). Third, the INTERSALT equation has been developed and validated in a relatively young population of adults (20–59 years)(Reference Brown, Dyer and Chan16) and recent work showed that this equation was not consistently valid for older adults(Reference Allen, Zhao and Loria23). However, the mean age was 50 years in the present validation study (age range 23–83 years), so caution is advised when extrapolating from the results of underestimation of the mean Na intake.
In summary, we found that dietary salt intake in French adults is high and above the WHO recommendations and that the use of a spot urine collection remains an acceptable alternative in monitoring and evaluating the Na level of the population by applying population-specific correction coefficients that we provide. However, spot urine samples are insufficient to estimate individual salt intake, and the 24-h urine collection remains the gold standard for Na intake assessment. Further research is needed to find more reliable methods of dietary assessment of salt intake.
Acknowledgements
The authors thank all the staff involved in this study: the dietitians, the nurses and physicians from the health examination centres of the French National Health Insurance System and the Cetaf (Centre Technique d’Appui et de Formation des Centres d’Examens de Santé).
The NutriNet-Santé Study was supported by the French Ministry of Health, Santé publique France (former Institut de Veille Sanitaire and Institut National de la Prévention et de l’Education pour la Santé), the Fondation pour la Recherche Médicale (FRM), the Institut National de la Santé et de la Recherche Médicale (INSERM), the Institut National de la Recherche Agronomique (INRA), the Conservatoire National des Arts et Métiers (CNAM) and the University of Paris 13. The Dietary Validation Study was funded by Santé publique France (former Institut de Veille Sanitaire) and supported by grants from the Région Ile de France (CORDDIM). The Etude Nationale Nutrition Santé (ENNS survey) was supported by Santé publique France (former Institut de Veille Sanitaire), the University of Paris 13 and the Caisse nationale d’Assurance maladie des Travailleurs salaries (CnamTS).
C. L., K. C., V. D., M. V., S. H., P. G. and E. K. G. designed the research; D. G. and P. F. carried out the biomarker analyses; E. E., B. S. and C. V. analysed the data and performed the statistical analysis; E. E. and C. V. wrote the initial draft; C. L., K. C., V. D., B. S., M. V., D. G., P. F., S. H., P. G. and E. K. G. modified and completed the manuscript. All authors read and approved the final manuscript.
The authors declare that there is no conflict of interest.


