


In broiler production, many factors such as infectious diseases, stress and mycotoxins can result in immunosuppression(Reference El-Abasy, Motobu and Nakamura1), which may decrease growth performance and increase disease susceptibility and mortality(Reference He, Yang and Guo2, Reference Tayade, Jaiswal and Mishra3), causing great economic losses(Reference El-Abasy, Motobu and Nakamura1, Reference Fussell4). Minimising immunosuppression and its impact is an important strategy for realising the full potential of genetic and nutritional advancements for efficient production in the broiler industry(Reference Fussell4, Reference Hoerr5). Despite the development of potent new antibiotics, the frequency of opportunistic infections, primarily attributed to stress-associated immunosuppression, has increased in economically important domestic food animals(Reference El-Abasy, Motobu and Nakamura1). Moreover, the high incidence of drug-resistant bacteria from the frequent and continuous use of antibiotics poses big problems facing the poultry industry(Reference El-Abasy, Motobu and Nakamura1, Reference Huyghebaert, Ducatelle and Van Immerseel6). Thus, exploring a possible application of native immunostimulants to modulate the immune system is very important to compromised broilers, especially newly hatched broilers with immature immune function.
Saccharomyces cerevisiae is one of the most widely commercialised types of yeast, the cell wall components of which have been used in animal feeding during recent years(Reference Hooge7, Reference Morales-Lopez, Auclair and Garcia8). Typically, commercial yeast cell walls (YCW) are composed of 30–60 % polysaccharides (15–30 % of β-1,3/1,6-glucan and 15–30 % of mannan sugar polymers), 15–30 % proteins, 5–20 % lipids and no more than 5 % of chitin(Reference Aguilar-Uscanga and Francois9). Supplementation of broiler chicken diets with YCW or purified fractions has resulted in improvements of both body-weight gain and feed efficiency(Reference Chae, Lohakare and Moon10–Reference Morales-Lopez, Auclair and Van Immerseel13), which has been attributed to physiological effects on the intestinal mucosa(Reference Santin, Maiorka and Macari11–Reference Morales-Lopez, Auclair and Van Immerseel13). In addition to growth performance, YCW can also provide a widespread protection of animals against diseases, which has been primarily attributed to the stimulation of the immune system through yeast β-glucans and mannans. Numerous studies have shown that when ingested orally, yeast β-glucan can activate the cells of the immune system (macrophages), stimulate and stabilise the innate immune response in humans and a wide range of animals(Reference Abel and Czop14–Reference Cross, Jennings and Whitfield16). Exposure to β-glucan enhanced the proliferation and phagocytising efficiency of avian macrophages(Reference Guo, Ali and Qureshi17) and heterophils(Reference Lowry, Farnell and Ferro18). Similar to mammals, broilers supplemented with β-glucans had amplified humoral(Reference Guo, Ali and Qureshi17, Reference Zhang, Guo and Wang19) and cell-mediated immune responses(Reference Chae, Lohakare and Moon10, Reference Chen, Li and Chang20). Mannan oligosaccharide, another constituent of YCW, has been demonstrated to have at least three probable modes of action by which broiler performance is improved, which includes its ability to adsorb enteropathogenic bacteria, to improve gastrointestinal health and, finally, its ability to modulate the immune system(Reference Hooge7, Reference Shashidhara and Devegowda21). Although many studies have been conducted to characterise the effects of YCW on the performance and immunity of broiler chickens(Reference Morales-Lopez, Auclair and Garcia8, Reference Santin, Maiorka and Macari11–Reference Morales-Lopez, Auclair and Van Immerseel13, Reference Guo, Ali and Qureshi17, Reference Zhang, Guo and Wang19, Reference Shashidhara and Devegowda21), however, most of these studies have been conducted with healthy broilers without challenge conditions. Few studies have been carried out to evaluate these effects of YCW in immunosuppressed broiler chickens.
In the present study, we used a well-documented model to induce immunosuppression in broiler chickens by injecting cyclosporine A (CSA), a potent immunosuppressive agent that has been extensively used to study the importance of cellular immunity in chickens, turkeys and pheasants(Reference Rubbenstroth, Dalgaard and Kothlow22). The purpose of the present study was to investigate the effects of YCW obtained from S. cerevisiae of the yeast extract industry on the growth performance and immune function of CSA-treated, immunosuppressed broiler chickens.
Experimental methods
Birds and management
The animal protocol for the present study was approved by the Institutional Animal Care and Use Committee of the Huazhong Agricultural University (Wuhan, China). A total of 240 day-old commercial male broiler chicks (Arbor Acres, Wuhan, China) were randomly allocated into four treatments based on initial body weight (P>0·05, average body weight of 43·6 (sem 0·4) g). The chicks were placed in twenty-four 1 m2 wire cages with six replicate pens per treatment and ten chicks per pen. For broilers, two non-medicated maize–soyabean-based basal diets were formulated to meet or exceed the nutrient requirements as recommended by the National Research Council (1994) during the starter (days 1–21) and finisher (days 22–42) periods (Table 1). The experimental house was provided with forced ventilation, artificial light and air conditioning. The temperature inside the house on arrival was 32°C and was decreased by 3°C each consecutive week until 20°C through to slaughter. The lighting programme was 23 h of light for the first 4 d, 20 h until 10 d and 18 h afterwards. Feed and water were provided for ad libitum consumption throughout the 42 d of experimentation.
Table 1 Ingredient composition and calculated analysis of the starter (days 1–21) and finisher (days 22–42) basal diets for broiler chicks*
CP, crude protein; ME, metabolisable energy.
* The two dietary treatments were as follows: (1) the control and cyclosporine A (CSA) groups were fed the maize–soyabean-based basal diet containing 0 % yeast cell walls (YCW); (2) the YCW and YCW+CSA groups were fed the basal diet into which 0·3 % YCW was added at the expense of maize. (Because the cell walls are rich in carbohydrate, they replaced maize.)
† Provided per kg of feed: vitamin A, 5500 IU (1·65 mg); vitamin D3, 1100 IU (0·0275 mg); vitamin E, 11 IU (7·348 mg); vitamin K3, 1·1 mg; vitamin B6, 2·2 mg; vitamin B12, 0·0066 mg; riboflavin, 4·4 mg; pantothenic acid, 11 mg; choline chloride, 220 mg; folic acid, 0·55 mg; biotin, 0·11 mg; thiamin, 2·2 mg; ethoxycarbonyl quinoline, 125 mg; Mn, 120 mg; Zn, 100 mg; Fe, 60 mg; Cu, 10 mg; I, 0·46 mg.
Experimental design
Treatments included (1) non-challenged control (Control, broilers fed a control diet and injected with sterile saline), (2) non-challenged control+0·3 % YCW (YCW, broilers fed a 0·3 % YCW diet and injected with sterile saline), (3) CSA-challenged group (CSA, broilers fed the same control diet and challenged with CSA); (4) CSA-challenged+0·3 % YCW (YCW+CSA, broilers fed the same 0·3 % YCW diet and challenged with CSA). The dose of 0·3 % YCW (composed of β-glucan ≥ 20 %, mannan sugar polymers ≥ 15 %, chitin ≥ 2·5 % and crude protein ≤ 35 %; Angel Yeast Company, Limited, Yichang, China) was chosen according to previously published studies(Reference Santin, Maiorka and Macari11–Reference Morales-Lopez, Auclair and Van Immerseel13) and our pilot trial results. On days 1–4 and 22–25 of the trial, the CSA and YCW+CSA groups were subcutaneously injected with CSA (Sigma-Aldrich, Inc., St Louis, MO, USA) at a dosage of 50 mg/kg body weight twice daily(Reference Poonia and Charan23–Reference Nowak, Kai and Peck26), and the control and YCW groups were subcutaneously injected with an equivalent amount of sterile buffered saline.
Performance parameters
Cage was the experimental unit for performance. Birds were group weighed by cage at 1, 21 and 42 d of age. Feed intake was monitored by cage at 21 and 42 d of age. Average daily weight gain (DWG), daily feed intake (DFI) and feed conversion ratio (FCR) were calculated for each period and for the overall experiment.
Peripheral blood lymphocyte blastogenic assay
To assess the cellular immune responses of the birds, a rapid colorimetric assay using 3-(4,5-dimethylthiazol-2-yl)-2,5-diphenyltetrazolium bromide (MTT) was applied to evaluate lymphocyte blastogenic response to mitogens in the peripheral whole blood according to the method of Jaradat et al. (Reference Jaradat, Vila and Marquardt27) and Kondo et al. (Reference Kondo, Sugiura and Kamada28). Briefly, 2 ml of the whole blood were collected from the brachial vein of twelve birds per treatment (two birds/replicate pen) at 21 and 42 d of age (the same birds were caught and tested at 21 and 42 d of age unless they had died during the interval) with a heparinised syringe. Then, the blood samples were placed in sterile conical tubes and centrifuged at 50 g for 11 min. The plasma and buffy coats were transferred to another tube, where the plasma was removed by centrifugation at 400 g for 5 min. Cells were washed twice with T-cell medium (Roswell Park Memorial Institute (RPMI)-1640 medium (GIBCO/BRL, Eggenstein, Germany) supplemented with 2 % of penicillin–streptomycin–neomycin (5000 U/ml (3·125 mg/ml), 5 mg/ml, 10 mg/ml, in 0·9 % NaCl; all from Sigma-Aldrich, Inc.)), centrifuged at 400 g for 5 min, resuspended in T-cell medium and counted using the trypan blue exclusion method. Viable cells were adjusted to a concentration of 2·0 × 107/ml with T-cell medium.
Then, 50 μl of peripheral blood lymphocytes cell suspension were added to a ninety-six-well flat-bottom microplate (PerkinElmer, Inc., Norwalk, CT, USA) containing 50 μl of mitogen solution or medium (for non-stimulated cells). Plates were incubated at 40°C in the presence of 5 % CO2 and 95 % humidity for 72 h. Mitogen-induced stimulation was performed by phytohaemagglutinin-P (Sigma-Aldrich, Inc.). RPMI-1640 medium supplemented with 10 mm-4-(2-hydroxyethyl)-1-piperazineethanesulfonic acid, 0·05 mm-2-mercaptoethanol, 2 mm-l-glutamine, 1 mm-sodium pyruvate, sodium bicarbonate (2 mg/ml), penicillin (100 IU/ml; Leica Microsystems, Solms, Germany), streptomycin (100 μg/ml) and 10 % heat-inactivated fetal calf serum (Sigma-Aldrich, Inc.) was used as a culture medium throughout the study.
In the MTT assay, 10 μl of MTT (5 mg/ml in PBS; Sigma-Aldrich, Inc.) were added to each well containing cells with or without mitogen and mixed for the last 6 h of cultivation. At the end of the cultivation, the plates were centrifuged at 400 g for 10 min and the culture supernatant was discarded. Dimethyl sulfoxide (100 μl) was added to each well, after which the plates were vigorously shaken to ensure that all crystals were completely dissolved. The amount of MTT formazan produced during the incubation was measured by an ELISA reader (Labsystems, Helsinki, Finland) at a test wavelength of 550 nm and a reference wavelength of 630 nm. The results were based on the optical density (OD) at the wavelength of 550 nm (OD550) and are expressed as a stimulation index (SI), which was calculated as follows: stimulation index = mean OD550 of stimulated peripheral blood lymphocytes/mean OD550 of unstimulated peripheral blood lymphocytes.
Relative weights of lymphoid organs
At day 42 of age, the same twelve birds/treatment from which blood was taken were killed by cervical dislocation. The spleen, bursa of Fabricius and thymus (both right and left lobules) were excised and weighed after adherent fat from these organs was removed, and their relative weights (RW) are expressed as a percentage of live body weight.
Morphology of the bursa of Fabricius and spleen
For histological investigation, the bursa of Fabricius and spleen samples of twelve chickens from each treatment (two birds/replicate) were fixed in 10 % buffered formalin for 24 h, and after the standard histological procedure of dehydration, organ samples were embedded in paraffin. Serial cuts, 5 μm in thickness, were made by microtome and stained with haematoxylin and eosin. Histological analysis was performed with a DLMS Leica light microscope connected with a camera (Leica DC-300; Leica Microsystems, Solms, Germany). Software for image analysis was IM 1000 (Leica Imaging Systems Limited, Cambridge, UK).
Real-time quantitative RT-PCR
At day 42 of age, spleen samples of twelve chickens from each treatment (two birds/replicate) were aseptically excised, rinsed in cold PBS, minced, snap-frozen in liquid N2 and stored at − 80°C until analysis. Total RNA was extracted from individual spleen samples using the RNAgents Total RNA Isolation System (Promega Biotech, Madison, WI, USA) following the animal tissue protocol. OD at 260 nm was used to determine RNA concentrations. Each total RNA sample (2 μg) was reverse transcribed (Promega's Reverse Transcription System no. A3500) according to the manufacturer's instructions.
Quantitative real-time PCR analysis of spleen IL-1β, IL-6 and β-actin mRNA was performed using the Roche Lightcycler (Roche Diagnostics no. 2011468, Mannheim, Germany). Previously published primers for chicken IL-1β, IL-6 and β-actin were used for PCR(Reference Kaiser, Underwood and Davison29, Reference Humphrey, Stephensen and Calvert30), and the sequences of the primers used are listed in Table 2. PCR was performed in a reaction volume of 25 μl containing the reagents at the following final concentrations: 1 × SYBR Green qPCR Master Mix (2 × ; Roche Diagnostics Limited, Lewes, UK), forward primer 200 nm, reverse primer 200 nm and 2 μl of the RT product. PCR cycle conditions for all primer pairs consisted of an initial melting step at 95°C for 2 min, followed by forty cycles of denaturation (95°C for 15 s), annealing (annealing temperature for 15 s; Table 2) and extension (72°C for 45 s). After the forty cycles were completed, a melting curve analysis was performed to confirm that a single gene product was amplified, by heating samples at 65°C for 30 s and then increasing the temperature at a linear rate of 20°C/s to 95°C while continuously monitoring fluorescence. Relative quantification (i.e. change in the abundance of target gene relative to untreated control) of mRNA abundance was achieved using the 2− ΔΔC t method(Reference Livak and Schmittgen31). To correct for variation in RNA preparation and sampling, C t values for the cytokine-specific product for each sample were standardised using the C t value of the β-actin-specific product for the same sample. Differences in cytokine expression between treatment groups were presented as fold change normalised to data from the control group chicks.
Table 2 Primer sequences and annealing temperatures used for real-time quantitative RT-PCR
* Previously published primers by Kaiser et al. (Reference Kaiser, Underwood and Davison29).
† Previously published primers by Humphrey et al. (Reference Humphrey, Stephensen and Calvert30).
Statistical analysis
All data are presented as mean values with pooled standard errors of the mean and analysed by the one-way ANOVA procedure of the Statistical Package for Social Sciences 13.0 for Windows (SPSS, Inc., Chicago, IL, USA). Differences between means were determined using the least significant difference post hoc multiple comparison test, and the level of statistical significance was preset at P < 0·05.
Results
Growth performance
Growth performance parameters of broiler chickens were affected by YCW and CSA during the starter, finisher and overall periods, as shown in Table 3. Compared with the control birds, YCW supplementation significantly improved DWG at different periods and cumulatively (P < 0·05), but DFI and FCR were not influenced at any time point during the study (P>0·05), whereas the injection of CSA resulted in significantly decreased DWG (P < 0·01) and increased FCR (P < 0·05). There were no significant differences in DWG and DFI between the YCW+CSA and control birds except for FCR. In YCW+CSA birds, FCR was not affected during the starter period; however, during the finisher and overall periods, a significantly increased FCR (P < 0·05) was observed compared with the control birds. Furthermore, YCW+CSA birds had significantly increased DWG (P < 0·01) and decreased FCR (P < 0·05) compared with the CSA birds at different periods and cumulatively.
Table 3 Effect of yeast (Saccharomyces cerevisiae) cell walls (YCW) and cyclosporin A (CSA) on the growth performance of male broiler chicks
(Mean values with their pooled standard errors, n 60 (ten birds/replicate) from days 1–21 and n 48 (eight birds/replicate) from days 22–42)

DWG, daily weight gain; DFI, daily feed intake; FCR, feed conversion ratio.
a,b,c Mean values within a row with unlike superscript letters were significantly different (P < 0·05).
* The four treatments were as follows: (1) non-challenged control (Control, broilers fed a control diet and injected with sterile saline); (2) non-challenged control+0·3 % YCW (YCW, broilers fed a 0·3 % YCW diet and injected with sterile saline); (3) CSA-challenged group (CSA, broilers fed the same control diet and challenged with CSA); (4) CSA-challenged+0·3 % YCW (YCW+CSA, broilers fed the same 0·3 % YCW diet and challenged with CSA). On days 1–4 and 22–25 of the trial, the CSA and YCW+CSA groups were subcutaneously injected with CSA (Sigma-Aldrich, St Louis, MO, USA) at a dosage of 50 mg/kg body weight twice daily, and the control and YCW groups were subcutaneously injected with an equivalent amount of sterile buffered saline.
Peripheral blood lymphocyte blastogenic response
At days 21 and 42 of age, phytohaemagglutinin-P-induced T-lymphocyte blastogenesis in the YCW-fed chicks was significantly increased compared with that in the control (P < 0·05), CSA (P < 0·01) and YCW+CSA (P < 0·05) groups (Table 4). In contrast, the injection of CSA significantly decreased (P < 0·05) phytohaemagglutinin-P-induced T-lymphocyte blastogenesis compared with the control group (Table 4). There were no significant differences between the YCW+CSA and control birds (P>0·05), but there was a significant increase (P < 0·05) when compared with the CSA-treated birds.
Table 4 Effect of yeast (Saccharomyces cerevisiae) cell walls (YCW) and cyclosporin A (CSA) on the blastogenic response of peripheral blood lymphocytes from 21-d-old and 42-d-old male broiler chicks
(Mean values with their pooled standard errors, n 12 (two birds/replicate))
SI, stimulation index.
a,b,c Mean values within a row with unlike superscript letters were significantly different (P < 0·05). The same birds were caught and tested at days 21 and 42 of age unless they had died during the interval.
* The four treatments were as follows: (1) non-challenged control (Control, broilers fed a control diet and injected with sterile saline); (2) non-challenged control+0·3 % YCW (YCW, broilers fed a 0·3 % YCW diet and injected with sterile saline); (3) CSA-challenged group (CSA, broilers fed the same control diet and challenged with CSA); (4) CSA-challenged+0·3 % YCW (YCW+CSA, broilers fed the same 0·3 % YCW diet and challenged with CSA). On days 1–4 and 22–25 of the trial, the CSA and YCW+CSA groups were subcutaneously injected with CSA (Sigma-Aldrich, St Louis, MO, USA) at a dosage of 50 mg/kg body weight twice daily, and the control and YCW groups were subcutaneously injected with an equivalent amount of sterile buffered saline.
† A rapid colorimetric assay using 3-(4,5-dimethylthiazol-2-yl)-2,5-diphenyltetrazolium bromide was applied to evaluate blastogenic response to mitogens of peripheral blood lymphocytes. The results were based on the optical density (OD) at the wavelength of 550 nm (OD550) and are expressed as a SI, which was calculated as follows: SI = mean OD550 of stimulated peripheral blood lymphocytes/mean OD550 of unstimulated peripheral blood lymphocytes.
Relative weights of lymphoid organs
There was no difference in the RW of spleen among the groups; however, both the RW of the bursa of Fabricius and thymus were significantly affected by the YCW and CSA treatments (Table 5). Compared with the control birds, YCW-fed birds had a significantly heavier bursa of Fabricius and thymus RW (P < 0·05), whereas the bursa of Fabricius and thymus RW were significantly decreased (P < 0·01). There were no significant differences in the bursa of Fabricius and thymus RW between the YCW+CSA and control birds (P>0·05), but there was a significant increase (P < 0·01) when compared with the CSA-treated birds.
Table 5 Effect of yeast (Saccharomyces cerevisiae) cell walls (YCW) and cyclosporin A (CSA) on the relative weights of lymphoid organs of 42-d-old male broiler chicks
(Mean values with their pooled standard errors, n 12 (two birds/replicate)
a,b,c Mean values within a row with unlike superscript letters were significantly different (P < 0·05).
* The four treatments were as follows: (1) non-challenged control (Control, broilers fed a control diet and injected with sterile saline); (2) non-challenged control+0·3 % YCW (YCW, broilers fed a 0·3 % YCW diet and injected with sterile saline); (3) CSA-challenged group (CSA, broilers fed the same control diet and challenged with CSA); (4) CSA-challenged+0·3 % YCW (YCW+CSA, broilers fed the same 0·3 % YCW diet and challenged with CSA). On days 1–4 and 22–25 of the trial, the CSA and YCW+CSA groups were subcutaneously injected with CSA (Sigma-Aldrich, St Louis, MO, USA) at a dosage of 50 mg/kg body weight twice daily, and the control and YCW groups were subcutaneously injected with an equivalent amount of sterile buffered saline.
Morphology of the bursa of Fabricius and spleen
Treatments did not cause significant changes in the histological structure of the bursa of Fabricius (Fig. 1). Compared with the control, the typical changes in the spleen of YCW-fed birds are reflected in the increase of lymphocytes in the splenic cords and periarteriolar lymphoid sheath (PALS), whereas spleen of CSA-treated birds was characterised by a smaller number of lymphocytes in the splenic cords and less developed of PALS (Fig. 2). There were no significant changes in the histological structure of spleen between the YCW+CSA-treated birds and the control.

Fig. 1 Microphotographs of the chicken bursa of Fabricius (200 × magnification, haematoxylin and eosin staining). The four treatments were as follows: (1) non-challenged control ((a) Control, broilers fed a control diet and injected with sterile saline); (2) non-challenged control+0·3 % yeast cell walls (YCW) ((b) YCW, broilers fed a 0·3 % YCW diet and injected with sterile saline); (3) cyclosporine A (CSA)-challenged group ((c) CSA, broilers fed the same control diet and challenged with CSA); (4) CSA-challenged+0·3 % YCW ((d) YCW+CSA, broilers fed the same 0·3 % YCW diet and challenged with CSA). On days 1– 4 and 22–25 of the trial, the CSA and YCW+CSA groups were subcutaneously injected with CSA (Sigma-Aldrich, St Louis, MO, USA) at a dosage of 50 mg/kg body weight twice daily, and the control and YCW groups were subcutaneously injected with an equivalent amount of sterile buffered saline.
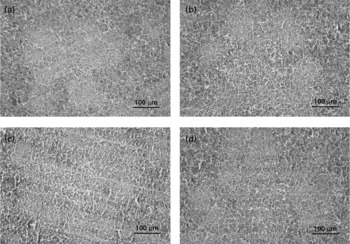
Fig. 2 Microphotographs of chicken spleen (200 × magnification, haematoxylin and eosin staining). The four treatments were as follows: (1) non-challenged control ((a) Control, broilers fed a control diet and injected with sterile saline); (2) non-challenged control+0·3 % yeast cell walls (YCW) ((b) YCW, broilers fed a 0·3 % YCW diet and injected with sterile saline); (3) cyclosporine A (CSA)-challenged group ((c) CSA, broilers fed the same control diet and challenged with CSA); (4) CSA-challenged+0·3 % YCW ((d) YCW+CSA, broilers fed the same 0·3 % YCW diet and challenged with CSA). On days 1–4 and 22–25 of the trial, the CSA and YCW+CSA groups were subcutaneously injected with CSA (Sigma-Aldrich, St Louis, MO, USA) at a dosage of 50 mg/kg body weight twice daily, and the control and YCW groups were subcutaneously injected with an equivalent amount of sterile buffered saline.
Splenic expression of IL-1β and IL-6
At day 42, the mRNA expression of pro-inflammatory cytokines IL-1β and IL-6 in the spleen was significantly up-regulated in the YCW group in comparison with the control (P < 0·05), CSA (P < 0·01) and YCW+CSA (P < 0·05) groups (Table 6), whereas CSA-treated birds had significantly decreased expression of IL-1β and IL-6 mRNA compared with the control (P < 0·01) and YCW+CSA (P < 0·01) groups (Table 6). Expression of IL-1β and IL-6 mRNA were not significantly different between the control and YCW+CSA groups (Table 6).
Table 6 Effect of yeast (Saccharomyces cerevisiae) cell walls (YCW) and cyclosporin A (CSA) on the relative expression of IL-1β and IL-6 in the spleen of 42-d-old male broiler chicks
(Mean values with their pooled standard errors, n 12 (two birds/replicate))
a,b,c Mean values within a row with unlike superscript letters were significantly different (P < 0·05).
* The four treatments were as follows: (1) non-challenged control (Control, broilers fed a control diet and injected with sterile saline); (2) non-challenged control+0·3 % YCW (YCW, broilers fed a 0·3 % YCW diet and injected with sterile saline); (3) CSA-challenged group (CSA, broilers fed the same control diet and challenged with CSA); (4) CSA-challenged+0·3 % YCW (YCW+CSA, broilers fed the same 0·3 % YCW diet and challenged with CSA). On days 1–4 and 22–25 of the trial, the CSA and YCW+CSA groups were subcutaneously injected with CSA (Sigma-Aldrich, St Louis, MO, USA) at a dosage of 50 mg/kg body weight twice daily, and the control and YCW groups were subcutaneously injected with an equivalent amount of sterile buffered saline.
† Relative gene expression was calculated using the 2− ΔΔC t method with β-actin as the endogenous control and the average ΔC t value for the control of the 0·0 % YCW-fed birds on day 42 as the calibrator.
Discussion
Immunosuppression is a syndrome rather than a disease and there are no ‘clinical’ signs. However, poor performance, uniformity problems, lower body-weight gain, increased FCR, frequent vaccine reactions, elevated mortality, common secondary bacterial infections and atrophy of lymphoid organs are all indicative of immunosuppression(Reference El-Abasy, Motobu and Nakamura1, Reference Hoerr5). To evaluate whether dietary YCW supplementation could improve the immune function of immunosuppressed broiler chickens, we used a well-documented CSA-induced immunosuppressive model for broiler chickens(Reference Rubbenstroth, Dalgaard and Kothlow22). In the present study, the CSA challenge significantly decreased the performance of broiler chickens, which is in line with the findings of Corrier et al. (Reference Corrier, Elissalde and Ziprin24). Additionally, broiler chickens treated with CSA had decreased in vitro lymphocyte proliferation and lower RW of the bursa of Fabricius and thymus, which indicates that CSA suppressed immune function in broiler chickens. This outcome is consistent with reports by previous workers(Reference Poonia and Charan23–Reference Nowak, Kai and Peck26), which was primarily attributed to CSA's selective and powerful inhibiting effects on the early phase of T-lymphocyte activation(Reference Tocci and Sigal32).
The worldwide trend towards eliminating antibiotic growth promoters in balanced feed has led to a search for alternatives that provide benefits similar to antibiotic growth promoters. The present results showed that dietary YCW supplementation significantly improved DWG compared with the control birds. Similar results with regard to the effect of YCW supplementation on performance have been reported in poultry(Reference Santin, Maiorka and Macari11–Reference Morales-Lopez, Auclair and Van Immerseel13). Santin et al. (Reference Santin, Maiorka and Macari11) reported that broilers receiving feed containing 0·2 % YCW showed higher DWG and better FCR. Zhang et al. (Reference Zhang, Lee and Lee12) reported that 0·3 % YCW-fed birds had higher DWG and lower FCR. Morales-Lopez et al. (Reference Morales-Lopez, Auclair and Van Immerseel13) reported that 500 mg/kg of yeast extract-YCW increased body weight and DFI (42 d) on a wheat-based diet, whereas 500 mg/kg of yeast extract-YCW and 500 mg/kg of brewery-YCW treatments both improved feed efficiency with respect to the negative control group (1–14 d) on a maize-based diet. Increased villus height(Reference Santin, Maiorka and Macari11–Reference Morales-Lopez, Auclair and Van Immerseel13), mucosa thickness(Reference Santin, Maiorka and Macari11–Reference Morales-Lopez, Auclair and Van Immerseel13) and number of goblet cells(Reference Morales-Lopez, Auclair and Van Immerseel13) were observed in YCW-fed broilers of these experiments, suggesting that supplementation of YCW to broiler chicken diets increased animal performance by favouring intestinal mucosa development. However, DFI and FCR were not affected by YCW supplementation compared with the control birds in the present study. The variable results of these studies could be due to a variety of reasons such as differences in the source and preparation of the YCW or the presence and type of challenge utilised, which may influence the responses observed. In addition, YCW+CSA birds had significantly increased DWG and decreased FCR at different periods and cumulatively compared with CSA birds, which suggests that YCW attenuated the growth-suppressive effects of the CSA treatment. Considering that CSA challenge significantly decreased the performance of broiler chickens via suppressing the immune system; therefore, it is possible that 0·3 % YCW supplementation attenuated the growth-suppressive effects of the CSA challenge by enhancing the immune function of the birds.
The mitogen-induced blastogenic response assay of peripheral blood lymphocytes has been widely used to assess non-specific cellular immunity(Reference Kondo, Sugiura and Kamada28, Reference Heckert, Estevez and Russek-Cohen33). In the present study, dietary supplementation of 0·3 % YCW enhanced lymphocyte proliferation compared with the control birds and mitigated the decrease of lymphocyte proliferation caused by CSA challenge. The present findings are consistent with the results of Gomez-Verduzco et al. (Reference Gomez-Verduzco, Cortes-Cuevas and Lopez-Coello34) who reported that dietary supplementation of 0·05 % of YCW increased humoral and cell-mediated immune responses. Verduzco et al. (Reference Verduzco, Cuevas and Coello35) also reported that addition of YCW increased cellular immune response as documented by the basophilic cutaneous hypersensitivity test. This may result from the chemical structure of YCW, which consists mainly of sugars that function as a lectin-type receptor ligand(Reference Verduzco, Cuevas and Coello35).
Lymphoid organ weights are easily measured and reflect the body's ability to provide lymphoid cells during an immune response. Classically, immunosuppressed birds have smaller lymphoid organs(Reference Pope36). In the present study, 0·3 % YCW supplementation increased the RW of the bursa of Fabricius and thymus on day 42 compared with the control birds, whereas YCW+CSA birds had significantly heavier RW of both these two organs compared with the CSA birds. In agreement with the present findings, Morales-Lopez et al. (Reference Morales-Lopez, Auclair and Garcia8) observed a tendency of heavier RW of lymphoid organs in broilers fed 500 mg/kg of YCW. Guo et al. (Reference Guo, Ali and Qureshi17) and Zhang et al. (Reference Zhang, Guo and Wang19) observed an increase in the spleen, bursa of Fabricius and thymus RW of broilers fed diets supplemented with 40 or 50 mg β-glucan/kg of feed. Corrier et al. (Reference Corrier, Elissalde and Ziprin24) also found that chicks subcutaneously injected with CSA at a dosage of 50 mg/kg body weight twice daily for the first 4 d after hatching had a significantly decreased bursa of Fabricius RW compared with the control group at 10 d of age, and spleen RW was not affected by the CSA treatment. According to Ferket et al. (Reference Ferket, Parks and Grimes37), the YCW components might stimulate the gut-associated immune system by acting as a non-pathogenic microbial antigen, giving an adjuvant-like effect. Studies in mammals have described the importance of digestive microbial antigen stimulation on the development of lymphoid organ tissue(Reference Pabst, Geist and Rothkotter38, Reference Rothkotter, Ulbrich and Pabst39). Therefore, it is possible that YCW supplementation improved the RW of lymphoid organs and attenuated the suppressive effects of the CSA challenge by stimulating the gut-associated immune system.
Histological analysis of broiler chickens' immune organs showed significant differences in the structure of spleen in different groups. Considering the role of the spleen in immunogenesis, special attention was paid to the structure of the splenic cords and PALS during histological examination. In the present study, there was an increase in the number of lymphocytes in the splenic cords and better-developed PALS in the spleen of YCW-fed birds compared with control birds, whereas similar results were observed in the spleen of YCW+CSA-treated birds compared with CSA-treated birds, suggesting that YCW can exert beneficial effects on the spleen of not only healthy but also CSA-treated, immunosuppressed broiler chickens. The present findings are consistent with the results of Nowak et al. (Reference Nowak, Kai and Peck26) who reported that the major histological changes of chicks receiving a CSA dose of 50 mg/kg by intramuscular administration of the drug in a neutral oil every 3 d were in the spleen where there was a depletion of the PALS, a marked increase in granulated cells, a decrease in germinal centres and the appearance of large numbers of Mott cells.
In chickens, the spleen acts both as a reservoir and activation site for leucocytes, therefore splenic gene expression reflects systemic immune function(Reference Redmond, Tell and Coble40). To future explore the effect of YCW on modulating immune function in immunosuppressed broiler chickens, the splenic expression of IL-1β and IL-6 was measured in the present study. IL-1β and IL-6 are pro-inflammatory cytokines that are primarily produced by activated phagocytes, especially macrophages, as well as endothelial cells(Reference Van Snick41, Reference Dinarello42). They are particularly important in initiating an acute-phase immune response, recruiting and activating leucocytes and setting the stage for appropriate action in response to microbes, tissue injury and other components that signal danger(Reference Van Snick41–Reference Wigley and Kaiser44). Hence, it is not surprising that the expression of these cytokines was significantly down-regulated in the spleen of CSA-treated birds, as it has been reported that CSA prevents the synthesis of cytokines by T-cells by blocking a late-stage signalling pathway initiated by the T-cell receptor, which affects the production of IL-2 at the transcript level(Reference Hill, Rowland and Latimer45–Reference Resch and Szamel48). We found that IL-1β and IL-6 expressions were significantly enhanced in the spleen of YCW-fed birds, suggesting that YCW might act as an immunoprotective agent by up-regulating the inflammatory response leading to enhanced protection against pathogens. Furthermore, YCW+CSA significantly up-regulated the splenic expression of IL-1β and IL-6 compared with the CSA-treated birds, indicating that YCW are still effective in up-regulating the inflammatory response in CSA-treated, immunosuppressed birds. These findings suggest that YCW may enhance the cell-mediated immune response in broiler chickens by modulating the production of cytokines.
In conclusion, these data suggest that dietary supplementation of YCW exerts beneficial effects in attenuating the immunosuppressive effects of CSA challenge, therefore improving the growth performance of broiler chickens.
Acknowledgements
The authors have declared that no conflict of interest exists. The present study was supported by grants from the National Natural Science Foundation of China (no. 31072036 and 30700580) and the Huazhong Agricultural University Scientific & Technological Self-innovation Foundation (no. 2010PY011). X. Y., L. M. and B. L. designed the research; S. Z. and B. L. performed the research; S. Z., X. L., L. L. and X. Y. analysed the data; S. Z., X. L. and X. Y. wrote the manuscript.


