


In the USA, poor diet was the first leading cause of premature death, which accounted for 529 299 deaths with 83·9 % of these deaths from CVD, and the remainder due to a combination of cancer and diabetes, and to other diseases in 2016(Reference Mokdad and Ballestros1). Hyperinsulinaemia and insulin resistance have long been suggested to be associated with higher risk of overall and cause-specific mortality(Reference Lakka, Lakka and Tuomilehto2,Reference Pyorala, Miettinen and Laakso3,Reference Nilsson, Nilsson and Hedblad4,Reference Wargny, Balkau and Lange5) , while diet can modulate insulin response(Reference Yki-Jarvinen6,Reference Kerr, Anderson and Lippman7) . Therefore, we hypothesised that diet with higher insulinaemic potential might be associated with increased risk of death.
Recently, two empirically dietary indices for hyperinsulinaemia (EDIH) and insulin resistance (EDIR) were constructed to identify food groups most predictive of C-peptide concentration (an indicator for hyperinsulinaemia) and the TAG/HDL-cholesterol ratio (an indicator for insulin resistance), respectively(Reference Tabung, Wang and Fung8). These two patterns are a posteriori dietary patterns (i.e. its development is data-driven) to assess the insulinaemic potential of habitual diet and have been suggested to be associated with multiple health outcomes including several site-specific cancers(Reference Tabung, Wang and Fung9,Reference Wang, Fung and Wang10,Reference Yang, Sui and Zhao11) , type 2 diabetes(Reference Aroke, Folefac and Shi12), weight gain(Reference Tabung, Satija and Fung13) and survival among patients with colorectal cancer(Reference Tabung, Noonan and Lee14,Reference Cheng, Zhang and Ou15) . To date, however, there has been no epidemiological studies investigating the association of EDIH or EDIR with mortality risk. In addition, the EDIH and EDIR indices were derived based on a subset of US health professionals, which consist largely of well-educated non-Hispanic whites. Also, the TAG/HDL-cholesterol ratio may not well predict insulin resistance in some populations including African Americans(Reference Zhou, Zhu and Cui16,Reference Sumner, Finley and Genovese17) .
Herein, we re-derived and validated EDIH and EDIR indices in a large nationally representative sample from the US National Health and Nutrition Examination Survey (NHANES). To create EDIR index, we used homoeostatic model assessment for insulin resistance (HOMA-IR), which is referred to as the ‘alloyed gold standard’ to measure insulin resistance and β-cell function. We then prospectively investigated the association between adherence to EDIH and EDIR and risk of overall and cause-specific mortality among US adults.
Methods
Study population
Participants in our study were selected from the NHANES longitudinal study. The NHANES is a continuous, cross-sectional survey conducted by the Centers for Disease Control and Prevention and the National Centers for Health Statistics since 1999. The survey aimed to monitor the health of a representative sample of about 5000 persons in the USA every year. The NHANES interview includes demographic, socio-economic, dietary and health-related questions. Details on NHANES study design, study protocol and data collection methods have been described elsewhere(18). Participants included in the study aged 18 years or older who at least completed one 24-h dietary interview from 1999 to 2014. We excluded individuals with implausible energy intake (< 2510 or > 14 644 kJ/d for women and < 3347 or > 17 573 kJ/d for men) or without linked mortality data. A total of 40 074 participants (20 984 women and 19 090 men) were included in the final analysis (online Supplementary Fig. S1). The National Centers for Health Statistics approved the NHANES study protocol, and the written informed consent was obtained from all participants. This study was conducted according to the guidelines laid down in the Declaration of Helsinki.
Assessments of diet, biomarkers of insulin response and dietary pattern indices
Dietary factors were assessed by 24-h recalls. From 1999 to 2002, one 24-h dietary recall was performed in-person in the NHANES Mobile Examination Center. After 2003, diet was assessed by two 24-h dietary recalls, with the second 24-h dietary interview of participants being conducted by telephone 3–10 d after the first recall, to obtain a more complete picture of the usual dietary habits. Laboratory methods of measuring fasting concentrations of insulin, glucose and C-peptide were reported in detail elsewhere(18,19) . HOMA-IR was calculated using the following formula: fasting insulin (uU/ml) ×fasting plasma glucose (mmol/l)/22·5. Considering departures from the normal distribution, all biomarkers of insulin response levels were natural logarithm (ln) transformed.
The flow chart of how we developed and validated the EDIH and EDIR indices was shown in online Supplementary Figs S2 and S3. Because data collection for the NHANES 2019–2020 cycle has not been completed, we used five cycles of NHANES data (i.e. 1999–2000 to 2007–2008 cycle) as training set and data from 2009–2010 to 2017–2018 cycles as validation set. Consistent with previous studies(Reference Tabung, Wang and Fung8,Reference Tabung, Smith-Warner and Chavarro20,Reference Zhu, Peng and Lu21) , we selected thirty-nine foods or food groups (see online Supplementary Table S1) to construct dietary indices(Reference Zhu, Peng and Lu21). The grouping scheme was based on the similarity of nutrient profiles or culinary usage among the foods and was similar to or the same with that used in other studies(Reference Tabung, Wang and Fung8,Reference Tabung, Smith-Warner and Chavarro20,Reference Zhu, Peng and Lu21,Reference Slattery, Boucher and Caan22) . Daily intake levels of % energy from these foods were 68·3 % and were generally stable during the study periods (i.e. 1999–2014) in NHANES (online Supplementary Fig. S4).
For EDIH, we entered the daily intake levels of thirty-nine food groups into reduced rank regression (RRR) to derive dietary pattern predictive of two hyperinsulinaemic biomarkers: fasting insulin and C-peptide (online Supplementary Fig. S2). Because fasting insulin and C-peptide were simultaneously measured from 1999–2000 to 2003–2004 cycles, we used two cycles (i.e. 1999–2000 cycle and 2001–2002 cycle) of NHANES data as the training set and data from 2003–2004 cycle as validation set. RRR can identify linear functions of predictors (i.e. food groups) that simultaneously explain as much response variation of hyperinsulinaemic biomarkers as possible. The first factor (i.e. the RRR dietary pattern) identified by RRR then underwent further data reduction by stepwise linear regression to identify the most important component food groups of the RRR dietary pattern, with the RRR dietary pattern as the dependent variable, the thirty-nine food groups as independent variables and a significance level of P = 0·05 for entry into and retention in the model. For EDIR, we used stepwise linear regression to identify the most important component food groups contributing to insulin resistance (with HOMA-IR as the dependent variable), with the thirty-nine food groups as independent variables and a significance level of P = 0·05 for entry into and retention in the model (online Supplementary Fig. S3).
We determined the food intake components in the two indices (i.e. EDIH and EDIR) from the final stepwise linear regression models. These food groups were then weighted by their regression coefficients and summed to calculate the two indices. Higher scores (more positive) indicate higher insulinaemic potential, while lower scores (more negative) denote lower insulinaemic potential of diets.
Considering the influence of possible changes in long-term dietary habits, we also created two alternative versions of EDIH: one using data on 1999–2000 and 2003–2004 cycles, another using data from 2001–2002 to 2003–2004 cycle. Similarly, two alternative versions of EDIR were developed, one using data from five cycles of NHANES every other year (i.e. 1999–2000, 2003–2004, 2007–2008, 2011–2012 and 2015–2016 cycle) and another using data from the latest five cycles of NHANES (i.e. from 2009–2010 to 2017–2018 cycle, online Supplementary Table S2).
In the validation phase, we tested the ability of the dietary indices to predict the levels of markers of insulin response in the validation set and modelled age-adjusted and multivariable-adjusted (i.e. adjusted for age, sex, race/ethnicity, physical activity and smoking) linear regression to calculate geometric means of biomarkers of insulin response.
Assessments of covariates
Standardised questionnaires were administrated through household interview to collect demographic and lifestyle factors, including age, sex, race/ethnicity, educational level, income, smoking and physical activity. Alcohol intake, body weight and height were obtained from participants who received physical examinations in the NHANES Mobile Examination Center. BMI was calculated as weight in kg divided by the square of the height in metres (kg/m2). Economic status was measured as the ratio of family income to poverty. Physical activity was expressed in metabolic equivalent tasks-h/week. Histories of CVD, cancer and diabetes were defined if individuals reported that they had ever been told by a health care professional that they had such diseases and/or to take prescribed medications due to the diseases. Additionally, patients with diabetes were identified if they had a fasting plasma glucose level ≥126 mg/dl.
Ascertainments of deaths
Deaths and causes of death were identified via record linkage to the National Death Index through 31 December 2015. In this analysis, cause-specific mortality was defined using the 10th revision of the International Classification of Diseases. Deaths from major CVD include deaths from diseases of heart (International Classification of Diseases-10 codes I00–I09, I11, I13, I20–I51) and cerebrovascular diseases (I60–169). Death from cancer was defined as code C00–97. National Death Index has been proven to be a reliable and efficient utility for ascertainment of deaths in large epidemiological studies, over 98 % of deaths can be identified using this approach(Reference Stampfer, Willett and Speizer23,Reference Rich-Edwards, Corsano and Stampfer24) .
Statistical analysis
We calculated person-years from the date of interview to the date of death or the end of the follow-up (31 December 2015), whichever came first. We used the multivariable-adjusted Cox regression model to estimate the hazard ratios (HR) and 95 % CI of deaths associated with the two dietary pattern indices (i.e. EDIH and EDIR). Model 1 was adjusted for age, sex and total energy intake. Model 2 was further adjusted for race/ethnicity, education, marital status, ratio of family income to poverty, physical activity and smoking. Details of categorisations of adjusted covariates are described in online Supplementary Table S3. For covariates with missing values, a separate missing indicator variable was created and included in the multivariate Cox models. We presented HR by quintile categories and per 1-sd increase of EDIH and EDIR, and linear trend test was performed by assigning medians to each quintile as a continuous variable in the models. We used restricted cubic splines to test the potential non-linear relationship between EDIH and EDIR scores and the risk of mortality.
Given that BMI and diabetes are possible intermediates in the association between the two dietary pattern indices and death risk, we did not adjust for BMI and diabetes in the main analyses but additionally adjusted for these two covariates in a sensitivity analysis. Accounting for the influence of potential bias from reverse causality, we conducted a sensitivity analysis by excluding participants with follow-up time less than 3 years. We also additionally adjusted for the primary sampling unit, considering that the participants were from many states or areas in the USA.
Subgroup analysis and the potential for effect modification were tested for the associations between the two dietary pattern indices and death risk by age, sex, race/ethnicity, education level, ratio of family income to poverty, smoking status, physical activity, BMI, diabetes and marital status. We used Wald test to examine whether the cross-product terms between these variables and exposures were statistically significant. All statistical tests were two-sided and performed using SAS version 9.4 (SAS Institute Inc.). Because of many tests being conducted, we used the Bonferroni correction to define the statistical significance as P < 0·008 (0·05/2 exposures × 3 outcomes) for main analysis, and P < 0·00125 (0·05/2 exposures × 20 subgroups) for subgroup analysis, allowing for multiple comparisons.
Results
Development of empirical dietary index for hyperinsulinaemia and empirical dietary index for insulin resistance
For EDIH index, a total of 4386 participants were included in the training set and 2199 in the validation set. Thirteen food groups were included in EDIH, nine of them (i.e. beer, wine, coffee, snacks, fruit juice, nuts, sweets desserts, oil and vinegar salad dressing, and mayonnaise and other creamy salad dressings) were inversely, while four of them (i.e. processed meat, potatoes, low energy carbonated drinks and eggs) were positively associated with both fasting insulin and C-peptide concentrations. For EDIR index, we included 11 271 and 11 633 participants in the training set and the validation set, respectively. The EDIR had eighteen food components: six (i.e. processed meat, red meat, potatoes, low energy carbonated drinks, margarine and eggs) were positively, whereas twelve (i.e. dark yellow vegetables, leafy green vegetables, beer, wine, liquor, coffee, oil and vinegar salad dressing, pizza, sweets desserts, snacks, condiments and fruit juice) were inversely associated with HOMA-IR levels. Two alternative versions of EDIH and EDIR were developed. By comparisons, the main version and the two alternative versions shared six food components for EDIH, and the three versions of EDIR shared eight food components (online Supplementary Table S3).
Validation of empirical dietary index for hyperinsulinaemia and empirical dietary index for insulin resistance
Generally, both EDIH and EDIR indices showed high ability to predict concentrations of biomarkers for insulin response in the validation set (Table 1). In multivariable-adjusted models, the EDIH was significantly associated with concentrations of the two biomarkers (fasting insulin and C-peptide), with a statistically significant linear trend for each biomarker across quintiles of the EDIH (all P-trend was no more than 0·002). Similarly, high EDIR scores were linearly associated with increased levels of HOMA-IR in the validation set (P-trend < 0·001). Consistent with the original dietary indices(Reference Tabung, Wang and Fung8), our EDIH index showed a weak positive correlation with plasma levels of insulin and C-peptide (both are 0·09, P < 0·001). Likewise, the Spearman correlation coefficient between EDIR and HOMA-IR was 0·14 (P < 0·001) in the validation set. Similar to those in the main version of EDIH and EDIR, the two alternative versions also showed a high ability to predict levels of plasma markers for insulin response in the validation set (data not shown).
Table 1. Geometric means (and 95 % CI) of plasma biomarkers for insulin response according to quintiles of EDIH and EDIR scores in validation set in NHANES
(Mean values and 95 % confidence intervals)

EDIH, empirical dietary index for hyperinsulinaemia; EDIR, empirical dietary index for insulin resistance; HOMA-IR, homoeostasis model assessment for insulin resistance; IQR, interquartile range; NHANES, National Health and Nutrition Examination Survey.
* Adjusted for age.
† Adjusted for covariates included in age, race/ethnicity, physical activity and smoking.
‡ Linear trend test was conducted by assigning medians to each quintile as continuous variable in the models.
Baseline characteristics of participants
After a median follow-up of 7·8 years among 40 074 participants who aged 18–85 years (mean, 47·3 years (sd 19·4) years), we documented 4904 deaths including 1029 CVD-specific deaths and 1068 cancer-specific deaths. EDIH and EDIR scores ranged from a median of −0·22 (interquartile range: −0·32 to −0·15) and 0·76 (interquartile range: 0·69–0·80) in lowest quintile to 0·21 (interquartile range: 0·17–0·29) and 1·02 (interquartile range: 0·99–1·07) in the highest quintile, respectively. Compared to participants with lower EDIH or EDIR scores, those in the highest quintile were less educated, had higher BMI, had lower ratio of family income to poverty, were less physical active and were more likely to have a history of diabetes (Table 2).
Table 2. Age-adjusted characteristics of participants according to EDIH and EDIR scores in NHANES (1999–2014)*
(Mean values and standard deviations; percentages)
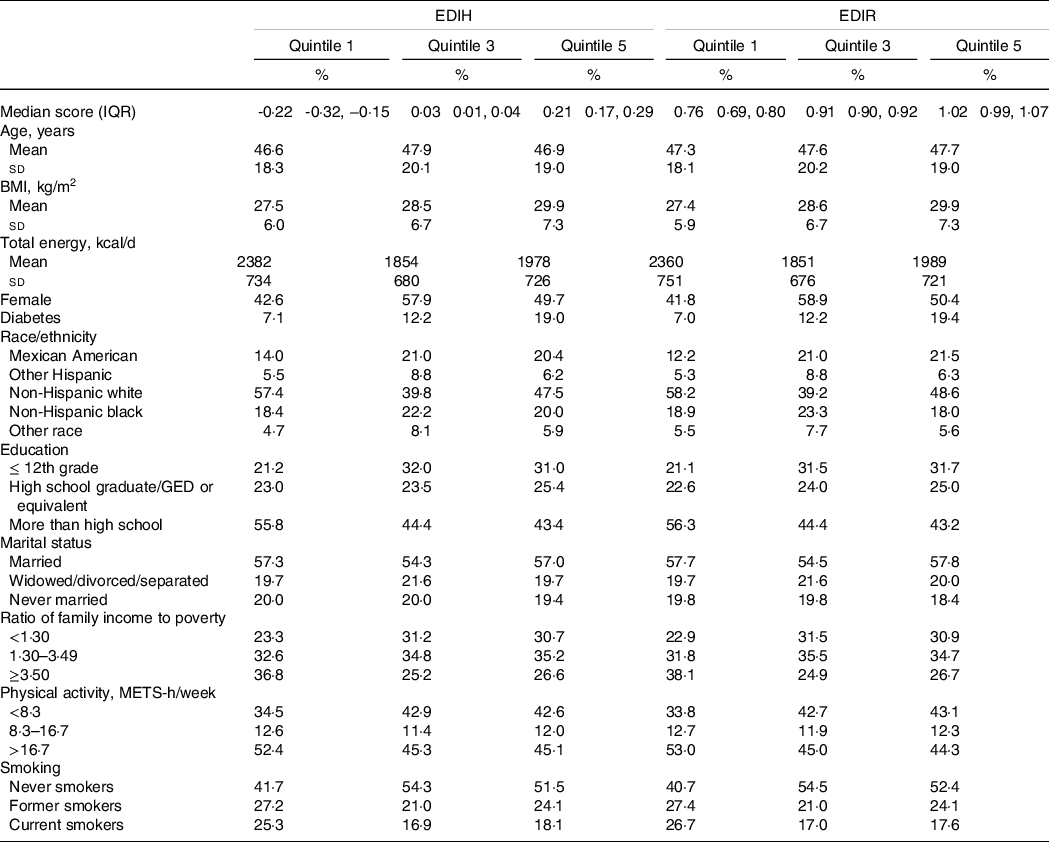
EDIH, empirical dietary index for hyperinsulinaemia; EDIR, empirical dietary index for insulin resistance; IQR, interquartile range; GED, general educational development; METS, metabolic equivalent tasks; NHANES, National Health and Nutrition Examination Survey.
* Values were adjusted for age except for age, EDIH score and EDIR score. Continuous variables were expressed as mean values and standard deviations if normally distributed. Categorical variables were expressed as percentages.
Association between dietary insulinaemic potential and risk of mortality
The multivariable-adjusted HR for participants in the highest quintile of EDIH, as compared with those in the lowest quintile, were 1·20 (95 % CI 1·09, 1·32, P-trend < 0·001) for overall mortality and 1·41 (95 % CI 1·15, 1·74, P-trend = 0·002) for CVD mortality (Table 3). These positive associations were not appreciably changed after exclusion of participants with follow-up years less than 3 (data not shown). These positive associations were attenuated but remained statistically significant with further adjustments for BMI and diabetes with HR of 1·12 (95 % CI 1·02, 1·23) and 1·27 (95 % CI 1·02, 1·57) for risk of total death and death from CVD, respectively (online Supplementary Table S4). These findings supported that obesity and diabetes could be potential intermediates in the association between dietary insulinaemic potential and risk of mortality. We found a null association between adherence to EDIH and risk of cancer mortality (HR = 1·05, 95 % CI 0·86, 1·29, P-trend = 0·505).
Table 3. Hazard ratios (95 % CI) for all-cause and cause-specific mortality by quintiles of EDIH and EDIR scores in NHANES (1999–2014)
(Hazard ratios and 95 % confidence intervals)
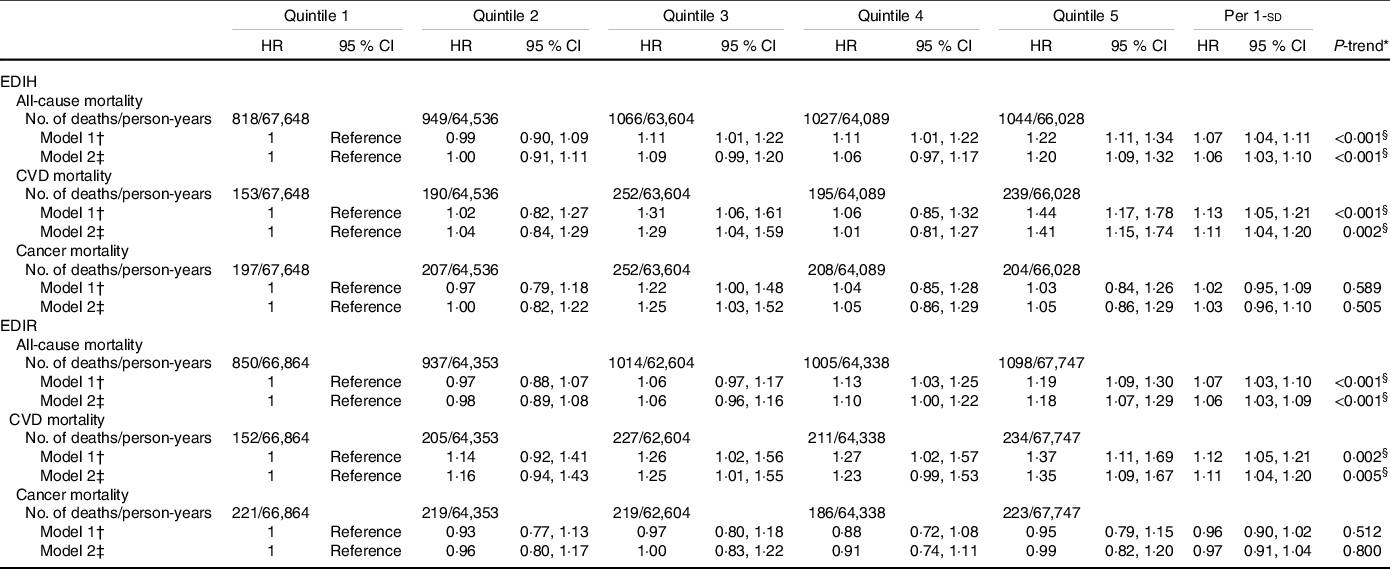
EDIH, empirical dietary index for hyperinsulinaemia; EDIR, empirical dietary index for insulin resistance; NHANES, National Health and Nutrition Examination Survey.
* Linear trend test was conducted by assigning medians to each quintile as continuous variable in the models.
† Adjusted for sex, age and total energy intake.
‡ Adjusted for covariates included in model 1 plus race/ethnicity, education, marital status, ratio of family income to poverty, physical activity and smoking.
§ P values were lower than Bonferroni-corrected significance level of 0.008.
Similarly, higher EDIR scores were associated with an increased risk of total (comparing extreme quintiles: HR = 1·18, 95 % CI 1·07, 1·29, P-trend < 0·001) and CVD (HR = 1·35, 95 % CI 1·09, 1·67, P-trend = 0·005) mortality, but not with the risk of cancer mortality (HR = 0·99, 95 % CI 0·82, 1·20, P-trend = 0·8). When we additionally adjusted for BMI and diabetes, the magnitude of the positive associations was attenuated (HR = 1·19, 95 % CI 0·97, 1·48 for total death; HR = 1·09, 95 % CI 0·99, 1·19 for death from CVD). Upon further adjustment for the primary sampling unit, the results were not essentially changed (online Supplementary Table S4). Restricted multivariable cubic spline analyses showed significantly linear associations between EDIH (Fig. 1) and EDIR (Fig. 2) index scores and risk of overall and CVD mortality.
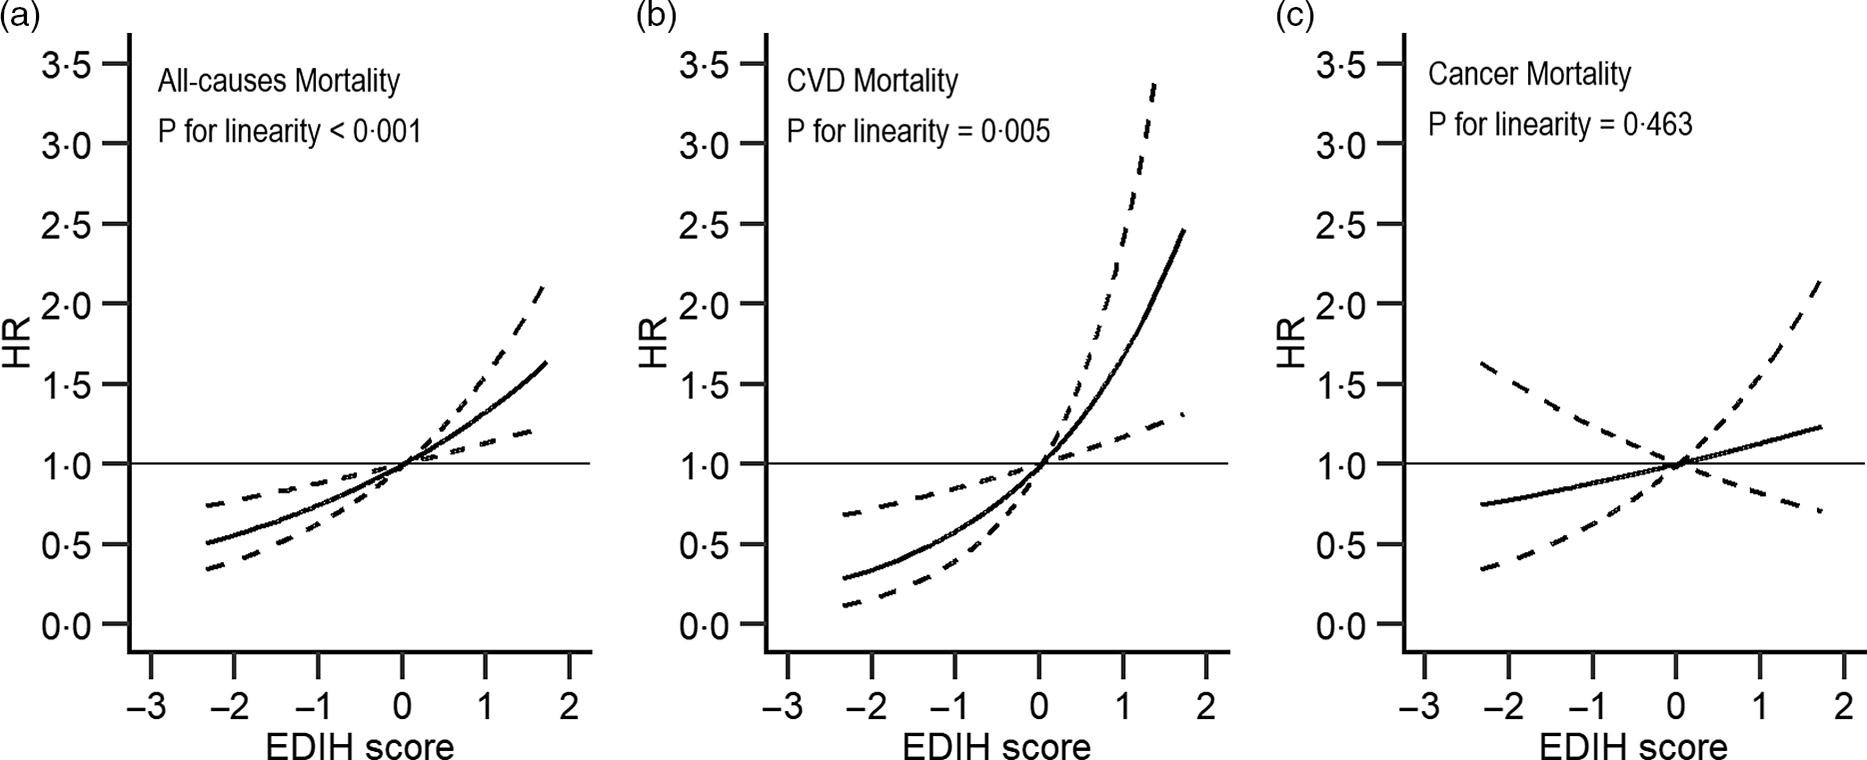
Fig. 1. Association between empirical dietary index for hyperinsulinaemia and all-cause (a), major CVD-specific (b) and cancer-specific (c) mortality in NHANES (1999–2014)*. EDIH, empirical dietary index for hyperinsulinaemia; HR, hazard ratio. *Adjusted for sex, age, total energy intake, race/ethnicity, education, marital status, ratio of family income to poverty, physical activity and smoking. Reference levels were set to the median value of EDIH. Solid lines indicate HR, and dashed lines depict 95 % CI.
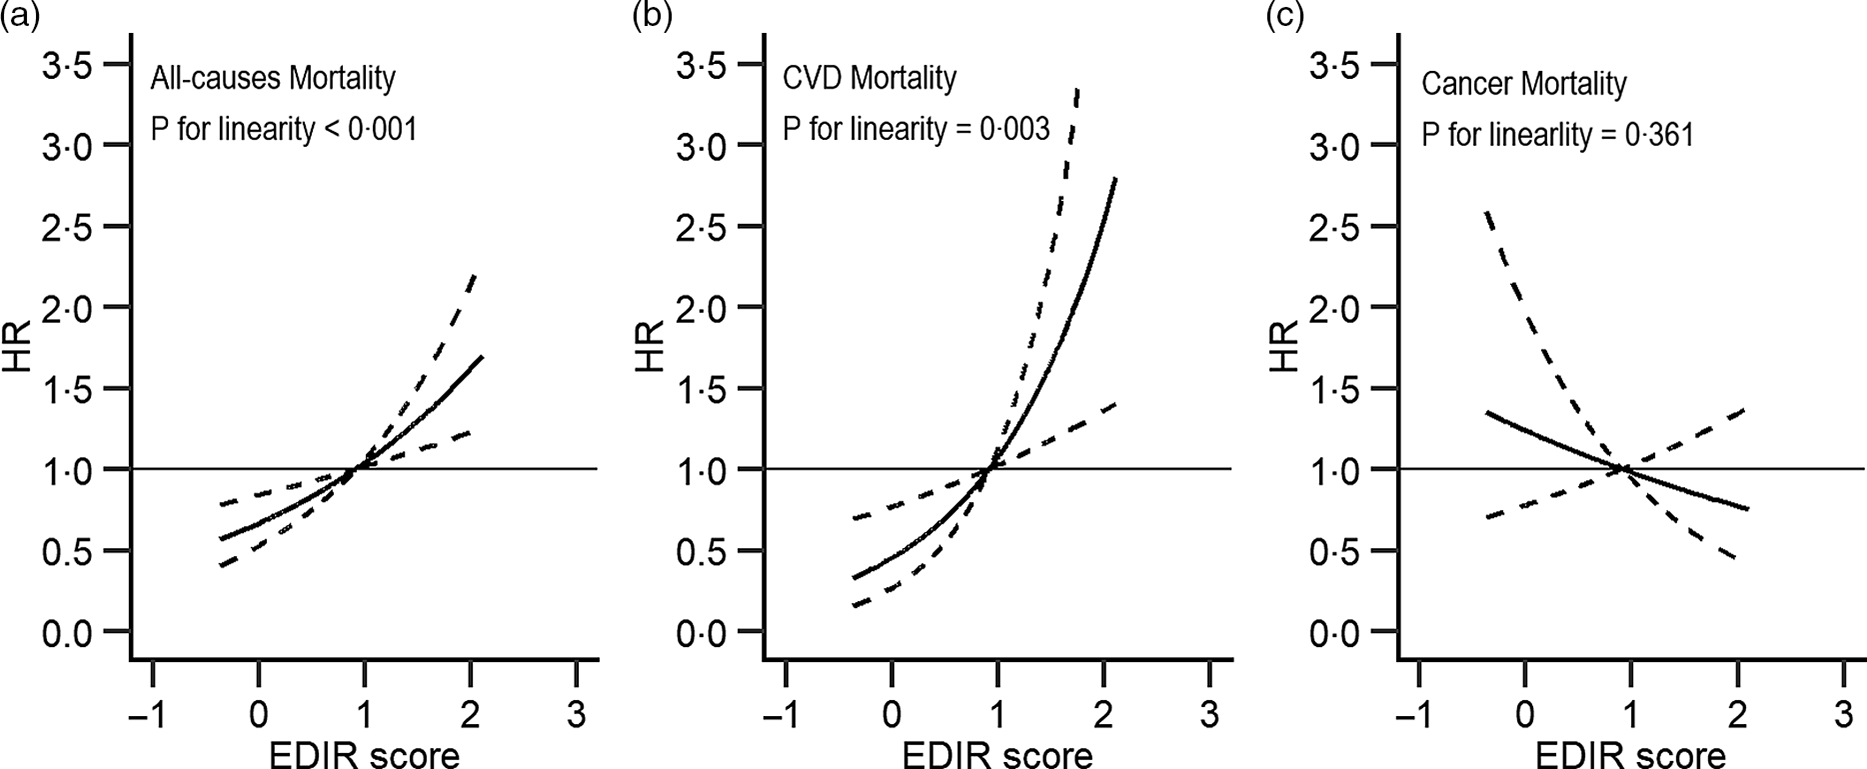
Fig. 2. Association between empirical dietary index for insulin resistance and all-cause (a), major CVD-specific (b) and cancer-specific (c) mortality in NHANES (1999–2014)*. EDIR, empirical dietary index for insulin resistance; HR, hazard ratio. *Adjusted for sex, age, total energy intake, race/ethnicity, education, marital status, ratio of family income to poverty, physical activity and smoking. Reference levels were set to the median value of EDIR. Solid lines indicate HR, and dashed lines depict 95 % CI.
For each food component included in the dietary indices, only coffee and liquor were weakly (i.e. coffee was inversely and liquor was positively) associated with death risk, while a null or a non-significant association was observed for other foods (online Supplementary Table S5).
In subgroup analysis, we did not find differential associations across population subsets by age, sex, race/ethnicity, education level, ratio of family income to poverty, smoking status, physical activity, BMI, diabetes and marital status (Fig. 3).
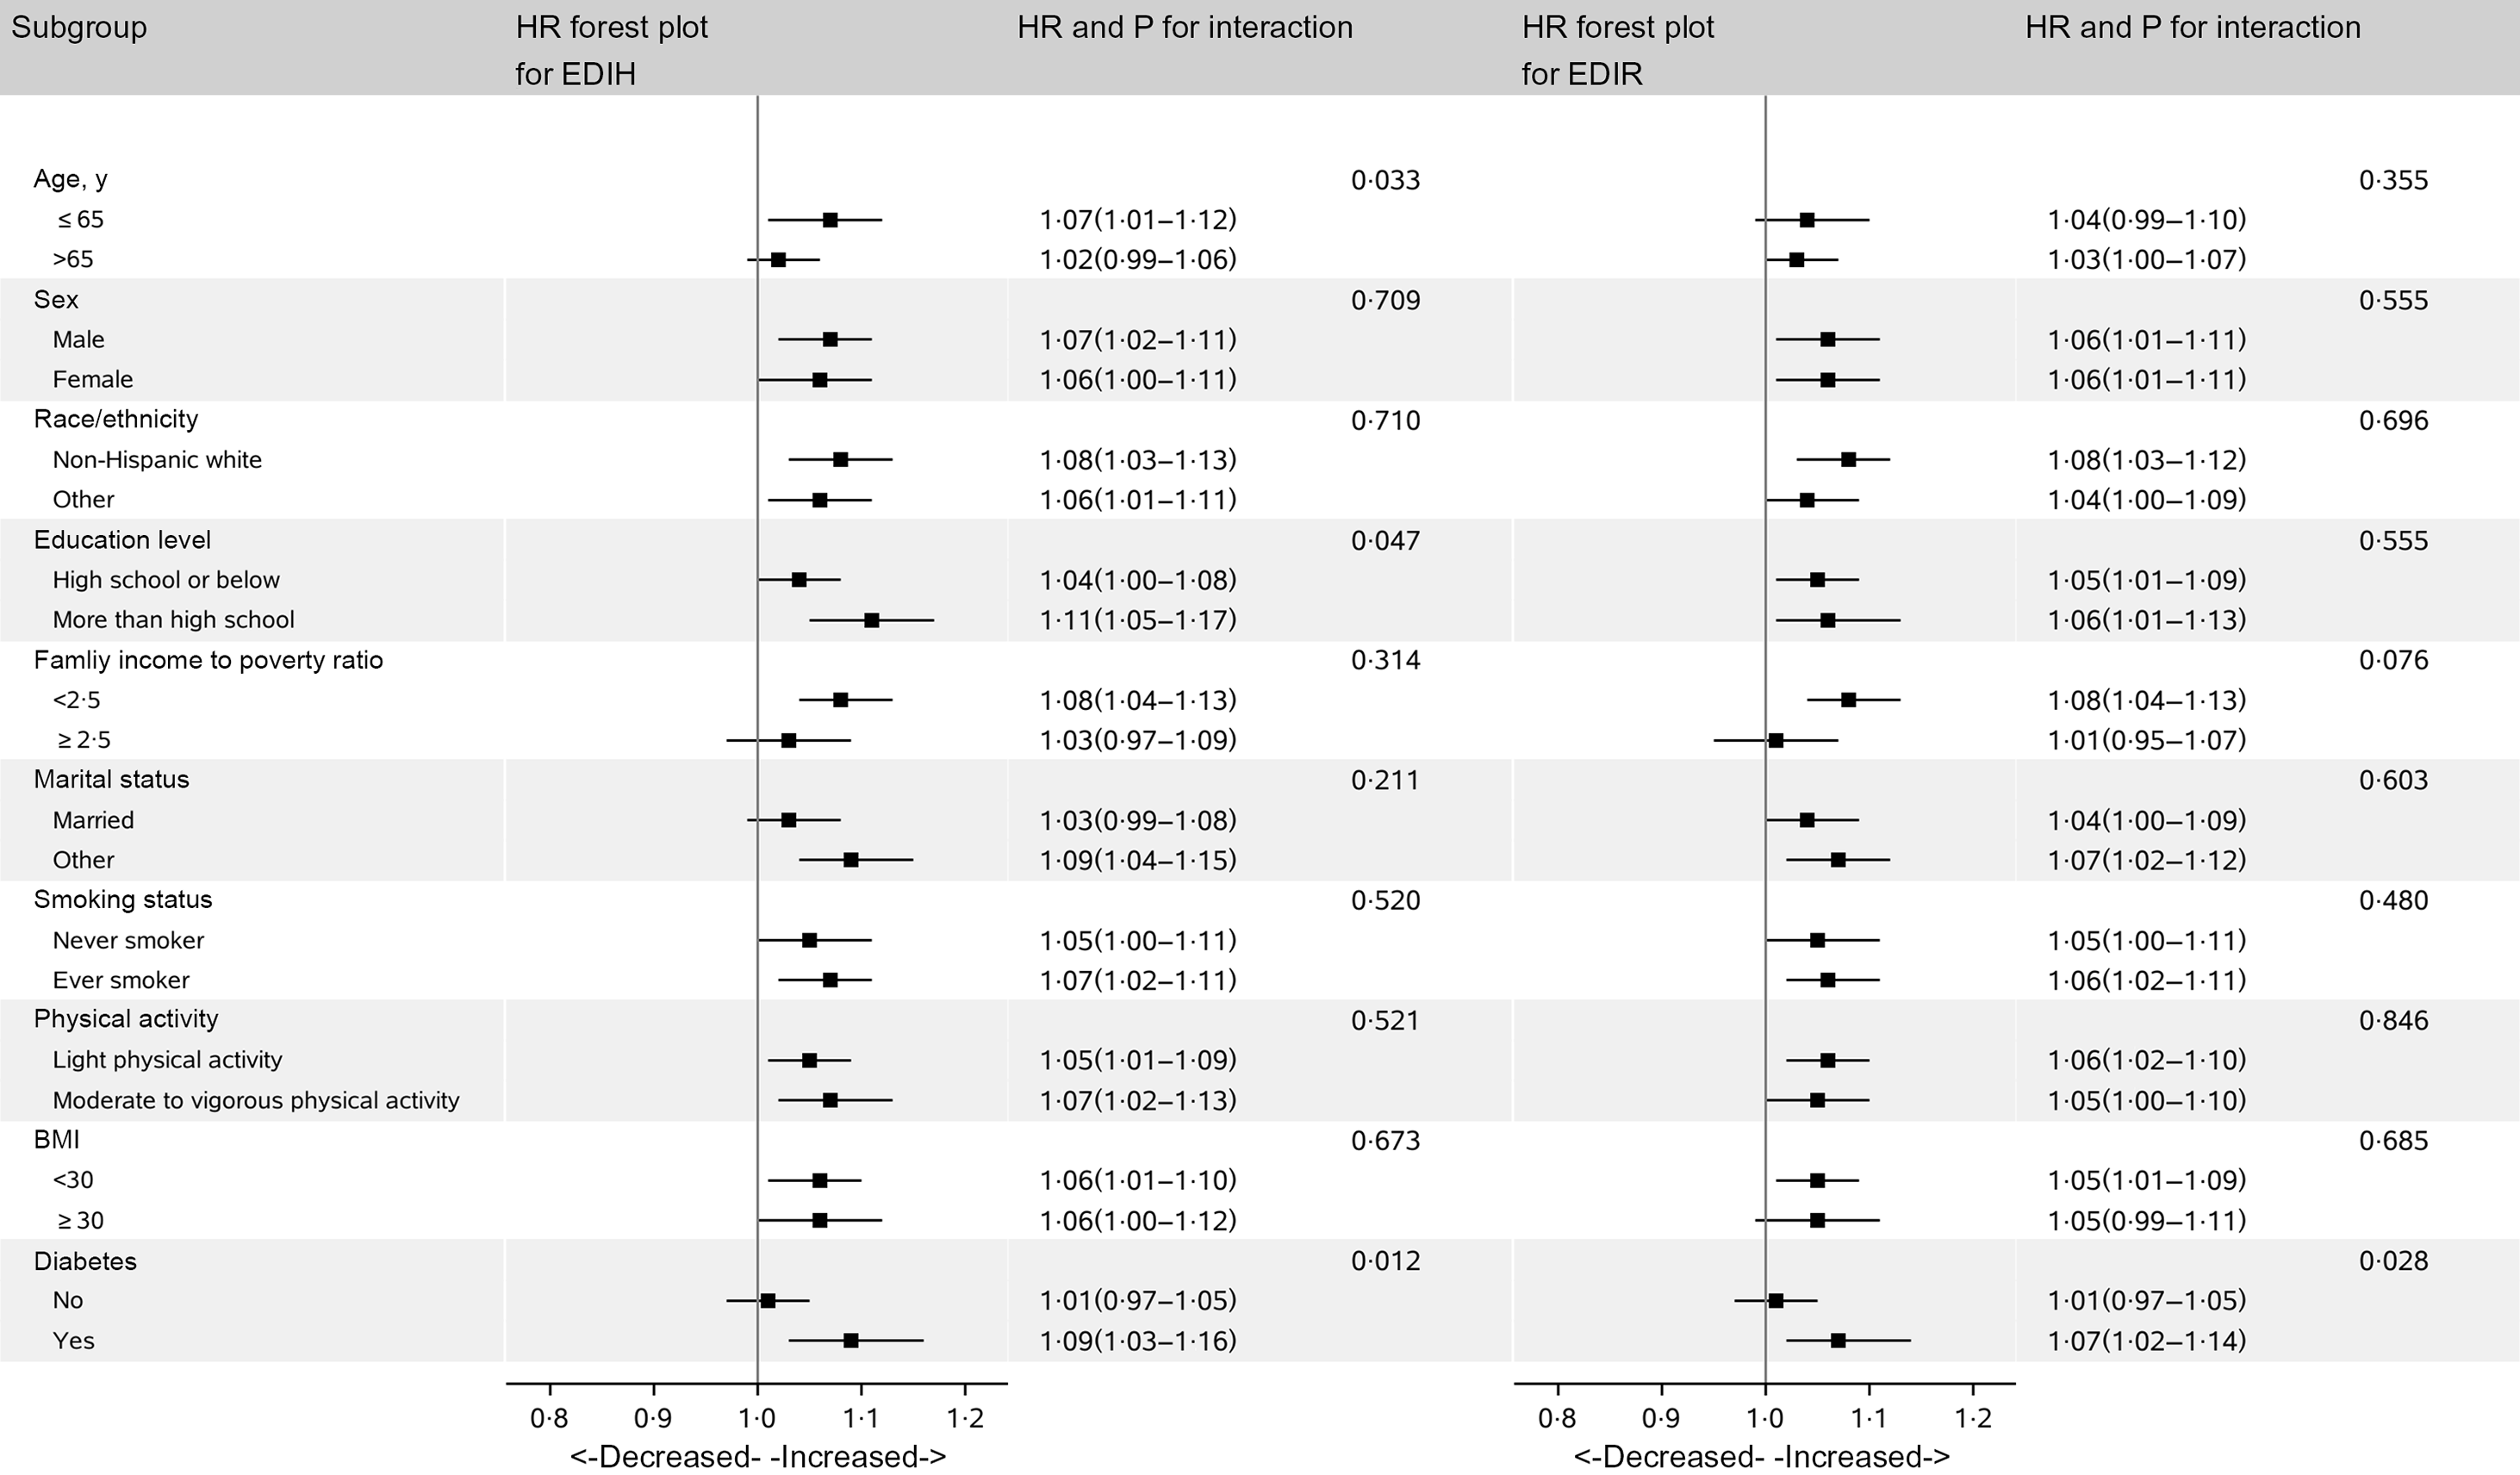
Fig. 3. Hazard ratios (HR) of all-cause mortality per 1-sd increase in EDIH and EDIR according to subgroups in NHANES (1999–2014)*. EDIH, empirical dietary index for hyperinsulinaemia; EDIR, empirical dietary index for insulin resistance; HR, hazard ratio; METS, metabolic equivalent tasks; NHANES, National Health and Nutrition Examination Survey. *Covariates adjusted in the models were the same as those in model 2 in Table 3 (see Table 3 footnote). Of note, variables examined in this figure were not adjusted. Light physical activity was defined as participants with physical activity less than 8·3 METS-h/week, and moderate and vigorous activity was defined as participants who had physical activity of 8·3 METS-h/week or more.
Discussion
In this large nationally representative cohort study, we found that persons who consumed diet with higher insulinaemic potential, as reflected in greater EDIH or EDIR score, had increased risk of overall and CVD-specific mortality among US adults. These positive associations were slightly attenuated with statistical significance or borderline statistical significance after additionally adjusting for BMI and diabetes. Therefore, nutritional modifications aimed at reducing the insulin concentrations or improving insulin resistance may potentially promote health and longevity.
Diets are complex combinations of nutrients and other compounds that act synergistically within individual foods and across food combinations(Reference Tapsell, Neale and Satija25). Therefore, compared with the evaluation of the effects of a single food or nutrient, assessing the association of dietary pattern with health outcomes may capture dietary effects on health more completely. This may partly explain why we observed moderate associations of EDIH and EDIR with mortality risk, but a weak or non-significant or null association for each food component in the dietary indices.
EDIH and EDIR are empirically hypothesis-oriented food-based dietary pattern indices to evaluate the insulinaemic potential of the whole diet(Reference Tabung, Wang and Fung8). By comparison, the current version and their original version(Reference Tabung, Wang and Fung8) of EDIH and EDIR indices shared many food intake components (six for EDIH index and eight for EDIR index), and both showed high ability to predict concentrations of insulinaemic biomarkers in their validation sets. Of note, dietary hyperinsulinaemia index and dietary insulin resistance index have been developed using data from NHANES to assess insulinaemic potential and were showed to be predictors for all, CVD- and cancer-specific mortality(Reference Mazidi, Katsiki and Mikhailidis26). However, these two indices were based exclusively on nutrients; thus, findings from the dietary hyperinsulinaemia index and dietary insulin resistance index study(Reference Mazidi, Katsiki and Mikhailidis26) are difficult to be translated readily into public health interventions. Another limitation for the development of dietary insulin resistance index is the use of TAG/HDL-cholesterol ratio to measure insulin resistance(Reference Zhou, Zhu and Cui16,Reference Sumner, Finley and Genovese17) .
Our study showed that diet with higher insulinaemic potential was rich in processed meat, red meat, potatoes and carbonated drinks, and low in coffee, wine, dark yellow vegetables and leafy green vegetables. These observations were in line with the inverse associations for fruits, leafy green vegetables and coffee, and the positive associations for sugar with hyperinsulinaemia from previous studies(Reference Wu, Willett and Hankinson27,Reference Wu, Giovannucci and Pischon28) . Insulin resistance and the compensated hyperinsulinaemia may partly affect health and longevity through the insulin receptors or increasing insulin-like growth factor 1 (IGF-1) and decreasing its binding proteins(Reference van den Beld, Carlson and Doyle29). Also, the direct mitogenic effect of insulin and the central role of hyperinsulinaemia in metabolic disorders (a predictor for overall death) could partly explain the association between hyperinsulinaemia and risk of total and cause-specific mortality.
Although the interaction between age and dietary indices did not reach statistical significance, our findings of stronger positive association between EDIH and risk of mortality among participants under 65 years of age further support the potential role of IGF-1, a surrogate measure of growth hormone/IGF-1 system activity. Experimental studies(Reference Holzenberger, Dupont and Ducos30,Reference Broughton, Piper and Ikeya31) showed that diminishing growth hormone and/or IGF-1 secretion or signalling extends lifespan and healthspan. In addition, several but not all epidemiological studies suggested that high circulating level of IGF-1 was associated with increased risk of overall and/or CVD mortality(Reference Schutte, Conti and Mels32,Reference Bourron, Le Bouc and Berard33,Reference Zhang, Aleksic and Gao34) . It has been generally observed that community-dwelling younger adults have higher IGF-1 levels than older people(Reference Goodman-Gruen and Barrett-Connor35). Similarly, the mediated role of IGF-1 may interpret the stronger associations of EDIH and EDIR with mortality among diabetic patients.
Strengths of the current study include use of a nationally representative sample of US adults and a prospective cohort design. Besides, dietary analyses tools that directly evaluate the insulinaemic potential of diet by RRR and/or linear regression may represent the most efficient tools for large-scale epidemiological studies to assess the insulin resistance/hyperinsulinaemia-mediated diet-disease associations, since EDIR/EDIH can significantly predict concentrations of insulin response-related markers.
Our study has several limitations. First, self-reported diet and other lifestyle factors from questionnaires have measurement errors. Second, dietary information was collected based on a single measurement at baseline, and participants may change their dietary habits during the follow-up. Therefore, misclassification of dietary intake may exist. Such bias in cohort study could be non-differential in most situations and is likely to lead to the underestimation of the observed association if exposure data are binary(Reference Jurek, Greenland and Maldonado36), while, in the present study, the misclassification can lead to bias in either direction even the misclassification is non-differential, given the continuous or polytomous exposure data in the current analysis. Third, we had only a single measure of biomarkers, which may underestimate validity of EDIH and EDIR scores assessed by correlation coefficients with the corresponding biomarkers in the validation set(Reference Perrier, Giorgis-Allemand and Slama37). Fourth, despite a reasonable external validity due to a nationwide representative sample in the current study, the internal validity could have been hampered, because the participants were from many states or areas in the USA. However, upon further adjustment for the primary sampling unit, the results were similar to those in the main analysis.
In conclusion, our findings add to previous studies suggesting that diets with a higher insulinaemic potential were associated with elevated risk of overall and major CVD-specific mortality. These findings provide strong evidence that insulin resistance and hyperinsulinaemia may partially mediate the association between diet and death risk. Guidelines and interventions highlighting the importance of reducing or avoiding insulinaemic diet may therefore promote health and longevity.
Acknowledgements
This work was supported by the National Natural Science Foundation of China (82073651), Anhui Provincial Natural Science Foundation (2008085MH262 and 2108085QH357), Anhui Provincial Education Department (gxyqZD2021099) and grants from Anhui Medical University (XJ201935, 2021xkjT007, and 2019xkj161).
H. L. and Y. Z. had full access to all the data in the study and take responsibility for the integrity of the data and the accuracy of the data analysis. Study concept and design: W. Y. and Y. W. Acquisition, analysis or interpretation of data: all authors. Drafting of the manuscript: Y. W. and W. Y. Critical revision of the manuscript for important intellectual content: all authors. Statistical analysis: Y. W., H. L. and Y. Z. Obtained funding: W. Y. Administrative, technical or material support: B. C., J. Z. and W. Y. Study supervision: W. Y.
There are no conflicts of interest.
Supplementary material
For supplementary material referred to in this article, please visit https://doi.org/10.1017/S0007114521004815


