


The intestinal ecosystem plays an essential role in broiler performance, health and welfare(Reference Pan and Yu1). Traditionally, subtherapeutic dosages of antimicrobials, the so-called antimicrobial growth promoters, have been used in feed to maintain intestinal health. Moreover, most of the therapeutic antimicrobial usage in broilers is targeting intestinal diseases and syndromes(Reference Persoons, Dewulf and Smet2). Since the ban on antimicrobial growth promoters in many regions worldwide and following incentives to reduce antimicrobial usage altogether, plenty of alternative gut health promoting solutions have been developed, including dietary composition optimisation, probiotics, prebiotics, synbiotics, phytogenics and enzymes, amongst others(Reference Seal, Lillehoj and Donovan3).
Muramidases constitute a category of enzymes with a different activity as compared with classical xylanases, proteases and phytases that are often used in poultry diets. They target peptidoglycan (PGN) from bacterial cell walls, cleaving the β-1,4-glycosidic linkages between N-acetylmuramic acid and N-acetyl glucosamine, which are the basic elements in the carbohydrate backbone of the PGN(Reference Ragland and Criss4). So far, the best studied muramidase is lysozyme from hen egg white. Previous studies have shown that supplementation of hen egg white lysozyme in poultry(Reference Abdel-Latif, El-Far and Elbestawy5,Reference Liu, Guo and Wang6) and piglet diets(Reference Nyachoti, Kiarie and Bhandari7–Reference Long, Lin and Zhu9) could promote performance by improving gut health and non-specific immunity and protect from pathogen colonisation and subsequent disease, such as in the case of Clostridium perfringens-associated necrotic enteritis in broilers(Reference Liu, Guo and Wang6). It is uncertain whether the mere antibacterial activity of hen egg white lysozyme can explain all of the effects on intestinal health and performance, or whether PGN hydrolysis products are also involved in the observed effects.
While hen egg white lysozyme is among the best studied enzymes, very little is known about the mode of action of other muramidases. Recently, a muramidase derived from the fungus Acremonium alcalophilum has been demonstrated to improve broiler performance specifically by enhancing ileal digestibility of proteins(Reference Sais, Barroeta and Lopez-Colom10,Reference Goodarzi Boroojeni, Manner and Rieger11) . The present study aimed to provide new insights in molecular mechanisms by which the muramidase is involved in the modulation of host intestinal inflammation, by studying the muramidase-induced release, and activity of PGN degradation products.
Methods
Origin of the muramidase
The muramidase used in this study (Balancius™, DSM Nutritional Products) was produced and purified by Novozymes A/S as described by Lichtenberg et al. (Reference Lichtenberg, Perez Calvo and Madsen12). The muramidase was used in liquid form in the in vitro experiments of this study. A dried solid form of the product was used in the in vivo trial of this study. The muramidase activity was expressed in muramidase units (LSU(F)) as described by Lichtenberg et al. (Reference Lichtenberg, Perez Calvo and Madsen12). In brief, one LSU(F) unit is defined as the amount of enzyme that increases the fluorescence of 12·5 μg/ml fluorescein-labelled PGN (purified from Micrococcus luteus and supplied by Novozymes A/S) by a value that corresponds to the fluorescence of 0·077 mm fluorescein isothiocyanate, per min at pH 7·5 and 30°C.
Characterisation of Acremonium alcalophilum muramidase activity in vitro
Quantification of muramyl dipeptide release from peptidoglycan using UPLC-MS/MS
To evaluate whether muramidase from A. alcalophilum is able to degrade PGN into its minimal active unit muramyl dipeptide (MDP), a 25 µg/ml and 250 µg/ml PGN suspension (380 μl) from either M. luteus (Sigma-Aldrich) or Staphylococcus aureus (Sigma-Aldrich) were prepared and 5 LSU(F) muramidase was added to each of the PGN samples. As a control, five LSU(F) muramidases in PBS were used. Samples were incubated at 30°C for 20 min, after which the samples were divided into two aliquots. One aliquot was immediately used in further cell tests (hNOD2 reporter assay described below), whereas the second aliquot was stored at −20°C until MDP quantification using UPLC-MS/MS.
After thawing the muramidase-treated PGN, or the untreated PGN, 150 μl of samples was transferred into 1·5 ml eppendorf tubes containing a mixture of 30 μl of 4 % (v/v) aqueous H3PO4 solution and 900 μl acetonitrile (ACN) containing 1 % formic acid (FA). The mixture was vortexed, boiled for 5 min at 95°C and centrifuged at 18 000 g for 15 min at 4°C. The supernatant (950 µl) was transferred and evaporated for 45 min with N2 gas (1 litre/min). The remaining residue was resuspended with 100 μl of ultrapure water containing 10 % methanol (MeOH) with 1 % FA and loaded on the WCX Oasis® elution ninety-six-well plate (Waters), which was preconditioned with 500 μl of ACN and equilibrated using 200 μl of ultrapure water containing 10 % MeOH with 1 % FA. The sample was immediately eluted and subsequently diluted with 100 μl ACN containing 1 % FA.
MDP quantification was performed using a UPLC-MS/MS method, which was developed on an Acquity UPLC coupled to a Xevo™ TQ-S MS (Waters) with electrospray ionisation source and a triple quadrupole mass analyser. An Acquity UPLC BEH Amide Column (100 × 2·1 mm, 1·7 μm) with a suitable guard column was used. The sample compartment was kept constant at 10°C, while the column temperature was maintained at 60°C. A quantity of 10 μl of the sample was injected, and the flow rate was set to 0·5 ml/min. A mobile phase system consists of solvent A (water, ACN and dimethyl sulfoxide) in the ratio of 2:93:5 (by vol.) and 0·1 % FA w/v) and solvent B (water, ACN and dimethyl sulfoxide in the ratio of 93:2:5 (by vol.) and 0·1 % FA w/v) with an applied gradient from 100 to 70 % A in 3·5 min. The MS was operated in the positive electrospray ionisation mode, with an optimised capillary voltage of 3·0 kV, cone voltage of 20 V and source offset of 50 V. The desolvation temperature was set at 500°C, and the cone and desolvation gas (N2) flows were set at 150 and 1000 litres/h, respectively. Acquisition was performed in the multiple reaction monitoring modes with m/z 493·13–m/z 475·25 transition as quantifier and m/z 138·21 as qualifier. The applied collision energy was 10 eV for quantifier and 35 eV for qualifier. Data were acquired and analysed through MassLynx® software. The detection limit of MDP was 0·003 µg/ml. The MDP quantification from muramidase-treated M. luteus PGN was below the limit of detection. Therefore, only results from muramidase-treated S. aureus PGN are reported.
Bacterial cell lysis assay
The antibacterial activity of A. alcalophilum muramidase was evaluated using a M. luteus turbidity assay. Therefore, a 0·3 mg/ml lyophilised M. luteus (ATCC no. 4698, lyophilised cells, M3770, Sigma-Aldrich) working suspension was prepared in phosphate buffer (66 mm; pH 6·24) and mixed for 30 min in a vortex mixer. Quantities of 20 μl of muramidase were prepared at four different concentrations (0·05, 0·5, 5 or 400 LSU(F)) and added to the wells of a flat-bottomed ninety-six-well plate, in triplicate. Lysozyme (400 U) was used as a positive control. Immediately before monitoring the optical density, 200 µl M. luteus working suspension was added to each well containing the enzyme solution or the phosphate buffer as blank. The absorption was read at a wavelength of 450 nm every minute using a Microplate Spectrophotometer (Multiskan™ GO, Thermo Scientific) to follow the kinetics of the reaction for 10 min at 25°C.
hNOD2 activation using HEK-Blue tm -hNOD2 reporter cells
The HEK-Blue™-hNOD2 cells that stably co-express human nucleotide-binding oligomerisation domain-containing protein 2 (NOD2) along with NF-κB-inducible secreted embryonic alkaline phosphatase (SEAP) reporter gene were purchased from InvivoGen. HEK-Blue™-hNOD2 cells are designed to detect stimulants of the human NOD2 receptor by induction of SEAP. The levels of SEAP were measured with HEK-Blue™ Detection (InvivoGen), a cell culture medium that is designed for real-time detection of SEAP. The cells were cultured and maintained according to the manufacturer’s recommendations. To evaluate NOD2 activation of the muramidase-treated PGN suspension, 20 µl of the muramidase-treated PGN or untreated PGN samples was added into a ninety-six-well plate with 250·000 cells/ml hNOD2 cells (180 µl per well). Pure MDP at a concentration of 1 µg/ml were used as a positive control. NF-κB-induced SEAP activity was assessed in the culture supernatant using HEK-Blue™ and read at optical density 650 nm after 16 h.
In vivo evaluation of the effect of Acremonium alcalophilum muramidase on intestinal morphology and microbial composition in broiler chickens
Birds, housing and experimental treatment
A total of 144 male 1-d-old Ross-308 broilers were obtained from a local hatchery and randomly divided into eighteen pens (eight birds per pen) on wood shavings following the guidelines of the ethical committee of the faculty of Veterinary Medicine, Ghent University, in accordance with the EU Directive 2010/63/EU. The animals were not vaccinated. Water and a maize–wheat–soyabean meal-based diet (Table 1) were provided ad libitum. Randomly selected pens were allocated to one of two experimental treatments: a control diet (CTR) or CTR diet supplemented with muramidase from A. alcalophilum at 25 000 LSU(F)/kg feed (MUR), nine pens each. The dosage (25 000 LSU(F)/kg feed) used here is the minimal recommended dosage of the product as shown in previous studies(Reference Sais, Barroeta and Lopez-Colom10–Reference Lichtenberg, Perez Calvo and Madsen12). The light schedule was an 18 h light–6 h dark cycle. IR bulbs (one per pen during the first week) together with a central heating system provided the optimal temperature.
Table 1. Ingredients and nutrient composition of basal diets*

ME, metabolisable energy.
* The starter diet was given from day 1 until day 13, the grower diet from day 14 until day 26.
† The premix provided per kg diet: 3600 μg vitamin A; 60 μg vitamin D3; 50 mg vitamin E; 1·5 mg vitamin K3; 2·0 mg vitamin B1; 7·5 mg vitamin B2; 3·5 mg vitamin B6; 12 mg d-pantothenic acid; 460 mg choline chloride; 35 mg niacin; 20 μg vitamin B12; 1·0 mg folic acid; 0·2 mg biotin, 80 mg Fe; 12 mg Cu; 60 mg Zn; 85 mg Mn; 0·4 mg Co; 0·8 mg iodine; 0·15 mg Se; 125 mg antioxidant.
‡ ME calculated with EC equation based on analysed crude nutrients according to the formula: ME (MJ/kg) = ((15·51 × crude protein + 34·31 × fat +16·69 × starch +13·01 × sugar)/1000).
At 26 d of age, two birds per pen were euthanised by an intravenous overdose of 20 % sodium pentobarbital (Kela). Intestinal content from duodenum, ileum and caecum was snap-frozen in liquid N2 and stored at –20°C for microbiota composition analysis (16S rRNA sequencing). Duodenal tissue samples were collected and fixed in 4 % phosphate-buffered formaldehyde for histological analysis.
Intestinal morphology and goblet cell staining
Formalin-fixed intestinal tissue samples (eighteen birds/treatment) were embedded in paraffin and sectioned at 5 µm. Sections were stained with haematoxylin–eosin. Villus height and crypt depth were assessed using a PC-based image analysis system (Leica Application Suite V4.1, LAS V4.1; Leica). Villus height was measured from the tip of the villus to the crypt–villus junction. Crypt depth was measured from its base up to the crypt–villus junction. Ten villi/crypts were randomly measured per section, after which the average per animal was calculated. To detect intestinal goblet cells, duodenal tissue was stained with periodic acid–Schiff stain. The number of periodic acid–Schiff stain+ goblet cells was expressed as number cells/100 μm epithelium layer, based on the average measurements of ten villi.
Immunohistochemistry for quantification of CD3+ T-cells
For immunohistochemical staining of CD3+ cells, histological sections from duodenum were automatically deparaffinised (Shandon Varistain-Gemini, Thermo Scientific) before antigen retrieval with a pressure cooker in citrate buffer (10 mm, pH 6). Endogenous peroxidase activity was blocked by treating the slides with peroxidase blocking reagent (S2023, Dako) for 5 min. T-cells (CD3+ cell abundance) in duodenum were immunostained using a polyclonal primary antibody against CD3 (A0452, Dako, 1:100 dilution, 30 min at room temperature), followed by incubation with a secondary labelled polymer-HRP anti-rabbit (Envision + System-HRP (DAB) (K4011), 30 min at room temperature). The intraepithelial lymphocytes (IEL) from the duodenal tissue were counted manually and expressed as number cells/100 μm epithelium layer. The number of IEL was based on the average of ten villi per section. Total CD3+ area percentage was quantified using the computer-based image analysis programme, LAS V4.1. (Leica) in three representative fields of view per intestinal section.
DNA extraction and 16s rRNA gene sequencing
DNA was extracted from either 100 mg caecal content or 200 mg duodenal or ileal content of one bird per pen (nine birds/treatment), using the cetrimonium bromide method as previously described by Griffiths et al. with minor modifications as described by Aguirre et al. (Reference Griffiths, Whiteley and O’Donnell13,Reference Aguirre, Vuorenmaa and Valkonen14) . Extracted DNA was stored at −20°C until further processing.
The V3–V4 hypervariable region of the 16S rRNA gene was amplified using the gene-specific primers S-D-Bact-0341-b-S-17 and S-D-Bact-0785-a-A-21, as described by Aguirre et al. (Reference Aguirre, Vuorenmaa and Valkonen14). The final barcoded libraries were combined to an equimolar 5 nm pool and sequenced with 30 % PhiX spike-in using the Illumina MiSeq v3 technology (2 × 300 bp, paired-end) by Macrogen.
Bioinformatics and statistical analysis of 16s rRNA gene amplicon data
Demultiplexing of the amplicon data set and deletion of the barcodes were done by the sequencing provider. Quality of the raw sequence data was checked with the FastQC quality-control tool (Babraham Bioinformatics), followed by initial quality filtering using Trimmomatic v0.38, cutting reads with an average quality per base below fifteen using a four-base sliding window and discarding reads with a minimum length below 200 bp. The paired-end sequences were assembled, and primers were removed using PANDAseq(Reference Masella, Bartram and Truszkowski15), with a quality threshold of 0·9 and length cut-off values for the merged sequences between 390 and 430 bp. Chimeric sequences were removed using UCHIME(Reference Edgar, Haas and Clemente16). Open-reference operational taxonomic unit (OTU) picking was performed at 97 % sequence similarity using USEARCH (v6.1) and converted to an OTU table(Reference Edgar17). OTU taxonomy was assigned against the Silva database (v132, clustered at 97 % identity) using the PyNast algorithm with QIIME (v1.9.1) default parameters(Reference Caporaso, Kuczynski and Stombaugh18). OTU with a total abundance below 0·01 % of the total sequences were discarded(Reference Bokulich, Subramanian and Faith19). Potential contaminant chloroplastic and mitochondrial OTU were removed from the data set resulting in an average of 50 726 reads per sample. To select the appropriate subsampling depth, α rarefaction curves were generated using the QIIME ‘alpha_rarefaction.py’ script. Samples were subsampled (rarefied) by random sampling to a depth of 10 546 reads per samples. Samples from one bird per group were excluded from further analysis, resulting in eight birds per group.
Further analysis of α-diversity (observed OTU, Chao1 richness estimator and Shannon diversity estimator) and β-diversity (Bray–Curtis and unweighted UniFrac dissimilarities) was performed using the phyloseq (Reference McMurdie and Holmes20) pipeline in R (v3.6.0). To compare α-diversity between CTR and MUR group in each intestinal segment, a Wilcoxon rank sum test was performed. Differences in β-diversity were examined using the anosim function from the vegan package. Differences in relative abundance at the phylum level were assessed using the two-sided Welch t test from the mt wrapper in phyloseq, with the P-value adjusted for multiple hypothesis testing using the Benjamini–Hochberg method. To detect differentially abundant families or genera between the CTR and MUR groups, DESeq2 was applied on the non-rarefied community composition data for either duodenal, ileal or caecal communities(Reference Love, Huber and Anders21). Significant differences were obtained using a Wald test followed by a Benjamini–Hochberg multiple hypothesis correction.
Statistical analysis
Statistical analysis on the gut microbiota was performed using R, as described above(Reference McMurdie and Holmes20). All other analyses and calculations were performed using GraphPad Prism software (version 5.03). Normality of the data was tested with the D’Agostino–Pearson normality test. A Student’s t test was used for normal distributed data. When the data were not normally distributed, the comparisons between groups were done by Mann–Whitney U test. For all tests, a P-value < 0·05 was considered significant.
Results
Muramidase from Acremonium alcalophilum degrades peptidoglycan to muramyl dipeptides but does not cause bacterial lysis
An average of 0·027 (s em 0·02) µg/ml MDP was detected in the reaction mixture of 250 µg/ml PGN treated with muramidase, while no MDP were detected in the untreated PGN samples. The MDP levels from 25 µg/ml treated PGN samples were below the detection limit (Fig. 1).

Fig. 1. Representative selected reaction monitoring (SRM) chromatograms for standard control 0·01 µg/ml muramyl dipeptide (MDP) (a), muramidase-digested peptidoglycan (PGN) (b) and undigested PGN (c). The peak at 5·4 min was identified as MDP.
To further evaluate the antimicrobial potential of A. alcalophilus muramidase, the bacterial cell lysis activity was determined using different concentrations of muramidase (ranging from 0·05 LSU(F) up to 400 LSU(F)). At none of the tested concentrations, bacterial lysis was observed.
Muramidase degrades peptidoglycan to generate nucleotide-binding oligomerisation domain-containing protein 2 ligands
Although some increase in absorbance was observed, treatment of HEK293-hNOD2 cells with the lowest concentration of muramidase-treated PGN (25 µg/ml) did not significantly induce the activation of NOD2. When used at 250 µg/ml, it was shown that muramidase-treated PGN from both S. aureus and M. luteus were able to activate the NOD2 receptor in the HEK293 cells. Moreover, no NOD2 activation was observed by pure PGN or by the muramidase enzyme without PGN substrate (Fig. 2).

Fig. 2. Degradation of peptidoglycan (PGN) by muramidase generates nucleotide-binding oligomerisation domain-containing protein 2 (NOD2) ligands. Two different concentrations of peptidoglycans (25 or 250 µg/ml PGN) isolated from either Staphylococcus aureus (SA) or Micrococcus luteus (ML) were either untreated (□) or pretreated with 5 LSU(F) muramidase (![]() ). PBS without (□) or with 5 LSU(F) muramidase (
). PBS without (□) or with 5 LSU(F) muramidase (![]() ) was used as a negative control, whereas muramyl dipeptide (MDP) was used as a positive control for NOD2 activation (1 µg/ml,
) was used as a negative control, whereas muramyl dipeptide (MDP) was used as a positive control for NOD2 activation (1 µg/ml, ![]() ). Values are means of three separate experiments (each done in triplicate), with standard errors of the mean represented by vertical bars. Mean values are significantly different from compared bars: **P < 0·01, ***P < 0·001, analysed by one-way ANOVA, Tukey’s multiple comparison test.
). Values are means of three separate experiments (each done in triplicate), with standard errors of the mean represented by vertical bars. Mean values are significantly different from compared bars: **P < 0·01, ***P < 0·001, analysed by one-way ANOVA, Tukey’s multiple comparison test.
Muramidase supplementation of broiler feed increases the duodenal goblet cell and intraepithelial lymphocyte abundance while reducing overall duodenal T-cell abundance
Increased densities of goblet cells (P = 0·0006) (Fig. 3(a)) and IEL (P = 0·0003) (Fig. 3(b)) were detected in the duodenal epithelium of broilers fed the muramidase-containing diet. The CD3+ T-cell (P = 0·026) area percentage was significantly lower in the duodenal tissue from birds fed the muramidase-supplemented diet as compared with the control birds (Fig. 3(c)). A decrease in villus height (P = 0·003) (Fig. 3(d)) and crypt depth (P = 0·010) (Fig. 3(e)) was observed in broilers with muramidase treatment as compared with birds fed with the control diet, while no changes (Fig. 4(f)) were observed in the villus length:crypt depth ratio.

Fig. 3. Effects of muramidase (MUR) supplementation on numbers of goblet cells and intraepithelial lymphocyte (IEL), CD3+ T-cell abundance, villus height and crypt depth, measured in duodenum sections of chickens at day 26. Analyses based on ten measurements per section per bird for goblet cells (number per 100 µm), IEL (number per 100 µm), villus length (μm) and crypt depth (μm) or three microscopic fields per section for CD3 measurements (area %). Each dot represents an individual chicken. *P < 0·05, **P < 0·01, ***P < 0·001. CTR, control.

Fig. 4. Measures of bacterial diversity in the duodenum, ileum and caecum from birds fed a control or muramidase-supplemented diet. α-Diversity metrics (a) based on the number of observed operational taxonomic units (OTU) (Observed), Chao1 richness indicator (Chao1) or Shannon diversity estimator (Shannon). Group: ![]() , CTR,
, CTR, ![]() , MUR. Principle coordinate analysis plot of bacterial β-diversity based on Bray–Curtis dissimilarity (b) or unweighted UniFrac (c). Group:
, MUR. Principle coordinate analysis plot of bacterial β-diversity based on Bray–Curtis dissimilarity (b) or unweighted UniFrac (c). Group: ![]() , CTR,
, CTR, ![]() , MUR. Each dot represents an individual chicken microbiome. CTR, control feed; MUR, muramidase-supplemented feed. *P < 0·05, **P < 0·01.
, MUR. Each dot represents an individual chicken microbiome. CTR, control feed; MUR, muramidase-supplemented feed. *P < 0·05, **P < 0·01.
Influence of muramidase on the duodenal, ileal and caecal microbial diversity
Dietary supplementation of muramidase resulted in a significant increase in both the microbial richness (observed OTU: P = 0·021, Chao1: P = 0·065) and microbial diversity (Shannon: P = 0·002) in the duodenum. This is in contrast to the situation in the caeca, where both the microbial richness and diversity were significantly decreased in the muramidase-supplemented group (observed OTU: P = 0·003, Chao1: P = 0·021, Shannon: P = 0·038). No effect on the α-diversity of the ileal microbiome was observed (observed OTU: P = 0·161, Chao1: P = 0·195, Shannon: P = 0·130) (Fig. 4(a)). Both Bray–Curtis (Fig. 4(b)) and unweighted UniFrac (Fig. 4(c)) dissimilarities were calculated to investigate the overall microbial community composition of the samples. Muramidase supplementation to the feed resulted in a significant differentiation of the duodenal and caecal microbial community structures, with the treatment explaining 20 % (Bray–Curtis: P = 0·018) to 19 % (unweighted UniFrac: P = 0·014) of the variation between the duodenal samples and 10 % (Bray–Curtis: P = 0·074) to 18 % (unweighted UniFrac: P = 0·009) of the variability in the caecum. No difference could be observed in the ileal microbial community structures (Bray–Curtis: P = 0·466, unweighted UniFrac: P = 0·193).
Influence of muramidase on the taxonomic composition of the duodenal, ileal and caecal microbiota composition
At phylum level, the duodenal microbiome was highly abundant in Firmicutes (MUR: 70·6 %, CTR: 71·2 %), followed by the phylum Proteobacteria (MUR: 24·7 %, CTR: 27·0 %) and Actinobacteria (MUR: 4·5 %, CTR: 1·6 %). Addition of muramidase to the broiler diet had no significant influence on the duodenal microbiome at phylum level. In the ileum, the phylum Firmicutes dominated both the muramidase-supplemented and control groups (97·3 and 97·0 %, respectively). A significant difference in the phylum Actinobacteria was observed in the ileal microbiome (MUR: 0·3 % v. CTR: 2·5 %, P < 0·001). Also in the caecum, the Firmicutes was the most prevalent phylum in both groups (MUR: 98·0 %, CTR: 95·0 %), with a minor portion belonging to the Proteobacteria (MUR: 1·7 %, CTR: 3·7 %). The phylum Tenericutes was significantly less abundant in the caecal microbiome of the muramidase-supplemented birds (MUR: 0·1 %, CTR: 1·0 %, P = 0·015).
Differentially abundant families or genera in the duodenal, ileal or caecal microbiota from birds fed a muramidase-supplemented diet as compared with the control diet were identified using DESeq2. In the duodenum, the family Christenellaceae was significantly more abundant in the muramidase-fed birds than the control birds, a shift that was entirely due to bacteria belonging to the genus Christensenellaceae R-7 group (Tables 2 and 3). No significant effect on the other genera in the duodenum could be observed (Table 2). Twelve genera and seven families were differentially abundant between the ileal microbiota from birds fed either the control or the muramidase-containing diet. The family Corynebacteriaceae and the genera Corynebacterium 1, Staphylococcus, Brachy-bacterium and an uncultured genus from the family Peptostreptoc-occaceae were less abundant in the ileal microbiome of birds fed a muramidase-supplemented diet. All other differentially abundant families and genera in the ileal microbiome had a rather low abundance (mean relative abundance <0·1 % on genus level and <1 % on family level) (Tables 2 and 3). The families Ruminococcaceae and Enterobacteriaceae were significantly more abundant in the caecum of muramidase-fed birds, which was also reflected on genus level, showing an increase in the genera Butyricicoccus, Ruminiclo-stridium 5 and Escherichia–Shigella. Furthermore, the prevalence of the genera Eisenbergiella and Lachnoclostridium was increased in muramidase-fed birds. Muramidase supplementation in the feed significantly decreased the caecal abundance of the family Lactobacillaceae, while increasing the abundance of the family Erysipelotrichaceae. Furthermore, a decreased prevalence of some low abundant families (mean relative abundance < 0·05 %) belonging to the phyla Actinobacteria, Firmicutes and Proteobacteria was observed in the caecum of muramidase-fed birds (Table 3). The abundance of only three genera in the caecal microbiome was significantly altered by the muramidase supplementation in the feed, showing a reduction of the genera Subdoligranulum and Brachybacterium and an increase of an unknown genus belonging to the family Erysipelotrichaceae (Table 2).
Table 2. Differentially abundant genera in the duodenal, ileal or caecal microbiota*

CTR, control; MUR, muramidase.
* Significant differences in genus level abundance in the duodenal, ileal or caecal microbiota from birds fed the muramidase-supplemented diet as compared with the control diet. The taxonomic classification, the mean relative abundance and the log2 fold change (MUR/CTR) of the DESeq2 normalised abundance of each genus are shown.
Table 3. Differentially abundant families in the duodenal, ileal or caecal microbiota*

CTR, control; MUR, muramidase.
* Significant differences in family level abundance in the duodenal, ileal or caecal microbiota from birds fed the muramidase-supplemented diet as compared with the control diet. The taxonomic classification, the mean relative abundance and the log2 fold change (MUR/CTR) of the DESeq2 normalised abundance of each family are shown.
Discussion
Muramidases (or lysozymes) are a superfamily of enzymes found in plants, micro-organisms and animal secretions, which have the common characteristic of cleaving the β-1-4-glycosidic linkages between N-acetyl muramic acid and N-acetyl glucosamine in the carbohydrate backbone of PGN from bacterial cell walls. PGN is a cross-linked heteropolymer that provides structural strength to the bacterial cell and protects the protoplast. Disruption of the PGN might trigger bacterial cell lysis. As such, lysozymes generally are considered as antibacterial enzymes. In animals, secreted lysozymes form an important part of the innate immune system, contributing to the protection of mucosal surfaces against bacterial invasion(Reference Ragland and Criss4). In the present study, we confirmed that a muramidase, derived from the fungus A. alcalophilum, indeed can degrade PGN. However, the enzyme did not cause bacterial lysis. The moderate effects on the intestinal microbiota observed in the in vivo trial are in agreement with the results observed by Sais et al. (Reference Sais, Barroeta and Lopez-Colom10), supporting the thesis that this enzyme may not lyse intact bacterial cells(Reference Ragland and Criss4,Reference Nash, Ballard and Weaver22) . One explanation for this unique characteristic could be that the binding site for this enzyme on the PGN might be only revealed after bacterial cell death(Reference Humann and Lenz23,Reference Vollmer and Seligman24) . Another explanation could be that this muramidase does not contain certain amphipathic helix stretches in its C-terminus. Indeed, Düring et al. (Reference During, Porsch and Mahn25) showed that antibacterial activity of lysozymes was associated with amphipathic helix stretches in the C-terminal domain of the enzyme and was independent of the PGN-degrading activity. Finally, it is also possible that this muramidase only hydrolyses the outermost layers of the PGN, as do the endogenous bacterial autolysins during PGN turnover(Reference Smith, Blackman and Foster26). Therefore, further studies are needed to unravel the three-dimensional structure of this muramidase and its interaction with PGN.
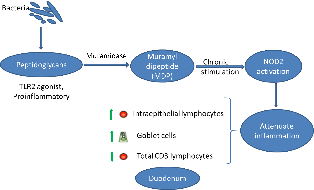
Bacteria are continuously entering the gastrointestinal tract (oral uptake and replication in the oral cavity). In humans, it has been shown that more than 90 % of the bacteria in the jejunum are dead(Reference Sundin, Mendoza-Ladd and Zeng27), leaving PGN fragments as a substrate for the muramidase. In the present study, we have shown that the muramidase could cleave purified PGN down to its minimal bioactive structure MDP. PGN fragments from non-invasive bacteria can be transported into the eukaryotic (host intestinal epithelial cell) cytosol through bacterial secretion systems followed by endocytosis or specific membrane transport systems(Reference Irazoki, Hernandez and Cava28). NOD2 is an intracellular receptor which senses MDP(Reference Negroni, Pierdomenico and Cucchiara29). Acute NOD2 stimulation activates NF-κB and mitogen-activated protein kinase pathways, leading to cytokine secretion and a pro-inflammatory response(Reference Strober, Murray and Kitani30). However, long-term NOD2 stimulation, as likely occurs in the gut, contributes to down-regulation of inflammatory responses(Reference Hedl, Li and Cho31). NOD2 expression in intestinal epithelial cells thus protects towards the development of inflammation(Reference Ferrand, Al Nabhani and Tapias32). In the present study, we used HEK293 NOD2 reporter cells to show that the muramidase breakdown of purified PGN led to activation of the NOD2 receptor. NOD2 contributes to the maintenance of mucosal homoeostasis, and single nucleotide polymorphisms in NOD2 have been identified as important risk factors for the development of inflammatory bowel disease in general and Crohn’s disease in particular in humans(Reference Negroni, Pierdomenico and Cucchiara29). Several studies have shown that chronic NOD2 stimulation could significantly down-regulate cytokine secretion upon re-stimulation through Pattern recognition receptors, which is impaired for individuals with Crohn’s disease-associated NOD2 polymorphisms(Reference Ferrand, Al Nabhani and Tapias32,Reference Jiang, Wang and Zeng33) . NOD2 activation also reverses the increase in paracellular permeability (gut leakage) following Toll-like receptor 4 stimulation by lipopolysaccharide from gram-bacteria in mice(Reference Barreau, Madre and Meinzer34). Although the same fundamental principles hold true in the chicken, the NOD proteins in this species are organised differently from mammals(Reference Boyle, Mayle and Parkhouse35) and certain mammalian NOD2 functions seem to be assumed by NOD1(Reference Tao, Zhu and Song36). However, further studies need to be performed in order to confirm this.
In the present study, we found that adding 25 000 LSU(F)/kg of A. alcalophilum muramidase to the feed of broilers significantly increased the density of goblet cells in the duodenum. This was also demonstrated by Sais et al. (Reference Sais, Barroeta and Lopez-Colom10) at the jejunum level after 35 d of supplementation, whereas Goodarzi Boroojeni et al. (Reference Goodarzi Boroojeni, Manner and Rieger11) found no effect on numbers of goblet cells in the ileum of broilers fed the same or higher amounts of the same muramidase. Treatment with NOD agonists up-regulates intestinal goblet cell numbers in mice(Reference Wang, Kim and Denou37). The increased goblet cell density, observed in the present study, thus might also be due to NOD activation by MDP formed through muramidase degradation of PGN. Goblet cells, as specialised epithelial cells, have a beneficial role in barrier maintenance via the secretion of mucus containing anti-microbial proteins(Reference Knoop and Newberry38).
In the present study, it was shown that adding the muramidase to broiler feed specifically increased IEL density in the duodenal mucosa. These results are in agreement with data from Sais et al. (Reference Sais, Barroeta and Lopez-Colom10), where inclusion of 35 000 LSU(F)/kg of microbial muramidase to the broilers diet increased the IEL numbers at the jejunum level after 35 d of supplementation. IEL function as sentinels in the maintenance of the mucosal barrier integrity(Reference Olivares-Villagomez and Van Kaer39). It has been suggested that these cells might also have a role in tolerance induction by producing anti-inflammatory cytokines and in protection from pathogenic organisms in humans(Reference Negroni, Pierdomenico and Cucchiara29). NOD2-deficient mice show a reduced number of IEL(Reference Jiang, Wang and Zeng33). This suggests that the expansion of the IEL population in the duodenal epithelium of broilers, observed in the present study, might also be triggered by MDP activation of NOD receptors.
Furthermore, a decrease in total CD3+ T-cell density was found in the duodenal tissue of broilers fed the muramidase in their diet. Although in this approach, we actually pool IEL with lamina propria T-cells, lamina propria T-cells are the largest population and they are a rough indicator of the inflammatory response(Reference Smith and Garrett40,Reference Furness, Kunze and Clerc41) . This is in accordance with Goodarzi Boroojeni et al. (Reference Goodarzi Boroojeni, Manner and Rieger11), who found a decrease in the number of CD45 (formerly: leucocyte common antigen) cells in the ileum of broilers supplemented with the same muramidase. These results show that muramidase supplementation of broiler feed reduces duodenal inflammation.
In the present study, moderate effects of the muramidase supplementation on the microbiota composition in the duodenum, ileum and caecum of the broilers were detected. Activation of NOD1 and NOD2 has been shown not to affect the intestinal microbial community composition in mice(Reference Robertson, Zhou and Geddes42), suggesting that effects of the muramidase on the microbiome may be direct. Even without bacterial killing, the differences in intestinal microbial composition between control and treated animals could be caused by differential proliferation levels between bacterial taxa because of the muramidase activity, so that some might have a competitive advantage over others. Another possible explanation is that effects of NOD2 activation could lead to host responses that can alter intestinal microbial composition. Both possible explanations need to be studied in more detail.
Muramidase treatment was associated with a significant increase in richness and diversity of the microbiota in the duodenum. It is well known that mucins, secreted by the goblet cells, can be used by specific microbial genera as a nutrient source(Reference Martens, Chiang and Gordon43,Reference Schroeder44) . Moreover, it is well documented that massive degradation of the endogenous bacterial cell wall takes place during bacterial growth, with PGN turnover rates of 45 % per generation, while in gram-positive bacteria, PGN accounts for more than 20 % of the weight of the bacterial cell(Reference Reith and Mayer45). This massive requirement for PGN building blocks may, under certain conditions, is a limiting factor for bacterial growth. The release of MDP by the muramidase might thus also support the duodenal microbiota.
Tenericutes lack a PGN layer on their surface. Therefore, these bacteria are intrinsically resistant to the PGN-degrading activity of muramidases. The significantly reduced abundance of this phylum in the caecal microbiome of the muramidase-supplemented birds indicates that at least part of the effects on the microbiota in the caeca may be indirect. Another finding was the decreased richness and diversity of the microbiota in the caeca from birds on the same muramidase-supplemented diet. Sais et al. (Reference Sais, Barroeta and Lopez-Colom10) also showed lower α-diversity of the microbiota in the caeca of the same muramidase-supplemented chickens, especially in young birds (day 9), although they were not able to detect changes in particular taxonomic groups. One possible explanation could be found in the study of Goodarzi Boroojeni et al. (Reference Goodarzi Boroojeni, Manner and Rieger11), who showed an increased ileal digestibility of dietary protein in broilers. Better nutrient digestion and absorption of dietary protein in the small intestine mean that the protein substrate available for caecal microbiota fermentation is poorer, which may potentially explain the reduction in richness and diversity of the caecal microbiota observed in the present study.
In conclusion, we showed that a fungus-derived muramidase degrades PGN into MDP leading to an activation of NOD2, which might be one of the underlying mechanisms, contributing to the beneficial effects observed in broiler performance studies. These results provide extra insights for a better understanding of the complex interplay between the host immunity and bacterial degradation products in maintaining homoeostasis in the intestinal system.
Acknowledgements
The authors would like to thank the PhD students and postdoctorates from the department of Pathology, Bacteriology and Avian Diseases from Ghent University who kindly collaborated with the collection of samples from the in vivo trial.
The present study has been supported by a research grant from DSM Nutritional Products Ltd.
Y. W., V. E., E. P. C., R. L. U., R. D. and F. V. I. designed the research. Y. W., E. G., R. D. and F. V. I. wrote the paper. Y. W. performed the experiments and interpreted the data. E. G. did the bioinformatics analysis. N. D. performed the UPLC/MS/MS analysis. Y. W., E. G., V. E., E. P. C., R. L. U., I. E., M. K., N. D., B. D. S., R. D. and F. V. I. contributed to the discussion and edited the manuscript. All authors read and approved the final manuscript.
The authors declare that they have no conflicting financial and non-financial interests.


