


With the rapid urbanisation process encountered in sub-Saharan Africa, dietary habits have been shown to differ considerably among ethnic groups(Reference Mennen, Jackson and Sharma1,Reference Galbete, Nicolaou and Meeks2) . Previous studies have shown changes in the traditional diet towards mixed food habits or a more ‘Westernised’ diet(Reference Sobal and Bisogni3,Reference Pretorius and Sliwa4) . This phenomenon, known as the nutrition transition, is accompanied by higher levels of fat, salt and sugar in the diet(Reference Pretorius and Sliwa4,Reference Senghor, Sokhna and Ruimy5) . As the nutritional quality of the diet declines, ethnic groups may become more susceptible to diet-related health problems similar to those affecting the mainstream population in Europe, such as obesity-related CVD and type 2 diabetes(Reference Mbanya, Motala and Sobngwi6,Reference Peralta, Ramos and Lipert7) .
Amongst the ethnic groups in Cameroon, the Béti (living in Yaounde and close regions) and the Bamiléké (living in the West Cameroon region), are amongst the largest ethnic groups to which Cameroonian self-identify to. Previous studies showed an increase in the prevalence of overweight and obesity in rural Cameroon and central obesity in urban Cameroon(Reference Marbou and Kuete8–Reference Cohen, Boetsch and Palstra11), and others reported a high prevalence of cardiometabolic diseases in Cameroonian adults(Reference Cohen, Gradidge and Ndao12–Reference Kengne, Sobngwi and Echouffo-Tcheugui15). Over the past decades, the Béti and Bamiléké people have been migrating from rural areas to the cities and have changed their eating habits by eating more frequently starches (e.g. rice, pasta), animal proteins (e.g. sea fish, beef) and processed palm oil(Reference Dapi, Hörnell and Janlert16–Reference Tata, Ickowitz and Powell18). Although obesity is prevalent in all newly arrived migrants to Yaoundé, the prevalence of obesity in Bamiléké people is threefold as high as that of Béti people(Reference Marbou and Kuete8,Reference Fouda, Lemogoum and Manga19–Reference Nansseu, Noubiap and Bigna21) .
Limited information on the overall diet in populations in transition living in Cameroon is provided by few studies that have recorded varying meal and snack frequencies and their implications in the development of obesity(Reference Niba, Atanga and Navti17,Reference Tata, Ickowitz and Powell18,Reference Cohen, Amougou and Ponty22) . Although these studies observed some variations in meal consumption, their findings did not explain the causes of such variations nor did they explore its relationship with ethnic groups, who are known to have a diversity of dietary habits(Reference Senghor, Sokhna and Ruimy5,Reference Abdullah, Teo and Foo23) . It is well known that consumption patterns are shaped by income, individual preferences and beliefs, cultural traditions, as well as geographical, environmental, social and economic factors(Reference Darmon and Drewnowski24,Reference Hiza, Casavale and Guenther25) . In addition, there is no consensus on their respective contributions to obesity. The identification of the determinants is therefore critical to identify vulnerable groups and to help public health authorities develop targeted nutritional campaigns to prevent obesity-related cardiometabolic diseases.
Since food is eaten in specific socio-ecological contexts (e.g. commensal low-processed diet in the rural or dull diet in urban fast-foods), it is crucial to account for multiple aspects or dimensions of diet simultaneous, including initial anthropological characteristics of subjects (e.g. BMI, body perception and food habits). Therefore, it is important to understand how anthropologically culturally different populations (i.e. Bamiléké and Béti) within the nutrition transition will respond to obesogenic urban environments. As part of the ANTRAC project (Nutritional Anthropology of Central African migrants to urban areas and France) studying the determinants of obesity in Central African populations in transition, the present study aimed to identify the determinants of the dietary pattern determinants of adults Cameroonian of two different ethnic groups, the Bamiléké and the Béti, and explore their potential indirect relationships with obesity in the context of nutrition transition.
Materials and methods
Study setting and participants
In 2012, we used a two-stage sampling strategy to recruit participants living in several villages locally identified as Béti and Bamiléké in rural Cameroon and the neighbourhoods of Yaoundé (online Supplementary Fig. S1). First, we randomly selected geographical sites from an exhaustive list of villages (for rural participants) and neighborhoods of Yaoundé (for urban participants), hence covering a large socioeconomic, education, and ethnicity gradient according to Cameroon’s National Institute of Statistics. Second, within these respective clusters, we randomly selected one of every three for inclusion. Inclusion criteria were as follows: being aged > 18 years old and self-identify as Béti or Bamiléké. We excluded pregnant women and elders with reduced mobility. Trained fieldworkers collected information. A total of 1115 men and women adults aged 18–73 years, self-identified as Béti and Bamiléké ethnicities, participated in the survey. We retained 728 subjects (65 %) for this study, those having responded completely to all questionnaires, especially the 24-h recall requiring detailed responses in food consumption, for which some participants were enabled to do (mainly for a lack of time and laziness to respond precisely).
Ethics
The present study was conducted according to the guidelines laid down in the Declaration of Helsinki, and permission to carry out the study and ethical clearance was obtained from the ethical committee of the Ministry of Public Health of Cameroon (N°2017/09/940/CE/CNERSH/SP). After being informed about the objective of the study, oral approval and written consent were obtained from each participant before the start of the study.
General characteristics of the sample
Socio-demographic information was collected using interviewer-administrated questionnaires. Marital status was categorised as married, single, cohabitation, divorced or widowed. Educational level was categorised as a primary school or less, college, high school and university. For each participant, the residence was categorised as rural or urban depending on whether they had lived there for at least 1 year.
The international wealth index(Reference Smits and Steendijk26) was used to define socio-economic status (SES) for survey respondents. Data were collected for variables including living standards such as household ownership of durable assets (radio, television, bicycles, motorbikes, cars, mobile phones, generator, fan, air conditioner, microwave oven and refrigerators) and infrastructure and housing characteristics (source of lighting, source of water, sanitation facility, the composition of the floor, walls and roof). Other variables assessed at the household level were urban/rural location and the number of persons living in the household. To create a composite measure of SES, a principal component analysis with orthogonal rotation was performed using these permanent income indicators. This approach based on household assets and characteristics(Reference Caro and Cortés27) is relevant and common in low-income countries where individual income and education are often inaccurate and insufficient to capture the full extent of an individual’s SES. In brief, an SES score was calculated for each individual by summarising the variance of all income indicators on the first principal component of the principal component analysis, explaining 21·3 % of the total variance (the second component explaining 6·8 %). Participants were then categorised into SES terciles. Therefore, high score was the tercile at the top of the distribution and the low score the tercile at its bottom.
Height was measured to the nearest mm using a portable stadiometer (Siber Hegner) using standardised techniques(28). Weight was measured, in very light clothing, to the nearest 100 g, using a digital beam scale (Tanita) using standardised techniques(28). BMI was calculated by dividing weight (in kilograms) by the square of height (in metres). According to WHO recommendations(Reference Pederson and Gore29), BMI was then categorised as normal weight: (18·5–24·9), overweight: (25–29·9) and obesity > 30.
Dietary intake
We identified food categories (online Supplementary Table S1) using the results of a dietary survey carried out to develop and validate ‘food portions photographs books’ (GPPA) for adults and children(Reference Amougou, Cohen and Mbala30). The GPPA includes the traditional Bamiléké and Béti dishes found in both rural and urban areas but also the so-called modern dishes encountered in urban areas.
All participants agreed to participate in the present study and completed the FFQ and a 24-h dietary recall. The GPPA was used to administrate a FFQ and a 24-h dietary recall by trained interviewers for each participant. Our FFQ is culture-specific, lists exhaustively more than 250 foods and asks the subjects how often they eat them. The consumption frequencies were ranked on a four-item scale defined as almost every day or every day, once or twice per week, twice to three times per month and never. Because the FFQ was not able to assess energy intake consumed, the 24-h recall was therefore designed to quantitatively assess current nutrient intake in Béti and Bamiléké. This complementary approach allowed better visibility of the dietary intake of participants through both assessments of the global diet with the FFQ and the specific energy intake consumed with the 24-h recall. To carry out the 24-h dietary recall, the administration of GPPA requires two main steps: (1) a quick list, where the respondent names everything they had to eat and drink over the previous 24-h period and (2) a second pass, in which the interviewer reviews all foods and drinks consumed, further clarifying portion sizes with the aid of GPPA to help stimulate memory. All dietary recalls were collected face-to-face for each participant on weekdays or weekends.
The daily energy intake in megajoules (MJ) was calculated for each subject with the nutritional composition of all foods from GPPA (online Supplementary Table S2) and, when necessary, complemented by the West African Food Composition Table developed by the FAO.
Data treatment and analysis
One-way ANOVA followed by the Bonferroni test, student t test and χ 2 test were performed when necessary to test any possible difference in dietary behaviour and general characteristics of participants. We used the default method of multiple correspondence analysis, which is a correspondence analysis of the Burt matrix for the data (foods/dishes consumption frequencies in Béti and Bamiléké ethnic groups), followed by simple scale adjustments. We choose the principal normalisation, which scales the coordinates by the principal inertias. The percentage of explained variance for each principal dimension with an eigenvalue above 1 has been interpreted by examining the respective contribution of both food categories and ethnicity to these dimensions. Finally, graphical displays of the pattern consumption of food items for each ethnic group were constructed. We retained the two first principal dimensions capturing the largest proportion of the total variance, displayed in one two-dimensional graph, plotting one axis against another.
Simple and multivariable linear regression models were conducted to determine the relationship between dietary intake (24-h recall) and their possible determinants (ethnicity, place of living, sex, age, marital status, educational level and SES) in the participants. Data analyses were carried out with STATA 14 (StataCorp).
Results
General characteristics of the sample
A total of 728 participants (Béti: 347, Bamiléké: 381) were included in complete case analyses (Table 1 ). A majority of participants Béti (195) and Bamiléké (222) lived in urban areas. The means ages ranged from 38 (sd 12) to 40 (sd 15) years among the Bamiléké and from 37 (sd 13) to 39 (sd 15) years among the Béti according to urban and rural areas. There was no significant difference between Bamiléké and Béti regarding SES scores whether in the rural or urban areas. However, Bamiléké and Béti (47 v. 46 %) with high SES lived in urban places, whereas Bamiléké and Béti (39 v. 34 %) with low SES lived in rural places. The level of Bamiléké married (62–63 %) was significantly different from that of Béti (26–41 %). The education levels between Bamiléké and Béti were significantly different in primary (45–62 % v. 32–53 %) and high school (17–18 % v. 9–30 %), respectively. Compared with Béti (5–8 %), the prevalence of obesity was significantly higher in Bamiléké (15–29 %).
Table 1. Characteristics of the studied population
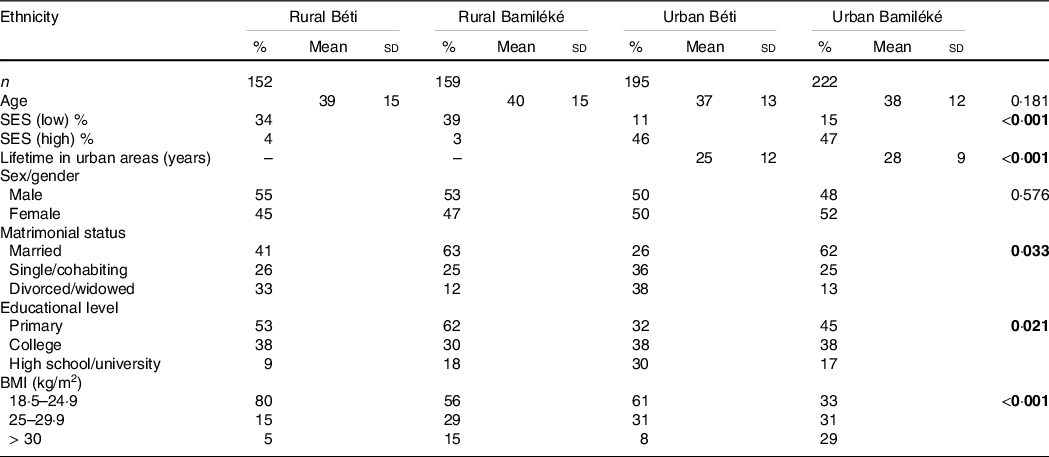
SES, socio-economic status.
Values for continuous variables age and continuous lifetime in urban areas are expressed as Mean (sd) and the associated P-values.
Values for categorical variables lifetime in urban areas, sex/gender, matrimonial status, educational level, SES and BMI are expressed as %.
Differences for continuous variables (age and lifetime in urban) are tested by one-way ANOVA followed by Bonferroni test P < 0·05.
Differences for categorical variables (SES, lifetime in urban areas, sex/gender, matrimonial status, educational level and BMI) are tested by a χ 2 test, P < 0·05.
Dietary intake
Characterisation of food consumption frequency in the study sample (n 728) is presented in Fig. 1. A clear pattern is seen in the plot. Axis 1 discriminates the frequencies of consumption of dishes and drinks with a frequent consumption (every day and once or twice per week) on the upper left, a monthly consumption (twice or three times per month) on the upper right and no consumption, on the lower left. There is also clear discrimination, along axis 1, between the Bamiléké, on the left, and the Béti, on the right. The Bamiléké was most often associated with high food frequency consumption (every day or once or twice per week), while the Béti was associated with low food frequency consumption (twice or three times per month).
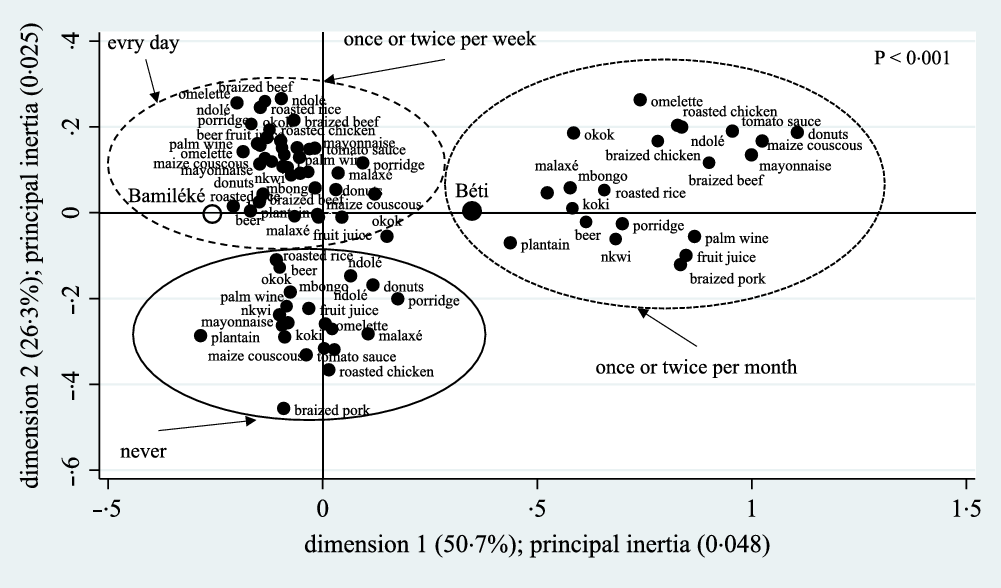
Fig. 1. Frequency map of foods/dishes consumption within Bamiléké (black open circle) and Béti (black circle) based on multiple component analysis (MCA). Frequent consumption (every day and once or twice per week) is found on the upper left, monthly consumption (twice or three times per month) on the upper right and no consumption (never) on the lower left. The P < 0·001 value in the upper right indicates the significant effect of the MCA model.
More precisely, for each food category, the average number of participants with a daily consumption (Table 2) was different between the Bamiléké and Béti people. For instance, depending on their place of residence (rural–urban), we observed a clear difference between the Bamileke v. the Beti participants with daily consumption of sauces (55 (sd 43)–79 (sd 57) % v. 51 (sd 37)–63 (sd 51) %) and complement (78 (sd 34)–121 (sd 47) % v. 77 (sd 29)–78 (sd 34) %), which are essential food categories in the composition of meals in Cameroon (Table 2). Therefore, the energy intake was higher in Bamiléké (13·8 (sd 4·6)–15·4 (sd 4·8) MJ) compared with Béti (9·7 (sd 3·5)–11·2 (sd 3·9) MJ) depending on their place of residence (rural–urban), respectively (Table 2).
Table 2. The average number of participants with daily consumption of the food categories and the energy intake (MJ) from the 24-h recall
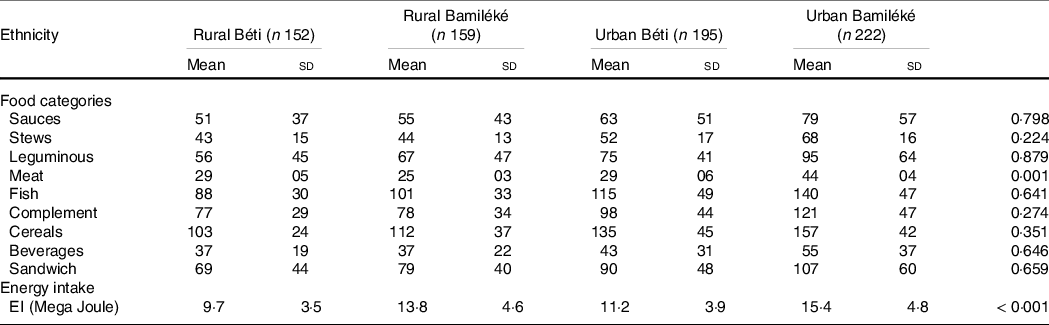
Values are the Mean (sd) and the associated P-values for participants with daily consumption of the food categories and energy intake from 24-h recall.
Differences are tested by one-way ANOVA followed by a Bonferonni test P < 0·05.
In rural places, the EI explains 43 % of BMI variance in Bamiléké, while in Béti, only 3 % of BMI variance was explained by the EI (Fig. 2). Significant differences were found between sex among both ethnic groups. As expected in urban places, the linear relation between EI and BMI was stronger and the EI explains 54 % of BMI variance in Bamiléké, while in Béti, only 12 % of BMI variance and significant differences were also found between sex among both ethnic groups (Fig. 2).
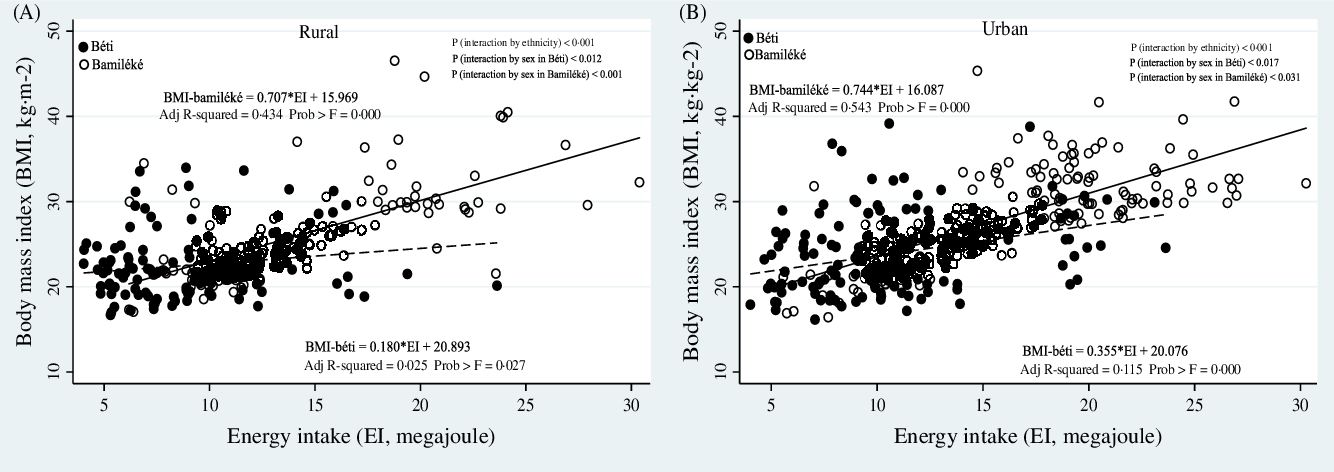
Fig. 2. Linear regression models between BMI (kg.m2) with energy intake (EI, megajoule) stratified by place of living (rural (A) and urban (B)) in Bamiléké and Béti. The black and open circle dots represent the distribution in Bamiléké and Béti, respectively. The black and dotted lines represent the fitted model in Bamiléké and Béti, respectively. Adjusted R2 shows the amount of variance of BMI explained by the EI. Prob > F is the P-value of each model. The P values to test the differences between Bamiléké and Béti (ethnicity), sex among Bamiléké and Béti are presented in the upper right.
Determinants of diet intake
To assess the relationship between socio-demographic with food intake, associations between ethnicity and location and other covariates (age, marital status, education, and SES) with EI (24 h recall) in the overall sample and by sex were investigated. Unadjusted linear regression analyses showed an increase in EI by 4·15 MJ in Bamiléké people in comparison with Béti people, an increase in EI by 1·65 MJ in urban in comparison to rural areas, and an increase in EI by 0·19 MJ with the length of stay in urban areas (Table 3). Similar results were observed in adjusted analyses. Adjusted analyses were stratified by sex with a larger effect size of the ethnicity factor. In adjusted linear regression analyses (age, marital status, education, and SES), the results for ethnicity, place of living, and lifetime in urban are quite similar to that of the unadjusted models (Table 3). In adjusted linear regression analyses (ethnicity, age, marital status, education and SES) the results for the place of living and lifetime in urban showed an increase in EI by 4·12 and 4·05 MJ, respectively.
Table 3. Associations of ethnicity and place of living with energy intake in the overall sample and by sex/gender*
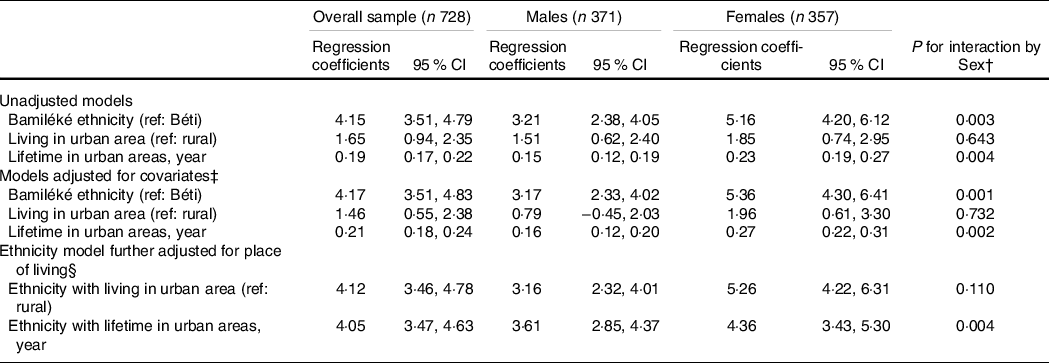
SES, socio-economic status.
* Values are regression coefficients (95 % CI) for categorical variables (v. the reference group) and continuous variables (expressed in a year).
† P-values for the interaction between the variable of interest (ethnicity and place of living) and sex/gender in the overall sample.
‡ Models were adjusted for age, marital status, education and SES.
§ Models were adjusted for age, marital status, education, SES and place of living.
The interaction between the place of living and EI stratified by the ethnicity showed a positive relationship and significant differences in terms of EI contributions (0·26 –2·49 MJ v. 0·19–0·44 MJ) between the Bamiléké and Béti, respectively (Table 4).
Table 4. Associations of ethnicity and place of living and covariates with energy intake in the overall sample and by sex/gender*
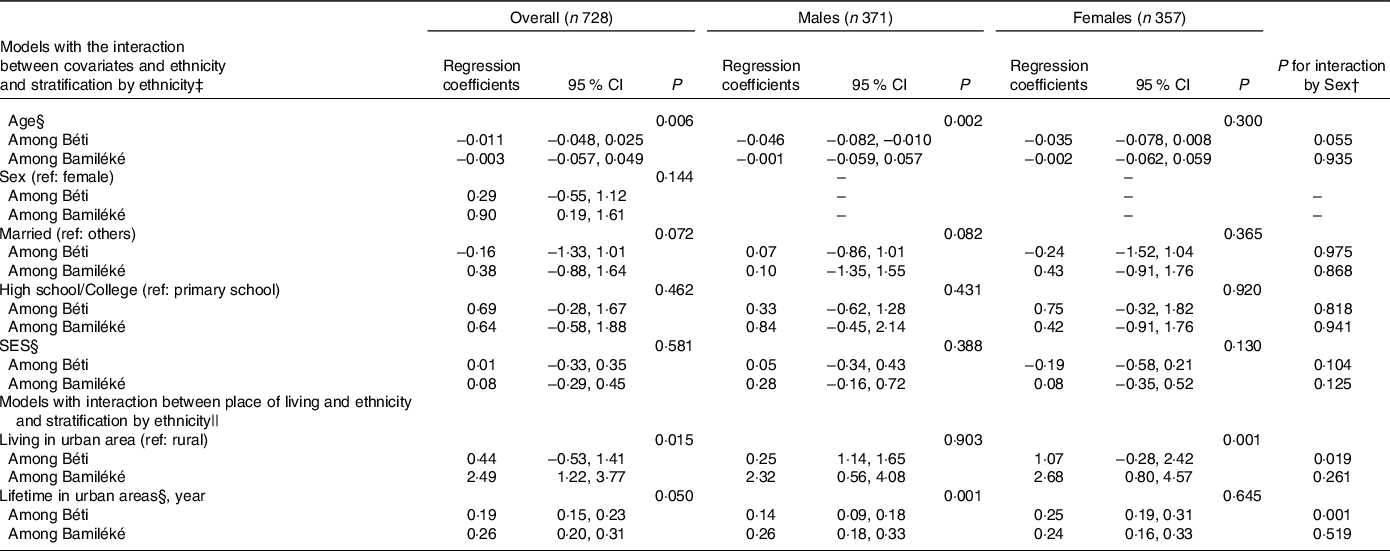
* Values are regression coefficients (95 % CI) for categorical variables (v. the reference group) and for continuous variables.
† P-values for the interaction between the variable of interest (ethnicity and covariates; ethnicity and place of living) and sex/gender in the overall sample.
‡ P-values are for the interaction term between covariates and ethnicity in models among both ethnicities.
§ Continuous variables: age and lifetime in urban areas are expressed in year, Socio-economic status is expressed as a score with an inverted direction. Regression coefficients (95 % CI) are for the covariates and the place of living (v. the reference group and continuous variables) among ethnicity strata.
|| P-values are for the interaction term between the place of living and ethnicity in models among both ethnicities.
Multivariable linear regression analyses between socio-demographic variables and energy intake are presented in Table 5. Ethnicity (4·02 MJ, P < 0·001), a lifetime in an urban area (0·21 MJ, P < 0·001) and education (0·59 MJ, P < 0·048) are predictors of EI.
Table 5. Multivariable linear regression model to assess the associations between socio-demographics and energy intake among the studied population
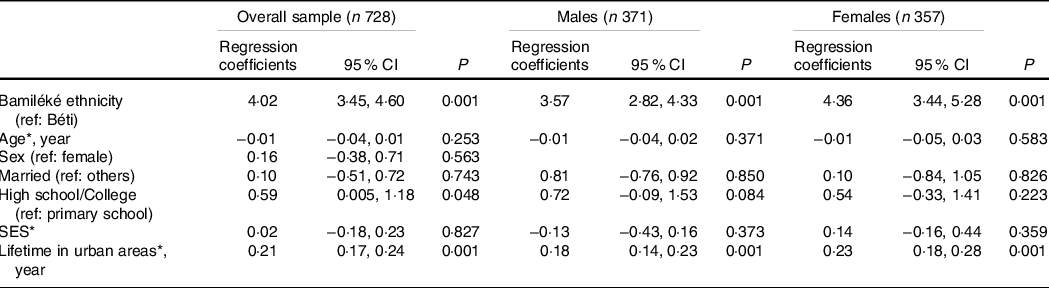
Values are regression coefficients (95 % CI) and the associated P-values for categorical variables (v. the reference group) and for continuous variables.
* Continuous variables: age and lifetime in urban areas are expressed in year, socio-economic status is expressed as a score with an inverted direction.
Discussion
The present study identified the determinants of dietary patterns of Cameroonian adults from two different ethnic groups, the Bamiléké, and the Béti, whose diets are culturally contrasted, to explore their potential relationships with obesity in the context of the ongoing nutrition transition in Cameroon.
In this study, we found two main results. First, we found that dietary patterns of Bamiléké people were composed of more energy-dense foods than the Béti people, regardless of the living area; this is in line with the stronger association between energy intake (EI) and BMI found among Bamiléké people. Second, we found strong associations of both ethnicity and living area with EI, independently of each other and other socio-demographic factors. This finding was expected in the context of the ongoing nutrition transition in Cameroon, as shown by previous studies(Reference Pasquet, Temgoua and Melaman-Sego10,Reference Cohen, Boetsch and Palstra11) . Interestingly, education appears to predict EI independently of ethnicity factor which was not the case for other socio-demographic factors (sex, marital status and SES).
Our results regarding food consumption concerning participants’ ethnicity showed a population-specific dietary pattern underlining the potential influence of anthropological characteristics of individuals. In every cultural tradition, there are concepts about eating patterns in adults as well as how adults feed their children(Reference Kumanyika31). For instance in the present study, the Bamiléké of both sexes showed a higher frequency of consumption of all categories of foods, particularly those containing a lot of palm oil (sauces, stews, meat, fish, complement, cereals, beverages and sandwiches), in comparison with Béti people. Furthermore, obesity and overweight affect a large proportion of the Bamiléké population studied; 15 to 29 % of adults aged over 18 years were obese and 29 to 31 % were overweight (Béti: 5 to 8 % obese and 15 to 31 % overweight). In comparison, the percentage of adults classified as overweight (including obesity) in Africa stands at a median of 24 % with a range from 6 % in Ethiopia to 51 % in Swaziland(Reference Zlotnik32). In the present study, the acceptability of overeating and obesity in Bamiléké may be underlined by cultural traditions. Indeed, Bamiléké people perceive themselves and are perceived by other ethnic groups, as stout people with a traditionally plentiful and energetic diet due to their relative agricultural and economic productivity in the grassfields of West Cameroon and urban areas of the country(Reference Warnier33). By contrast with the Béti people, the Bamiléké people also displays a pronounced traditional preference for stoutness, reflected in many aspects of their social life, including fattening practices of future leaders and pubescent girls in preparation of marriage(Reference Fezeu, Assah and Balkau9), culinary habits with high consumption of palm oil(Reference Essomba, Edjenguèlè and Pasquet34–Reference Grimaldi, Leke and Borokini36) and sculptural art emphasising the power of leaders through the size of their belly.
As expected, the importance of the place of living in the prediction of EI and therefore the risk of obesity was shown. The longer individuals live in urban areas, the more likely their EI may increase their risk of having a higher BMI. These expected findings are in line with the nutrition transition phenomenon stating that increasing overweight and obesity prevalence is associated with a greater degree of urbanisation favouring obesogenic eating practices and sedentary behaviours(Reference Emamian, Fateh and Hosseinpoor37,Reference Akram, Ashraf and Ijaz38) . According to the dietary acculturation theory, migrations and environmental changes tend to progressively modify cultural norms and practices of affected people into those of the host society(Reference Satia-Abouta, Patterson and Neuhouser39–Reference Frisco, Martin and Van Hook41). In the present study, Beti and Bamiléké participants migrated to cities but following undoubtedly different dietary patterns, as shown by the difference observed in terms of energy intake and food consumption frequencies. In Béti and Bamiléké urban households, daily menus are composed of sauces, stews, meat, fish, complement, cereals, beverages and sandwiches(Reference Amougou, Cohen and Mbala30,Reference Essomba, Edjenguèlè and Pasquet34) . The rise in the homogenisation of foods and eating patterns in developing countries has been linked to urbanisation and the nutrition transition(Reference Siervo, Grey and Nyan42). In our study, although both ethnic groups are exposed to a similar urban food environment, the Bamiléké migrants have, contrary to the Béti, preserved their traditional way to prepare foods, with abundant palm oil, and the traditional plethoric way they eat to meet their social valorisation of overweight(Reference Cohen, Amougou and Ponty22). These results are consistent with those of Pasquet(Reference Marbou and Kuete8) who showed that although obesity is prevalent in all newly arrived migrants to Yaoundé, Bamiléké’s risk of obesity is found to outweigh that of Béti by a factor of three.
Socio-demographic factors are well-known predictors of overweight and obesity risks in sub-Saharan Africa(Reference Agyemang, Boatemaa and Frempong43,Reference Boatemaa, Badasu and Aikins44) . However, how these socio-demographic factors interact with ethnicity in the eating patterns in sub-Saharan Africa’s population was unclear. In the present study, the level of education was significantly associated with higher EI regardless of ethnicity, suggesting that post-secondary level of education is critical to obtain stable well-paid jobs in Cameroon(Reference Crosnoe45). This may lead individuals with high education to ensure their food security and more frequently consume energy-dense foods. Among studies that examined the direct influence of education on obesity, the results were inconsistent in sub-Sahara Africa. In Benin, women with secondary or higher education were about 60 % more likely to be obese than those with no formal education, and working women were 13% more likely to be obese compared to those who were not working(Reference Ziraba, Fotso and Ochako46). However, a study among Ibos in Nigeria by Anyanwu(Reference Anyanwu, Ekezie and Danborno47) observed a negative relationship between education and obesity. Other studies that used the level of education as a proxy of SES to predict obesity found that obesity rates were higher in rich compared with poorer households(Reference Fezeu, Minkoulou and Balkau48,Reference Olufunke and Chola49) . Association of ethnicity and EI was significantly higher in women than in men suggesting that obesity rates are higher among females than among males. In Cameroon, particularly in the Bamiléké ethnicity, women play a decisive role in the preparation and distribution of meals, and this daily proximity to food could explain the prevalence of obesity observed. This confirms a previous study in Africa(Reference Agyemang, Boatemaa and Frempong43) that recorded higher obesity prevalence among adult women.
In our study, being Bamiléké and married increases the likelihood of higher EI and of being overweight or obese. This result is in agreement with the Bamiléké tradition, spouses eat together and influence each other’s diet(Reference Guillermou50). Indeed, the marriage has a strong symbolic value in Cameroon, particularly in Bamiléké ethnicity, it is a passage where it is necessary to demonstrate success in the household, in particular by gaining weight(Reference Cohen, Gradidge and Ndao12). Other studies in Africa found that individuals who were married were nearly six times more likely to be obese compared with those who were never married(Reference Agyemang, Boatemaa and Frempong43). Our results indicated a negative association between the increase of age and EI. Previous studies in Africa have reported a positive association between age and obesity(Reference Mekonnen and Bogale51,Reference Adeloye, Ige-Elegbede and Ezejimofor52) . The discrepancy with our study may be associated with the fact that our results are based on the overall age. If we had structured by age class as done in the literature, surely we would have had the same results. Indeed, energy intake and body weight are shown to increase steadily with age, at least until around 50–60 years old, while later in the life course weight tends to decline, particularly after 65 years old(Reference Adams and Schoenborn53).
It was expected that the urban living duration would be strongly associated with EI, but not ethnicity, and this study showed that both predictors had the same level of associations with EI. This means that besides the rural–urban migration, other complementary factors, historically anterior to the nutritional transitional phenomenon (e.g. ethnicity), like different ‘starting conditions’ or cultural background, can shape and exacerbate its common effect on populations. Our results raise questions about the roles of the evolutionary origins of populations experiencing the global phenomenon of nutrition transition. The difference in food intake between the Bamiléké and Béti might reflect variation in life history traits such as growth rate, body size, reproductive scheduling and even life span(Reference Kuzawa and Bragg54). Much of this variation can be explained as the outcome of ethnicity-related phenotypic plasticity triggered in response to nutritional, social, demographic and other environmental conditions(Reference Chisholm, Quinlivan and Petersen55–Reference Walker, Gurven and Hill58). Public health authorities fighting obesity must consider this aspect and develop their intervention according to the anthropological specificities of populations.
There are some limitations to this study. The use of FFQ to assess the habitual intake of populations is still the subject of discussion in literature because the respondents are not well able to summarise their food intake over a longer period. An additional limitation is that we used a single administration of the 24-h recall to assess energy intake in participants. However, we have validated in our previous study that the GPPA can be used effectively in Cameroon to estimate food portion sizes in a single 24-h recall. In addition, the 24-h recall method, due to its precision and length, places a heavy burden on participants. The more we repeat the number of administrations of 24-h recall, the more we risk losing participants. On the other hand, we completed the single 24-h recall method with the FFQ to compensate for the lack of intrapersonal variability. Another limitation is that we have had to remove 35 % of our sample because of incomplete questionnaires from some participants. However, those who did not fully answer were not different socio-demographically from those who answered. Our GPPA with more than 250 foods requires motivated subjects and, therefore, places a heavy burden on participants. But these incomplete data on GPPA were not associated with specific socio-demographic profiles. Besides, our study participants were recruited from two out of five cultural regions which represent only 43 % of the entire Cameroonian population (Cameroon’s National Institute of Statistics). Future research including other large communities of the Cameroonian population may shed light on our results.
This study also has strengths. To our knowledge, our study is unique for some reasons. In the context of nutrition transition in Africa, our data allowed us to extend knowledge on the potential impact of anthropological differences amongst Cameroonian populations (Bamiléké and Béti) on variability in phenotypical responses to migration and obesogenic urban environments. The determinants of food intake were characterised, precisely the major contribution of the ethnic factor besides the well-known urban living duration commonly associated with dietary intake changes and obesity. Interestingly, education appears to predict EI independently of ethnicity. These new results provide new insights and perspectives highlighting the importance of taking into consideration anthropological and geographical factors when building prevention campaigns against obesity in Central Africa.
Acknowledgements
Thanks to Martin Fotso and we are indebted to the participants of the study.
This study is part of the ANTRAC project (Nutritional anthropology of Central African migrants to the urban area and France), led by the UMR 7206 and funded by the French National Agency for Research (ANR) between 2008 and 2012 (ANR-08-BLAN-0004). ANR had no role in the design, analysis or writing of this article.
N. A., P. P. and E. C. conceptualised and designed the study and the protocol of the field study. A. P. conducted the field study. N. A., E. C., J. Y. B., R. S. M. and P. P. analysed and interpreted the data. N. A. and E. C. drafted the manuscript. All authors revised the manuscript and provided important intellectual content. The study was co-supervised by N. A., M. F., P. P. and E. C. All authors read and approved the final manuscript.
All authors have no conflict of interest to declare.
Supplementary material
For supplementary material/s referred to in this article, please visit https://doi.org/10.1017/S0007114521003159


