


Growing evidence suggests dietary protein consumption above the current reference daily allowances (i.e. 0·75–0·8 g/kg per d in the UK and the USA(1,Reference Trumbo, Schlicker and Yates2) ) may confer metabolic benefits relating to healthy ageing and weight management, such as improved glycaemic control(Reference Phillips3–Reference Westerterp-Plantenga, Lemmens and Westerterp9). In parallel, increasing data are accumulating concerning the environmental cost of intensive animal-derived dietary protein production(Reference Ranganathan, Vennard and Waite10), resulting in shifting social attitudes and government initiatives towards more sustainable sources. As a consequence, the efficacy of non-animal-derived, sustainably produced dietary proteins to support glycaemic control and metabolic health is a pressing research focus.
Mycoprotein is a low-energy food source, rich in protein and fibre, derived from the continuous cultivation of the fungus Fusarium venenatum (Reference Finnigan11). For the production of an equivalent amount of edible protein, mycoprotein requires less water and land usage and has a reduced carbon footprint when compared with meat and dairy products(Reference Hoekstra12–Reference Coelho, Monteyne and Dunlop14), positioning it as a sustainable alternative protein source.
Previous work has shown that the ingestion of a single mycoprotein-rich meal in combination with an oral glucose tolerance test (OGTT) results in reduced postprandial glycaemia and insulinaemia compared with isonitrogenous and isoenergetic control meals(Reference Turnbull and Ward15,Reference Bottin, Swann and Cropp16) . The careful matching of nutritional conditions in these studies suggests that mycoprotein was either delaying intestinal glucose absorption or improving postprandial (peripheral) glucose uptake, with either effect plausibly linked to the amino acid composition or fibre content (and type) contained within mycoprotein. We have recently shown that protein digestion and amino acid absorption following mycoprotein ingestion are sustained during the acute postprandial period, highlighting the potential of this alternative protein source to modulate glycaemic control(Reference Dunlop, Kilroe and Bowtell17). However, whether these findings translate to habitual mycoprotein consumption improving physiologically relevant, longer-term changes in insulin sensitivity (IS) and/or glycaemic control have not been investigated.
Studies that have investigated the incorporation of mycoprotein into the habitual diet (20–60 g dry weight per d for 3–8 weeks using either fully controlled or supplemented free-living nutritional interventions) have reliably shown a 0·4–0·8 mmol/l lowering of blood cholesterol concentrations and improvements in LDL:HDL ratios in healthy and hypercholesterolaemic individuals(Reference Turnbull, Leeds and Edwards18,Reference Turnbull, Leeds and Edwards19) . These studies designed the nutritional interventions in an energy- and macronutrient-matched manner, and therefore, the higher fibre content of the mycoprotein conditions is probably the causative factor (27–39 g/d in the mycoprotein-based diets v. 25–27 g/d in the control diets).
In the present study, we applied a 1-week fully controlled dietary intervention in healthy young adults where the major source of dietary protein at lunch and dinner was obtained from meat and fish (control group, CON) or from mycoprotein (intervention group, MYC) with energy and macronutrient (except fibre) content of the diets matched. We hypothesised that 1 week of mycoprotein consumption would improve whole-body IS and 24 h free-living glycaemic control. We also applied a novel, targeted NMR-based quantitative metabonomics approach of 224 relevant metabolites that has been epidemiologically validated as a biomarker of IS(Reference Del Coco, Vergara and De Matteis20) and would allow further insight as to the impact upon metabolic profile of mycoprotein consumption.
Subjects and methods
Participants and medical screening
Twenty healthy, recreationally active, young adults (age 24 (sem 1) years; BMI: 23 (sem 1) kg/m2; male = 8 and female = 12) participated in the present study. Subjects’ characteristics are presented in Table 1. Prior to participating, each subject attended a screening visit to ensure eligibility. Blood pressure, body mass, height and body composition (determined by air displacement plethysmography; Bodpod; Life Measurement, Inc.) were measured at screening. The participants also completed a general health questionnaire and the International Physical Activity Questionnaire(Reference Craig, Marshall and Sjorstrom21). Vegetarians, vegans, smokers and participants taking regular medication or suffering from chronic diseases were excluded. Participants regularly consuming >2·5 or <0·8 g/kg of protein per d were also excluded. Participants included were recreationally active (partook in regular exercise or sport at a non-competitive level, 2–5 d a week), were normotensive and had a BMI between 18·5 and 30 kg/m2. Half of the female participants (6/12) were taking hormonal contraceptives. When this was not the case, female participants were tested (and their habitual data collected) during the follicular phase of their menstrual cycle, to control for cycle variations in glucose and insulin responses(Reference Brennan, Feltrin and Nair22). All participants were informed of the study’s purposes, procedures and risks and provided written informed consent. The study was conducted at the Nutritional Physiology Research Unit, Department of Sport and Health Sciences, St. Luke’s Campus, University of Exeter, between January and December of 2017, and it was approved by the University of Exeter’s Sport and Health Sciences Ethics Committee (reference no. 161026/B/07) in accordance with the Declaration of Helsinki and registered at ClinicalTrials.gov (NCT02984358).
Table 1. Participants’ characteristics*
(Mean values with their standard errors; ranges)
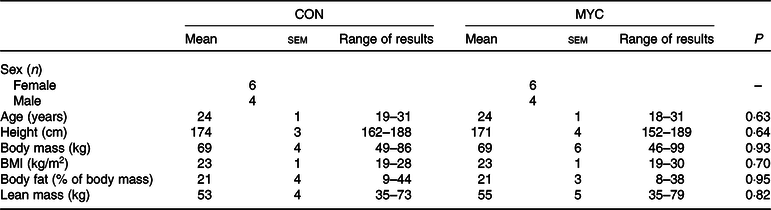
CON, control group; MYC, mycoprotein group.
* Multiple t tests were used to compare each characteristic in CON and MYC.
Experimental protocol
The present study was a randomised, controlled, parallel-design trial, with participants being randomly allocated into one of two dietary interventions which differed with respect to the primary source of dietary protein consumed: meat/fish-derived dietary protein (CON; n 10) or mycoprotein (MYC; n 10). Participants were allocated sequential numbers at the time of screening which were then used as the only identifiable characteristic for all documents containing participant information and were randomised into groups using an online randomiser (http://www.randomization.com/), with stratification by sex. Fig. 1 shows an overview of the study design. All subjects underwent a period of habitual data collection as well as data collection during their allotted intervention.
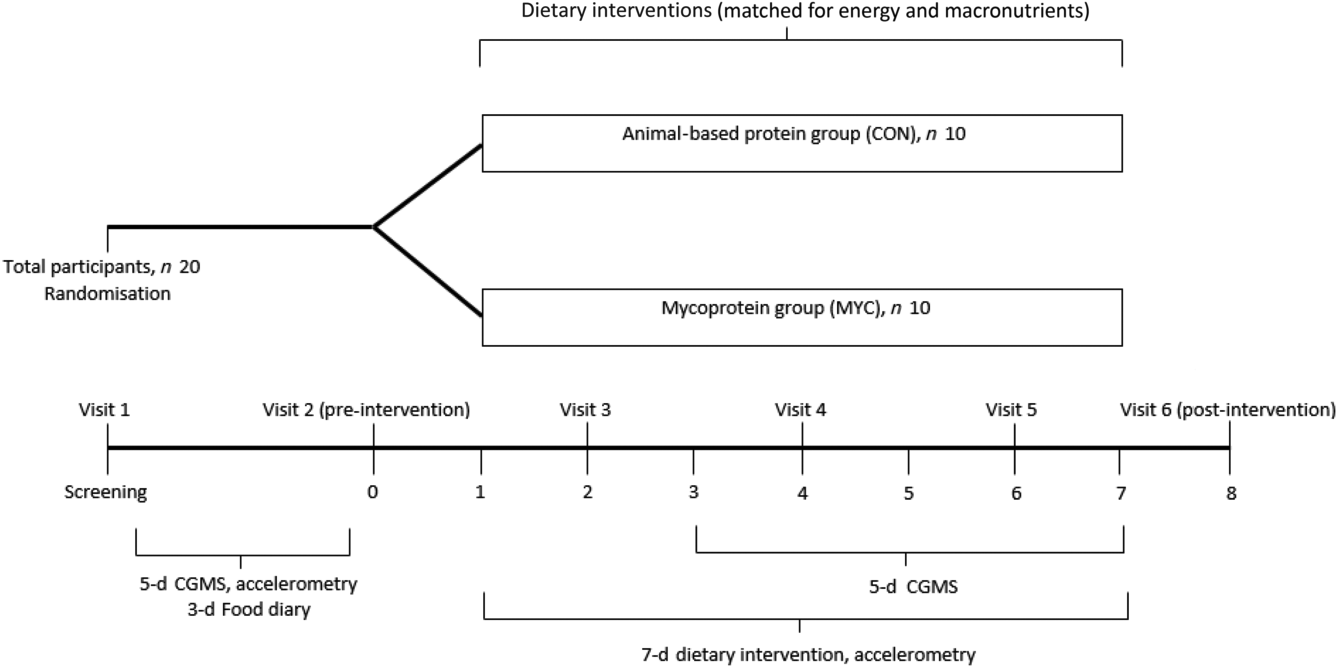
Fig. 1. Overview of the experimental protocol. CGMS, continuous glucose monitoring system.
Habitual data collection
Habitual data collection took place either during the 2 weeks before (CON; n 7, MYC; n 7) or between 2 and 8 weeks following (CON; n 3, MYC; n 3) the experimental period. Subjects were asked to complete a 3-d food diary to assess their habitual dietary intake, following consultation with a qualified nutritionist concerning how to complete this in as much detail as possible. All food and drink consumed were recorded for three consecutive days, including two weekdays and one weekend day. The diaries were analysed for energy and macronutrient content using Nutritics (Nutritics Professional Nutritional Analysis Software). Participants wore a GENEActiv Original accelerometer (ActivInsights), a wrist-worn device to measure daily physical activity by intensity, on their non-dominant wrist, for five consecutive days (including both week and weekend days). Physical activity data from the GENEActiv monitors were processed using GENEActiv excel macros. The 5 d of habitual physical activity data were compiled into an individual average for each participant and the same was done for the 7 d of the intervention. Glucose sensors were placed subcutaneously at the side of the abdomen and connected to a continuous glucose monitoring system (Dexcom G4 Platinum) to measure interstitial glucose concentrations (calibrated to blood glucose concentrations measured via finger prick four times per d) every 5 min for the same 5 d as those where accelerometry data were collected. During all habitual data collections, participants were instructed not to change their normal routines.
Experimental test days
Participants reported to the laboratory at about 08.00 hours on day 0 (prior to starting the dietary intervention) and on day 8 (the morning following the intervention) after an overnight fast and refraining from intense exercise and alcohol consumption for at least 24 h, to undertake two identical experimental test days. A cannula was placed retrogradely in a dorsal hand vein and the hand was then placed in a heated box (55°C) for arterialised venous blood sampling before a fasted arterialised-venous blood sample was collected(Reference McGuire, Helderman and Tobin23). Fasted measurements of oxygen consumption (V˙O 2 ) and carbon dioxide production (V˙CO 2 ) were collected using a facemask and the Metamax 3B (MM3B) portable indirect calorimetry system (Cortex) for 30 min. Carbohydrate (CHO) and fat oxidation rates, as well as RMR, were calculated using the Frayn equations(Reference Frayn24). Subsequently, an OGTT was performed. Briefly, participants ingested 75 g glucose (dextrose; BulkPowders) dissolved in 350 ml water in 5 min or less (with the exact time being recorded for each participant in the first visit and replicated on the last test day). Arterialised venous blood samples were then collected for a 2 h period at 15 min intervals for the measurement of glucose and insulin concentrations and the subsequent calculation of glucose tolerance and IS. Indirect calorimetry was performed throughout the OGTT period with the exception of the first 15 min following glucose ingestion.
Dietary intervention
BMR was estimated using the Henry equations based on age, sex and weight(Reference Henry25). The International Physical Activity Questionnaire was used to calculate a physical activity level factor(Reference Westerterp26). Individual energy requirements were then calculated by multiplying the participant’s BMR and physical activity level. Thereafter, an individual 7-d meal plan was designed for each participant with all food prepared, weighed and packaged in-house in the department’s research kitchen facility. Nutritional information for the two diets is provided in Table 2. Subjects consumed a diet containing 1·2 g of protein per kg of body weight per d (in order to reflect an average UK diet(Reference Bates, Lennox and Prentice27)), with 30 % of their energy being provided by fat and the remainder from CHO (about 50–55 %; variation due to different energy requirements and the clamping of protein intake). The meals were identical between the two groups, aside from meat or fish providing the primary protein source in lunches and dinners for the CON group (n 10) and this being replaced by Quorn Foods™ products (to provide the required amount of mycoprotein) in the MYC group (n 10). The CON group consumed meals based on chicken, ham, beef, tuna and salmon. In the MYC group, this was substituted for Quorn chicken pieces, Quorn mince, Quorn fillets and Quorn roast chicken slices. An additional line of interest was the impact of the mycoprotein diet on plasma SCFA concentrations. Acetate, for example, can be produced not only from gut microbial fermentation of dietary fibre (with the mycoprotein diet being high in dietary fibre) but also from hepatic metabolism of alcohol(Reference Korri, Nuutinen and Salaspuro28). To isolate the impact of the diet, we therefore chose not to provide any alcohol during the intervention and required participants to abstain from alcohol for 24 h prior the start of the intervention. All participants reported adhering to these guidelines. A document and diary detailing the plan were provided to the subjects in order to track compliance to the dietary intervention, log meal times and provide recipe information/instructions. While no formal data concerning tolerability and dietary preferences/liking were collected during the intervention, subjects informally reported no particular disliking of any foods, nor any adverse events (e.g. gastrointestinal, nausea, etc.), and compliance and feedback were similar across groups.
Table 2. Nutritional composition of participants’ habitual diets, of the prescribed intervention diet and of their actual intake during the intervention according to the collected logs during the 1-week intervention‡
(Mean values with their standard errors)
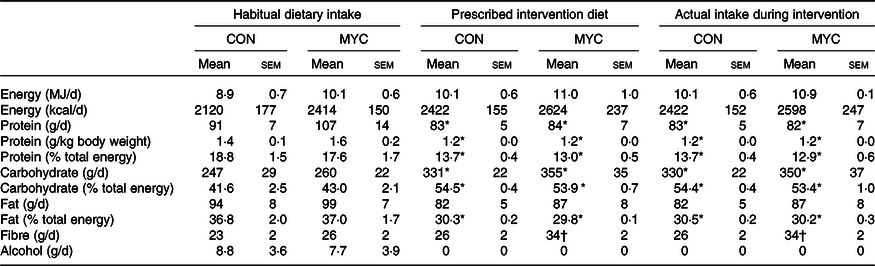
CON, control group; MYC, mycoprotein group.
* Significantly different from habitual diet (time effect; P < 0·05).
† Significantly different from habitual diet and from CON group (time and interaction effect; P < 0·05).
‡ Separate two-way repeated-measures ANOVA were used to compare CON and MYC actual dietary intakes during the intervention with both the habitual diets and the prescribed intervention diets.
Participants were required to visit the laboratory at about 08.00 hours in the fasted state on days 2, 4 and 6 where body mass was measured wearing light clothing (seca 703 column scale; Seca) and the next 2 d of food were provided. In these interim visits, the researchers discussed with the participants any questions or issues that may have arisen, and in the event of any substantial weight change (>0·5 kg, with the same upward or downward trend on two consecutive visits) the energy content of the next 2 d was adjusted. The GENEActiv accelerometer was worn for the duration of the 1-week intervention, and on day 2, a glucose sensor was placed and the continuous glucose monitoring system connected to collect continuous glucose data for the last 5 d of the intervention. Following the 1-week intervention (i.e. day 8), participants were required to repeat the experimental test day where a further OGTT was performed as described above.
Plasma and serum collection and analyses
From each blood sample, 1 ml was collected into FX blood collection tubes (Becton Dickinson) containing powdered sodium fluoride and potassium oxalate, and glucose was immediately analysed using the YSI 2300 STAT PLUS Biochemistry Analyser (YSI). A quantity of 4 ml of blood was collected into lithium heparin plasma tubes (Becton Dickinson) and immediately centrifuged. The remaining 4 ml of each blood sample were collected into SST tubes (containing spray-coated silica and a polymer gel for serum separation; Becton Dickinson) and left at room temperature for at least 30 min. All tubes were centrifuged at 4°C and 4000 rpm, and aliquoted (one aliquot designated for each of the below analyses) plasma and serum were stored at –80°C.
One aliquot of each postabsorptive serum sample was transported to the Clinical Chemistry department of the Royal Devon and Exeter NHS Foundation Trust and analysed for uric acid concentrations using the Roche Cobas 702 module of the Cobas 8000 analyser (Roche) and Roche Uric Acid Kits (Cobas; UA2). Insulin concentrations were analysed in serum samples using DRG ELISA kits (DRG International). IL-6 concentrations were measured in plasma samples using Quantikine ELISA kits (R&D Systems).
Plasma samples were also sent to the MRC Integrative Epidemiology Unit at the University of Bristol for metabolomics analysis by NMR spectroscopy. NMR spectroscopy and MS are the key technologies in the metabolomics field; however, MS cannot analyse lipoproteins, making NMR currently the only high-throughput methodology capable of quantifying these metabolites in a cost-effective manner(Reference Soininen, Kangas and Würtz29). Biomarker concentrations quantified by this NMR approach have been shown to be highly consistent with concentrations obtained from standardised clinical chemistry analyses(Reference Würtz, Kangas and Soininen30). The experimental protocol, including sample preparation and NMR spectroscopy, has been previously described in detail(Reference Soininen, Kangas and Würtz29–Reference Soininen, Kangas and Würtz31). The data were then processed using the Nightingale Health’s NMR-based blood biomarker analysis platform, which provides 224 quantified metabolomic measures per sample (142 primary concentrations plus eighty-two selected ratios and molecule diameters), including the lipid concentrations and composition of fourteen lipoprotein subclasses, fatty acids, amino acids, glycolysis-related measures and ketone bodies. This approach has previously been used to establish large-scale and cross-sectional plasma lipid metabolic profiles of more metabolically compromised populations compared with healthy controls(Reference Deelen, Kettunen and Fischer32,Reference Hart, Vogelzangs and Mook-Kanamori33) but its use in human nutrition trials is a novel application as, to date, NMR spectroscopy has rarely been applied to investigate changes in response to nutritional interventions(Reference Beynon, Richmond and Santos Ferreira34).
Insulin sensitivity
Five different IS indices(Reference Matthews, Hosker and Rudenski35–Reference Mari, Pacini and Murphy39), all validated against the hyperinsulinaemic–euglycaemic clamp technique, were calculated pre- and post-intervention using the blood glucose and serum insulin concentrations measured in the fasting state and during the OGTT. The homeostatic model assessment of insulin resistance is calculated from solely fasting concentrations of glucose and insulin and has been shown to provide a reasonable estimate of hepatic IS(Reference Matthews, Hosker and Rudenski35). The Matsuda index uses OGTT glucose and insulin concentrations, as well as their corresponding fasting values, and represents a combined estimate of both hepatic and peripheral tissue sensitivity(Reference Matsuda and DeFronzo37). The Cederholm, oral glucose insulin sensitivity (OGIS) and Gutt indices focus mainly on peripheral IS and muscular glucose uptake by measuring OGTT glucose clearance(Reference Cederholm and Wibell36,Reference Gutt, Davis and Spitzer38,Reference Mari, Pacini and Murphy39) .
Continuous glucose monitoring system
The Dexcom G4 Platinum continuous glucose monitoring system sensor was placed in the participants’ abdominal subcutaneous fat, using a dedicated applicator. A transmitter was then attached to the sensor and glucose data, collected every 5 min, were automatically sent to a receiver. The participants were instructed to carry the receiver at all times and to calibrate the monitor four times a day at regular intervals by pricking their fingers with disposable lancets and using Contour Next blood glucose meters (Bayer). Data from the days when the sensor was inserted and removed were excluded (i.e. days 2 and 8). Days with data for fewer than 70 % of the total time points were also excluded. The remaining data were analysed for glycaemic control (24 h average glucose, glucose AUC and 2-h postprandial glucose) and for glycaemic variability (sd, continuous overlapping net glycaemic action (CONGA)1 and CONGA2). To calculate the CONGA1 and CONGA2 indices, the sd of the differences between each glucose concentration reading and the reading obtained 1 (CONGA1) or 2 (CONGA2) hours prior was determined(Reference McDonnell, Donath and Vidmar40).
Statistical analyses
A power analysis based on the assumption of a 12 % increase in the Matsuda Index with mycoprotein consumption (calculated based on previous research(Reference Turnbull and Ward15)) was performed and determined that eight participants were needed in each group to provide a power of 80 % and a 95 % CI. Ten participants per group were recruited to account for a potential 20 % dropout rate. Recruitment and testing were ended once the trial was fully recruited according to the prior power calculation.
All data are expressed as mean values with their standard errors. Participant baseline characteristics, dietary intake and physical activity data were analysed using multiple unpaired t tests. The two groups were compared, for most parameters, using a two-way ANOVA with repeated measures (with condition and time (repeated measures) as factors). Bonferroni post hoc tests were performed in the event of significant main effects to detect individual differences. Blood glucose and serum insulin concentrations during the pre- and post-intervention OGTT were analysed with three-way ANOVA (condition, time and test day as factors). Additionally, for the aforementioned parameters, incremental AUC was calculated and a one-way ANOVA was performed to detect any significant effect of treatment. CHO and fat oxidation data were averaged as fasting and fed responses and analysed with three-way ANOVA (condition, fasted or fed state, and test day as factors). For the NMR metabolomics measures, a % change (Δ) from pre- to post-intervention was calculated for each of the 224 metabolites for each participant. The measures were divided into three groups (concentrations, ratios and dimensions) and analysed using multiple t tests for the dimension measures (n 3) and using significant analysis of microarrays for the concentration and ratio measures (n 142 and n 79, respectively). A heat map was designed for the significant metabolites and these were organised into clusters. As an internal validation, a Bland–Altman plot and a Pearson correlation were used to analyse the agreement between the YSI and metabolomics fasting glucose data. Missing data were handled using imputation in a linear interpolation manner. Statistical significance was set at P < 0·05. For the significant analysis of microarrays analysis, the delta (tuning parameter which determined the false discovery rate threshold) was set at 1 for the analysis of metabolomics ratios, resulting in a false discovery rate of 0·131 and at 0·8 for metabolite concentrations, resulting in a false discovery rate of 0·095. A false discovery rate of 0·1 was set for metabolite dimensions analysis. NMR metabolomics calculations were carried out in MetaboAnalyst 4.0 (Wishart Research Group, University of Alberta). All other calculations were performed using GraphPad Prism version 7.0 (GraphPad Software).
Results
Nutritional intervention
Body mass was not different between habitual testing and at the outset of the intervention in either group (from 69 (sem 4) to 70 (sem 4) in CON and 69 (sem 6) to 70 (sem 6) kg in MYC; P > 0·05), nor did body mass change during the intervention in either group (70 (sem 4) and 70 (sem 6) kg post-intervention in CON and MYC, respectively; P > 0·05) indicating participants remained in energy balance throughout the entirety of the study period in both groups.
The nutritional content of the prescribed diets, the actual food consumed during the intervention according to food logs and participants’ habitual diets are summarised in Table 2. Prescribed diets and actual food consumed did not differ in any parameter, and so all other comparisons were made using the habitual and actual intervention diets only. There were no significant differences in the energy and fat intakes between the groups’ habitual diets (both P > 0·05) nor did these parameters change between habitual intake and during the intervention in either group (all P > 0·05). Additionally, there were no significant differences in the CHO and protein intakes between the groups’ habitual diets nor between the groups’ intervention diets (all P > 0·05), but there was a reduction in protein intake and an increase in CHO intake from their habitual diets to the intervention in both groups (time effect P < 0·05). Although fibre intake was not different between groups (group effect; P > 0·05), significant time and interaction effects were detected (P < 0·05), such that fibre intake increased by 31 (sem 2) % in the MYC group only (P < 0·05). The MYC group consumed 215 (sem 16) g of Quorn products daily, corresponding to 181 (sem 13) g wet weight (45 (sem 3) g dry weight) of mycoprotein per d. In the CON group, 38 (sem 1) and 6 (sem 1) % of the total protein consumed was provided by meat and fish, respectively, and in the MYC group, 38 (sem 2) % was provided by Quorn products. Dairy products provided 13 (sem 1) % of protein in the CON group and 15 (sem 2) % in the MYC group (P > 0·05), and 32 (sem 1) % and 36 (sem 2) % of protein in the CON and MYC groups, respectively, came from non-animal sources (not including mycoprotein; P > 0·05). The remaining portion of dietary protein was provided by mixed (plant and animal) sources (e.g. chocolate bars, porridge oat pots, cakes, etc.).
Physical activity
Physical activity data are shown in Table 3. Habitual physical activity was not different between CON and MYC groups when expressed as average daily total activity time, light activity, moderate activity, vigorous activity or sedentary time (all P > 0·05). None of the physical activity parameters changed during the intervention when compared with habitual levels in either group (all P > 0·05).
Table 3. Daily habitual physical activity and daily physical activity during the intervention*
(Mean values with their standard errors)
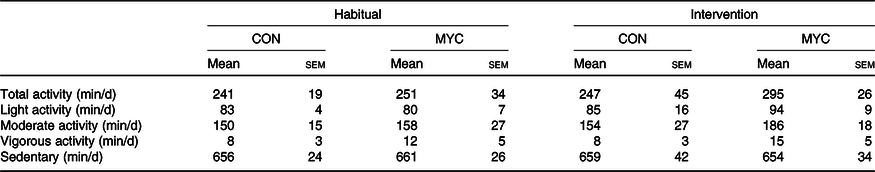
CON, control group; MYC, mycoprotein group.
* Multiple two-way ANOVA was used to compare the different activity levels in CON and MYC habitually and during the intervention.
Insulin sensitivity
Fasting blood glucose and serum insulin concentrations did not differ between groups at baseline (both P > 0·05) and fasting serum insulin concentrations did not change throughout the intervention in either group (from 14·8 (sem 1·1) to 14·2 (sem 1·7) and from 12·3 (sem 2·4) to 12·7 (sem 1·7) mU/l in CON and MYC, respectively; P > 0·05). Pre- and post-intervention fasting blood glucose concentrations displayed a strong trend for an interaction effect (from 4·41 (sem 0·08) to 4·58 (sem 0·06) mmol/l, and from 4·55 (sem 0·11) to 4·47 (sem 0·07) mmol/l in CON and MYC, respectively; P = 0·05). Despite this, baseline IS reflected by the homeostatic model assessment of insulin resistance was not different between groups (2·9 (sem 0·2) and 2·7 (sem 0·5) in CON and MYC, respectively; P > 0·05) and did not change during the intervention in either group (P > 0·05). Blood glucose and serum insulin concentrations during the two OGTT performed pre- and post-intervention in the CON and MYC groups are shown in Fig. 2. Both parameters increased with CHO ingestion (P < 0·0001) and peaked between 30 and 45 min of the OGTT, at around 8 mmol/l and 100 mU/l for blood glucose and serum insulin concentrations, respectively, with no differences detected over time or between groups (P > 0·05 for interaction and group effects). Blood glucose incremental AUC and serum insulin incremental AUC during the OGTT (displayed in Fig. 2) also did not differ between groups or over time (both P > 0·05). Consequently, there were also no differences between groups at baseline or over the intervention for any of the OGTT-derived calculations of IS (P > 0·05 for Cederholm, Matsuda, Gutt and OGIS). Fig. 3 displays these four indices and homeostatic model assessment of insulin resistance for the two time points in the two groups.
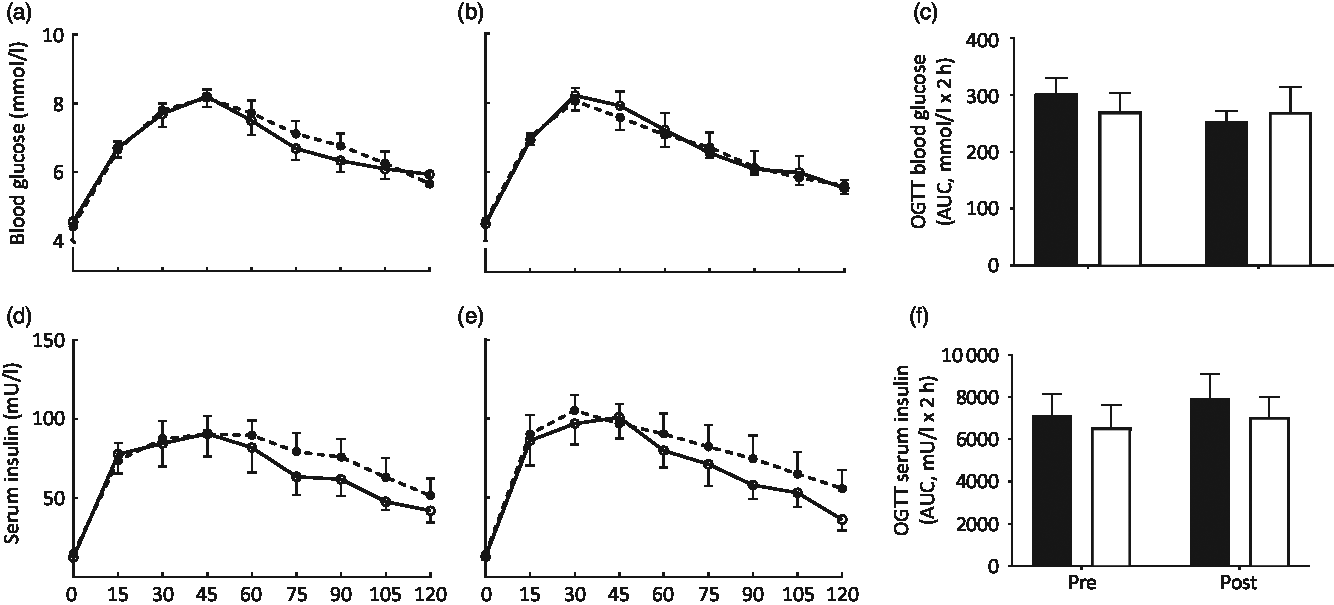
Fig. 2. Blood glucose (a–c) and serum insulin (d–f) concentrations during oral glucose tolerance tests (OGTT) on days 0 (a and d) and 8 (b and e) of a fully controlled dietary intervention with either a meat-based diet (control; CON) or a mycoprotein-based diet (MYC). Values are means, with standard errors represented by vertical bars. OGTT data were analysed using three-way ANOVA. Incremental AUC data were analysed using one-way ANOVA. There was a significant effect of carbohydrate ingestion for blood glucose and serum insulin (P < 0·0001). No interaction effects or main effects of condition or time were found (all P > 0·05). For both blood glucose incremental AUC and serum insulin incremental AUC, no statistically significant main effects of time or condition (both P > 0·05), as well as no interaction effects (P > 0·05) were found. (a, b, d, e) ![]() , CON;
, CON; ![]() , MYC; (d, f)
, MYC; (d, f) ![]() , CON;
, CON; ![]() , MYC.
, MYC.
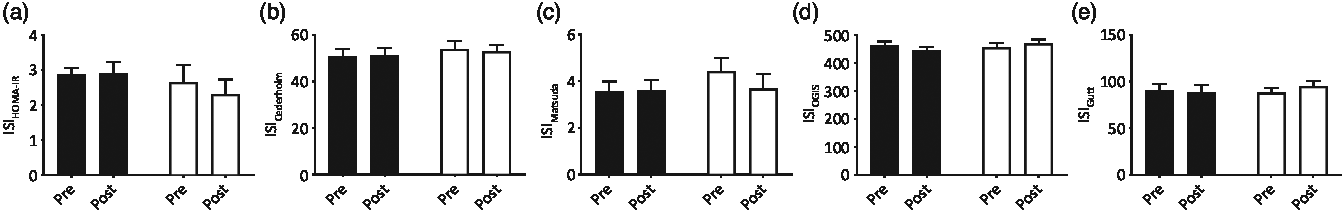
Fig. 3. Insulin sensitivity indices (ISI) (a: homeostatic model assessment of insulin resistance (HOMA-IR), b: Cederholm, c: Matsuda, d: oral glucose insulin sensitivity (OGIS), e: Gutt) calculated with the blood glucose and serum insulin concentrations measured fasting and during oral glucose tolerance tests (OGTT) pre and post a 1-week fully controlled dietary intervention with either a meat-based diet (control; CON) or a mycoprotein-based diet (MYC). Values are means, with standard errors represented by vertical bars. There were no differences between groups at baseline for any of the OGTT calculated insulin sensitivity indices (all P > 0·05) and no changes resulted from the intervention (time and interaction effects; all P > 0·05). ![]() , CON;
, CON; ![]() , MYC.
, MYC.
Continuous glucose monitoring system
Average daily glucose values were aggregated for the habitual data (5·5 (sem 0·1) mmol/l in CON and 5·4 (sem 0·1) mmol/ in MYC) and for each of the intervention days, in the two groups (5·5 (sem 0·1), 5·5 (sem 0·2), 5·3 (sem 0·2), 5·4 (sem 0·1) and 5·4 (sem 0·1) mmol/l in CON and 5·7 (sem 0·2), 5·5 (sem 0·1), 5·4 (sem 0·2), 5·3 (sem 0·2) and 5·6 (sem 0·1) mmol/l in MYC, for days 3–7 of the intervention, respectively). Habitual data demonstrated no differences between groups (P > 0·05) and this did not change throughout the intervention (P > 0·05, for time and interaction effects). No differences were found between groups during the intervention in the average glucose concentrations in the 2-h postprandial period after the participants’ evening meal (6·3 (sem 0·2), 6·1 (sem 0·4), 5·5 (sem 0·2), 5·3 (sem 0·2) and 5·5 (sem 0·2) mmol/l in CON, and 6·0 (sem 0·3), 5·9 (sem 0·2), 5·6 (sem 0·2), 5·9 (sem 0·2) and 6·1 (sem 0·2) mmol/l in MYC, for days 3–7 of the intervention, respectively; P > 0·05 for time and for interaction effects). There were also no differences in glycaemic variability between groups, expressed as sd, CONGA1 or CONGA2 (all P > 0·05).
Indirect calorimetry
There were no differences in RMR between groups before the intervention (6439 (sem 477) kJ (1539 (sem 114) kcal) in CON and 7079 (sem 498) kJ (1692 (sem 119) kcal) in MYC; P > 0·05), and there were no main effects of time, condition or an interaction effect (all P > 0·05). An effect of CHO ingestion was detected for both CHO (increasing) and fat (decreasing) oxidation rates (P < 0·0001). No interaction or condition effects were found (all P > 0·05). The relative contribution of fat and CHO oxidation to total energy expenditure in both the fasted and fed state are displayed in Fig. 4.
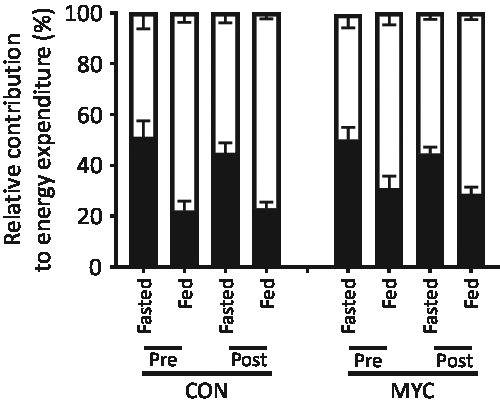
Fig. 4. Relative contribution of fat and carbohydrate (CHO) oxidation rates to energy expenditure calculated via indirect calorimetry using the Frayn equations, in the fasted and CHO-fed states, pre and post a 1-week fully controlled dietary intervention with either a meat-based diet (control; CON) or a mycoprotein-based diet (MYC). Values are means, with standard errors represented by vertical bars. An effect of CHO ingestion was found for both CHO and fat oxidation rates (P < 0·0001). No interaction or condition effects were found (all P > 0·05). ![]() , CHO;
, CHO; ![]() , fat.
, fat.
Plasma IL-6 and serum uric acid concentrations
Fasting plasma IL-6 concentrations did not differ between groups at baseline (P > 0·05) and did not change throughout the intervention in either group (from 1·7 (sem 0·6) to 1·4 (sem 0·6) pg m/l, and from 2·1 (sem 0·6) to 1·3 (sem 0·4) pg m/l in CON and MYC; P > 0·05 for time and interaction effects). Fasting serum uric acid concentrations were 297 (sem 20) µmol/l in the CON group and 260 (sem 13) µmol/l in the MYC group at baseline (P > 0·05) and remained constant in both groups throughout the study (main effects of time, condition and interaction; all P > 0·05).
NMR-based metabolomics
The 224 metabolites measured by NMR metabolomics are listed in online Supplementary Table S1. No differences between groups were found for 171 (ninety-three concentrations, seventy-six ratios and two dimensions) of the quantified targets. Fig. 5 and Table 4 summarise the significant changes found in fifty-three of the targets (forty-nine concentrations, three ratios and one dimension). Forty-five lipid concentrations of different lipoprotein fractions (including VLDL, LDL, intermediate-density lipoprotein (IDL) and HDL) remained largely unchanged in the CON group (0–11 % change) but decreased significantly in the MYC group (7–27 % decrease; all P < 0·05). Plasma free cholesterol concentrations decreased by 4·00 (sem 0·03) % in the CON group (from 0·89 (sem 0·06) to 0·86 (sem 0·07) mmol/l) but by significantly more (13·99 (sem 0·03) %) in the MYC group (from 0·75 (sem 0·07) to 0·64 (sem 0·06) mmol/l; P < 0·05) and, similarly, total (including VLDL, LDL, IDL and HDL) plasma cholesterol concentrations decreased by 5·23 (sem 0·03) % in the CON group (from 3·00 (sem 0·19) to 2·86 (sem 0·25) mmol/l) but to a significantly greater degree (by 14·28 (sem 0·03) %) in the MYC group (from 2·50 (sem 0·26) to 2·12 (sem 0·22) mmol/l; P < 0·05). Plasma LDL-cholesterol concentrations decreased by 2·55 (sem 0·07) % in the CON group (from 0·88 (sem 0·09) to 0·85 (sem 0·11) mmol/l) but to a greater degree, 19·33 (sem 0·07) %, in the MYC group (from 0·71 (sem 0·13) to 0·56 (sem 0·11) mmol/l; P < 0·05) and plasma HDL2-cholesterol decreased by 11·03 (sem 0·02) % in the CON group (from 0·91 (sem 0·08) to 0·82 (sem 0·08) mmol/l) but by 18·58 (sem 0·03) % in the MYC group (from 0·72 (sem 0·07) to 0·58 (sem 0·05) mmol/l; P < 0·05). DHA and n-3 fatty acids concentrations decreased by 3·04 (sem 0·05) % (from 0·110 (sem 0·014) to 0·107 (sem 0·015) mmol/l) and 2·78 (sem 0·05) % (from 0·30 (sem 0·02) to 0·29 (sem 0·03) mmol/l) in the CON group and by 17·26 (sem 0·03) % (from 0·085 (sem 0·009) to 0·070 (sem 0·008) mmol/l) and 17·53 (sem 0·05) % in the MYC group (from 0·24 (sem 0·03) to 0·20 (sem 0·02) mmol/l), respectively (both P < 0·05). HDL dimensions decreased by 1·26 (sem 0·00) % in MYC but only by 0·17 (sem 0·00) % in CON (P < 0·05). Interestingly, plasma glucose remained unchanged in the CON group (from 3·8 (sem 0·1) to 3·8 (sem 0·0) mmol/l) but was reduced by 4·49 (sem 0·00) % (from 3·8 (sem 0·1) to 3·6 (sem 0·1) mmol/l) in MYC, and plasma acetate concentrations increased by 8·5 (sem 0·1) % (from 0·055 (sem 0·005) to 0·059 (sem 0·006) mmol/l) and 43·6 (sem 0·1) % (from 0·059 (sem 0·005) to 0·083 (sem 0·008) mmol/l) in CON and MYC, respectively. These changes were not significant using the significant analysis of microarrays multivariate analyses but were significant when individually analysed (t tests, P < 0·05) which we deemed appropriate given their lack of involvement in the recognised pathways that the remainder of the metabolomics significant analysis of microarrays analyses took into account. Changes in plasma total cholesterol, free cholesterol, LDL-cholesterol, HDL2-cholesterol, DHA, n-3 fatty acids, acetate and glucose concentrations are represented in Fig. 6. A Bland–Altman analysis was performed in order to verify the trend for a decrease in blood glucose concentrations determined by YSI against the significant change in NMR-derived analyses of plasma glucose in the MYC group. This also served as a verification of the robustness of the NMR-based metabolomics approach. The Bland–Altman plot to analyse the levels of agreement between the YSI and metabolomics glucose data is represented in Fig. 7. There was a strong positive correlation between the two measurements (r 0·60; P < 0·001; 95 % limits of agreement: from 0·287 to 1·216).
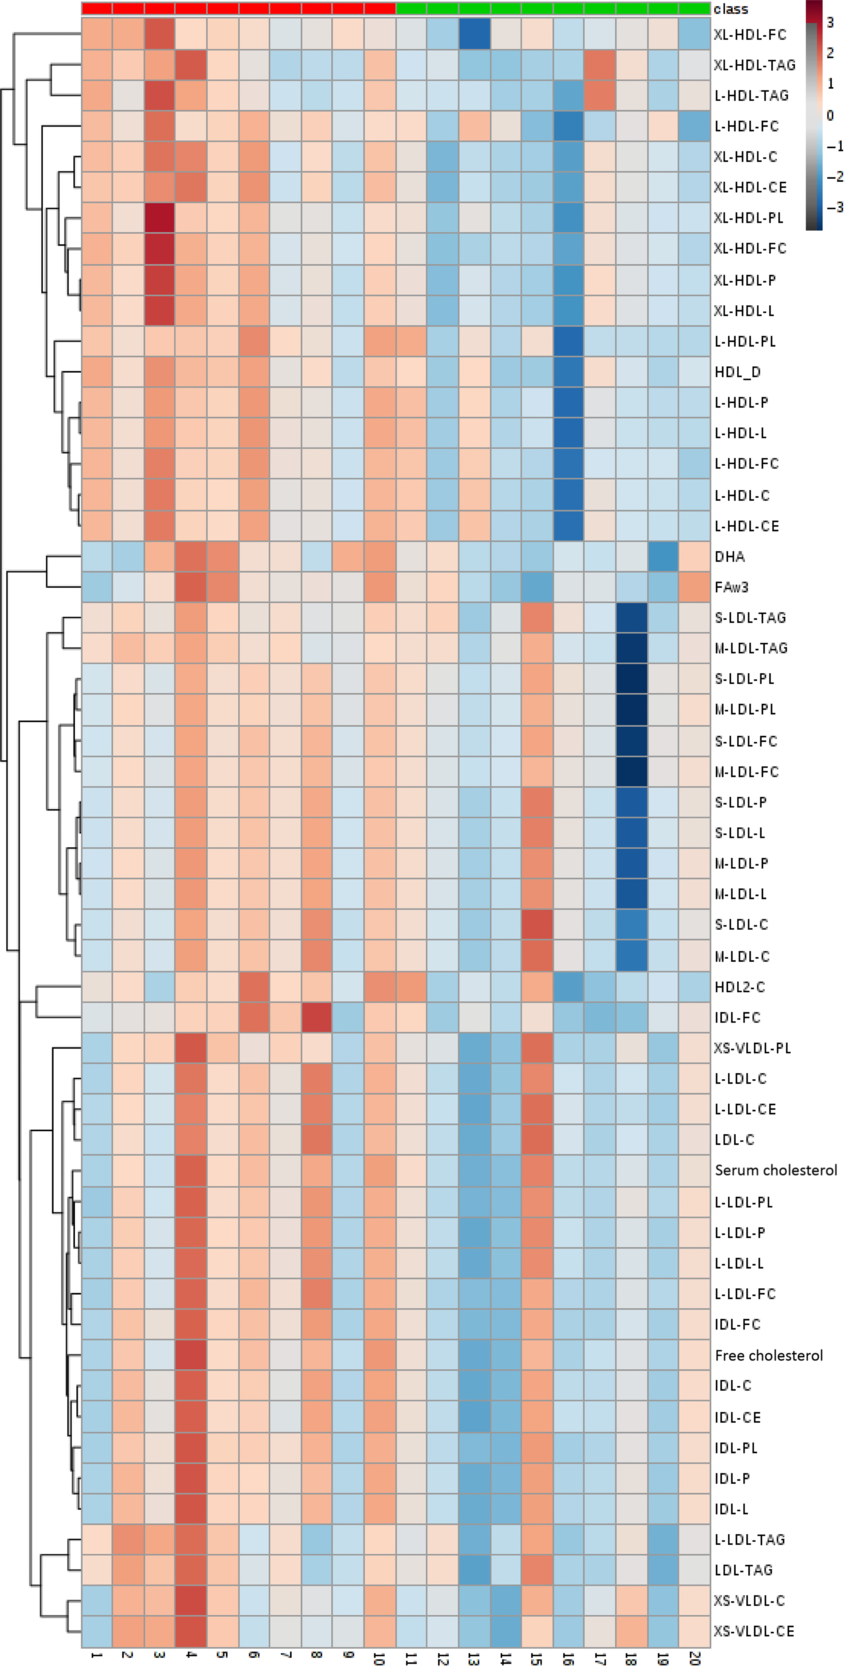
Fig. 5. Heat map and cluster representation of NMR-based metabolomics analyses which exhibited significant changes between pre and post a 1-week fully controlled dietary intervention with either a meat-based diet (control; CON) or a mycoprotein-based diet (MYC), calculated by the Δ change for each participant. Participants in CON are represented in red and participants in MYC are shown in green. Class: ![]() , CON;
, CON; ![]() , MYC. For explanation of abbreviations, see Table 4.
, MYC. For explanation of abbreviations, see Table 4.
Table 4. Significant NMR-based metabolomics features identified using either significant analysis of microarrays (concentrations and ratios) or t tests (dimensions)
(Mean values with their standard errors)
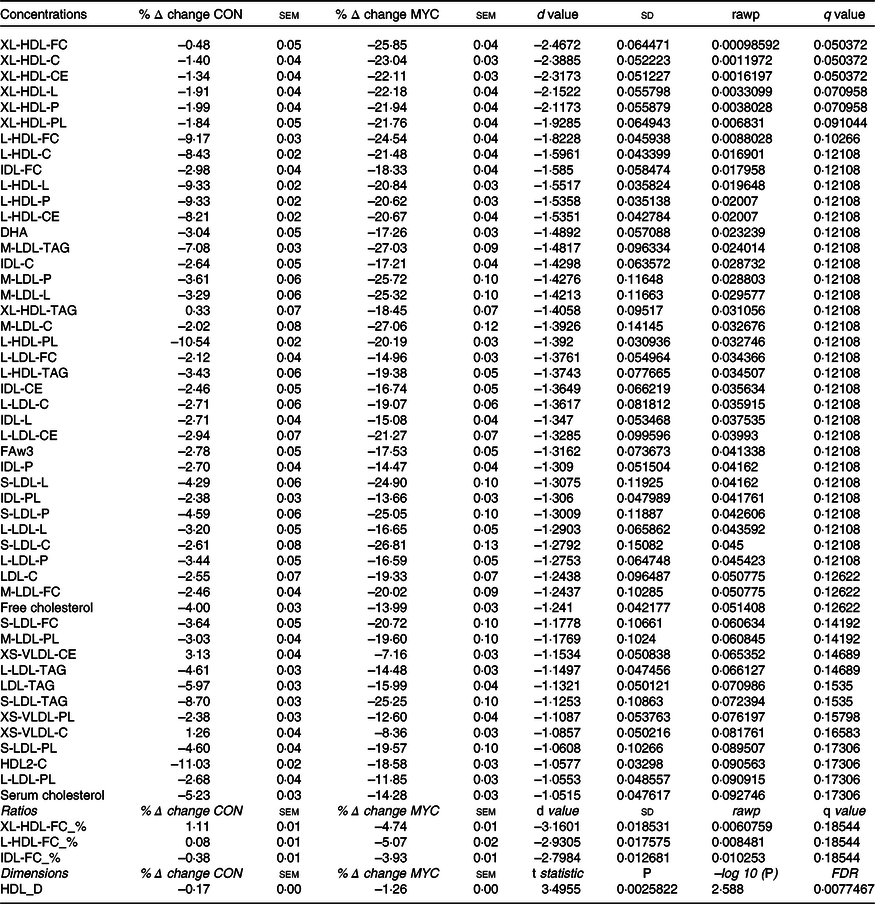
CON, control group; MYC, mycoprotein group; XL-, extremely large; -FC, free cholesterol; -C, total cholesterol; CE, cholesteryl esters; -L, lipid; -P, particles; PL, phospholipids; L-, large; IDL-, intermediate-density lipoprotein; M-, medium; FAw3, n-3 fatty acids; S-, small; XS-, very small; XL-HDL-FC_%, free cholesterol to total lipids ratio in very large HDL; L-HDL-FC_%, free cholesterol to total lipids ratio in large LDL; IDL-FC_%, free cholesterol to total lipids ratio in IDL; FDR, false discovery rate; HDL_D, mean diameter for HDL particles.
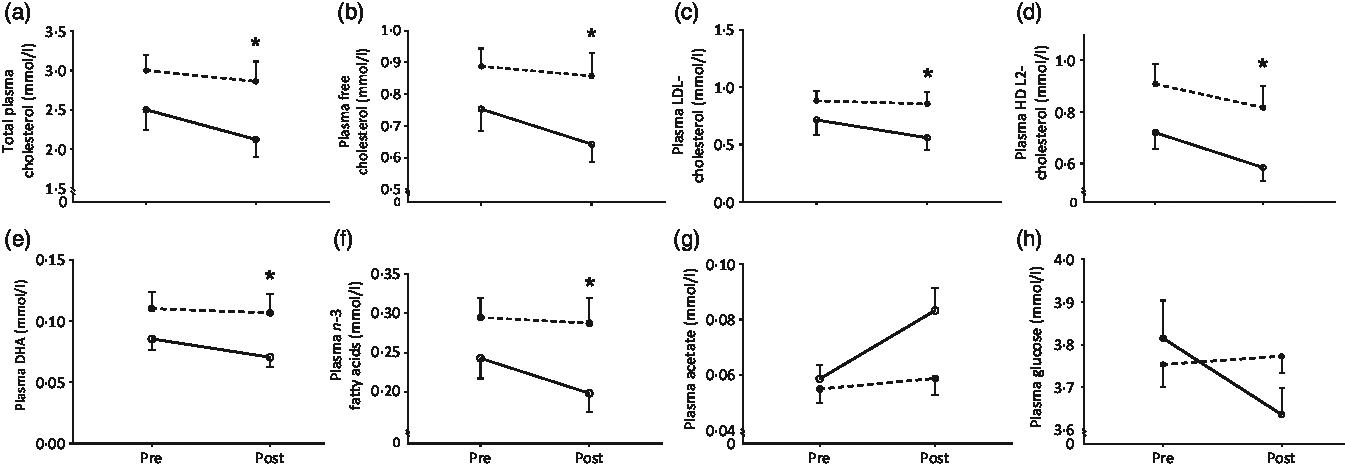
Fig. 6. Selected metabolites from the metabolomics analysis considered of particular relevance. Total plasma cholesterol (a), plasma free cholesterol (b), plasma LDL-cholesterol (c), plasma HDL2-cholesterol (d), plasma DHA (e), plasma n-3 fatty acids (f), plasma acetate (g) and plasma glucose (h) as measured by NMR-based targeted metabolomics pre and post a 1-week fully controlled dietary intervention with either a meat-based diet (control; CON) or a mycoprotein-based diet (MYC). Values are means, with standard errors represented by vertical bars. NMR metabolomics metabolite concentrations were analysed using significant analysis of microarrays (SAM). Total plasma cholesterol, free cholesterol, LDL-cholesterol, HDL2-cholesterol, DHA and n-3 fatty acids were decreased to a larger degree in the MYC group (14–19 % decrease) compared with the CON group (3–11 % decrease; P < 0·05). Plasma glucose remained unchanged in the CON group but was reduced by 4·5 (sem 0·1) % in MYC and plasma acetate concentrations increased by 8·5 (sem 0·1) % and 43·6 (sem 0·1) % in CON and MYC, respectively. The changes in these two variables were significant when individually analysed (t tests, P < 0·05) but not when using the SAM multivariate analysis. ![]() , CON;
, CON; ![]() , MYC.
, MYC.
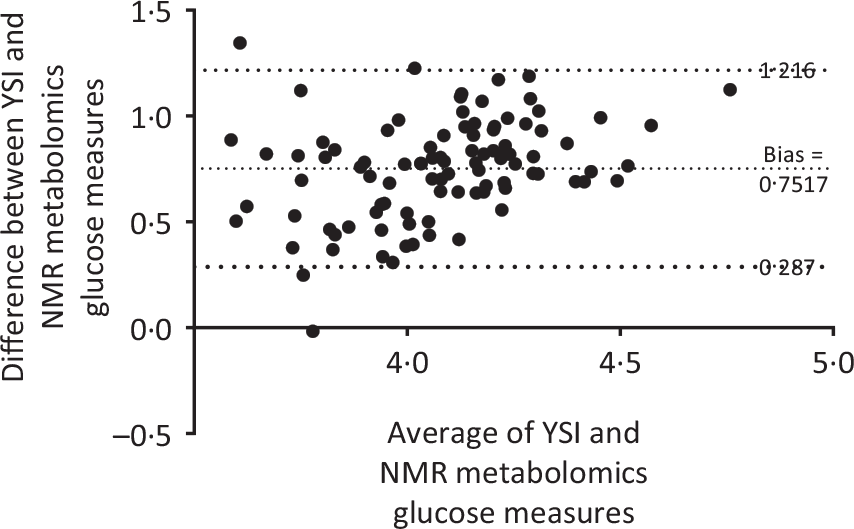
Fig. 7. Bland–Altman analysis plot for blood glucose concentrations measured by the benchtop YSI biochemistry analyser and plasma glucose concentrations measured by NMR spectroscopy, representing the consistency of the variant results between the two techniques. Measurements for every participant’s sample, pre and post a 1-week fully controlled dietary intervention with either a meat-based diet (control; CON) or a mycoprotein-based diet (MYC) in CON and MYC were aggregated. There was a strong positive correlation between the two techniques (r 0·60; P < 0·001).
Discussion
We investigated the impact of substituting meat and fish for mycoprotein as the major source of dietary protein at lunch and dinner during a fully controlled, energy and macronutrient balanced 1 week dietary intervention period on IS, glycaemic control and plasma lipid composition. We report that the mycoprotein intervention did not change indices of whole-body IS or 24- h free-living glycaemic control. However, the mycoprotein intervention had a profound impact on the plasma lipidome, inducing changes generally assumed to be indicative of improvements in long-term cardio-metabolic health.
Earlier studies(Reference Turnbull and Ward15,Reference Bottin, Swann and Cropp16) reported that bolus mycoprotein ingestion improved acute postprandial glucose handling, but no work had investigated whether this translated to longer-term measures of metabolic health. We sought to test the hypothesis that chronic (1 week), habitual (twice daily) mycoprotein consumption would improve whole-body IS and/or daily habitual glycaemic control under carefully controlled conditions. We applied a nutritional intervention with no differences in energy or macronutrient consumption between groups (except for fibre; see Table 2) to young adults (who were well matched across groups; see Table 1). As a result, in our control group, despite a shift from habitual to controlled dietary conditions (which can often induce metabolic changes per se (Reference Turnbull, Leeds and Edwards19)), we observed no changes in any index of IS or glycaemic control. When substituting meat and fish for mycoprotein as the primary source of dietary protein in lunch and dinner, we also observed no changes in indices of liver or peripheral IS determined during an OGTT (Figs. 2 and 3). Given the per meal mycoprotein consumption (about 90 g wet weight) was equivalent/in excess of previous work demonstrating bolus mycoprotein consumption could improve acute glycaemic control(Reference Turnbull and Ward15,Reference Bottin, Swann and Cropp16) , this lack of support for our hypothesis was perhaps surprising. However, those previous studies also indicated the effect was probably mediated by acute postprandial interactions of mycoprotein with dietary CHO, rather than an effect on IS per se. Of interest, epidemiological studies have shown total (postprandial) hyperglycaemia and/or the prevalence of (postprandial) hyperglycaemic excursions over the day to be better predictors of longer-term cardio-metabolic health(Reference Cavalot, Petrelli and Traversa41). As such, to capture any effects of repeated mycoprotein ingestion on cumulative free-living postprandial glycaemic control (which could feasibly be independent of changes in IS), we applied continuous glucose monitoring throughout the study. However, whether we looked across the entire day or focussed on postprandial periods only, we did not observe any impact of the mycoprotein intervention (compared with either habitual conditions or the control group). We therefore demonstrate that short-term mycoprotein consumption does not impact IS or daily blood glucose control, at least in healthy young adults.
It is worth noting that our participants habitually consumed relatively high protein intakes (i.e. about 1·5 g/kg per d) and the intervention therefore represented an approximately 20 % decrease in habitual protein intake. Since high-protein diets have been shown to improve glycaemic control(Reference Farnsworth, Luscombe and Noakes42), we cannot discount the possibility that the drop in protein intake obscured any potential changes in IS or glycaemic control; though, if so, we would expect these effects across both groups equivalently and our control group also remained unchanged. From a translational perspective, the protein content of the diet plays a large role in determining free-living energy balance, both directly via inducing dietary thermogenesis and indirectly based on the leverage of appetite(Reference Westerterp-Plantenga, Lemmens and Westerterp9). Given mycoprotein is also a particularly satiating dietary protein source(Reference Turnbull, Walton and Leeds43–Reference Williamson, Geiselman and Lovejoy45), attention should also be paid when considering mycoprotein (and how much) as a dietary intervention as to whether over- or under-eating is of primary concern for a particular population. It is important that future work extends these findings to more (metabolically) compromised individuals, where such dietary interventions are more likely to induce subtle, but clinically relevant, alterations in indices of metabolic health.
Our findings are in line with previous work that has reported that nutritionally induced acute beneficial effects on postprandial glucose handling do not necessarily translate to longer-term benefits on IS(Reference Nestel, Cehun and Chronopoulos46). Noteworthy, however, is the lowering effect of the mycoprotein diet on fasting blood glucose concentrations. As a recognised clinical marker of IS, this suggests mycoprotein consumption may support metabolic health, although it is difficult to explain why this was observed in the absence of effects on calculated IS and/or 24 h glucose control. It is possible that mycoprotein consumption specifically altered glucagon sensitivity (potentially due to mycoprotein’s high fibre content)(Reference Bodnaruc, Prud’homme and Blanchet47) or induced early improvements in β-cell function(Reference Abdul-Ghani and DeFronzo48), but clearly this warrants further research. It is crucial such research examines the effects of mycoprotein consumption during a longer time period and in various (more metabolically compromised) populations, as these changes may simply have been too subtle to detect in healthy individuals during a relatively short-term intervention. While our data did not largely support our hypothesis, incorporating mycoprotein as a sustainably produced alternative to meat clearly does not negatively impact on metabolic health over a 1 week period, an important perspective given the impetus in various populations to reduce animal-derived protein consumption. Indeed no gastrointestinal or other adverse effects were reported during the mycoprotein intervention, and the food substitutes were generally well tolerated/liked. While data concerning food preferences driving eating behaviour are necessary to evaluate the wider potential/application of such dietary interventions under free-living conditions, our data indicate mycoprotein-containing products are a practical and feasible simple alternative to animal protein sources.
An existing body of work has demonstrated that 3–8 weeks of mycoprotein consumption reduce total plasma cholesterol and plasma LDL concentrations thereby resulting in improved HDL:LDL ratios (a robust marker of beneficial metabolic health outcomes(Reference Turnbull, Leeds and Edwards18,Reference Turnbull, Leeds and Edwards19,Reference Udall, Lo and Young49) ). To shed further light on this area, we applied a novel NMR-based quantitative and targeted metabonomics approach(Reference German, Hammock and Watkins50). Strikingly, we found that merely 1 week of mycoprotein consumption led to coordinated changes in fifty-three of our 224 targets (see Table 4; Fig. 6). Specifically, we report decreases in plasma lipoprotein lipid content and, importantly, in plasma total, free, LDL- and HDL2-cholesterol. However, unlike in previous studies(Reference Turnbull, Leeds and Edwards18,Reference Turnbull, Leeds and Edwards19) , this reduction in cholesterol was ubiquitous across lipoprotein species, and therefore did not impact lipoprotein ratios (e.g. LDL:HDL)(Reference Natarajan, Glick and Criqui51).
We(Reference Coelho, Monteyne and Dunlop14) and others(Reference Turnbull, Leeds and Edwards18,Reference Turnbull, Leeds and Edwards19) have previously argued that the cholesterol-lowering effect of mycoprotein consumption is probably related to the fibre content (or type) it contains (the most obvious nutritional difference across the diets; 26 v. 34 g daily in CON and MYC, respectively). While our design (not fibre matched across groups) does not allow us to disentangle the interesting potential effects of fibre quantity v. type(Reference Coelho, Monteyne and Dunlop14), the role of higher fibre intake in reducing circulating cholesterol concentrations is also in line with epidemiological(Reference Rimm, Ascherio and Giovannucci52,Reference Wolk, Manson and Stampfer53) and intervention(Reference Brown, Rosner and Willett54) studies (2–10 g fibre supplementation per d), with these effects also translating to a reduced risk of CHD. We therefore provide evidence that an innocuous and feasible dietary intervention can provide a sufficient increase to dietary fibre intake to place individuals at the top end of this dose–response effect. Furthermore, we extend on previous observations(Reference Turnbull, Leeds and Edwards18,Reference Turnbull, Leeds and Edwards19,Reference Udall, Lo and Young49) by demonstrating how rapidly this effect ensues consequent to mycoprotein consumption.
The mechanism(s) by which increased fibre intake lowers circulating plasma cholesterol may be related to large intestinal fermentation of insoluble fibre fractions via the gut microbiota(Reference Coelho, Monteyne and Dunlop14,Reference Gunness and Gidley55) . SCFA, such as acetate, propionate and butyrate, are primary products of fibre fermentation(Reference Cummings, Pomare and Branch56). Though SCFA have been shown to have a range of metabolic effects(Reference den Besten, van Eunen and Groen57–Reference Roshanravan, Mahdavi and Alizadeh61), of note is the reported effect of (propionate in particular) reducing hepatic cholesterol synthesis(Reference Cheng and Lai62). In vitro colonic models have shown mycoprotein’s fibre (which is composed of approximately two-thirds β-glucan and one-third chitin(Reference Coelho, Monteyne and Dunlop14)) to be fermentable to propionate and butyrate, but at the expense of acetate(Reference Harris, Edwards and Morrison63), suggesting such end products could underpin the cholesterol-lowering effect. It is, therefore, somewhat surprising that we observed a considerable (40 %) increase in plasma acetate (Fig. 6) following 1 week of mycoprotein consumption. However, this is in line with previous work showing the acute consumption of other dietary fibres leading to increased postprandial serum acetate concentrations(Reference Tarini and Wolever64), and that fibre (e.g. oat- or bran-rich diets) induced reductions in circulating cholesterol are also associated with increases in blood acetate(Reference Bridges, Anderson and Deakins65). Whether acetate as an in vivo end product of mycoprotein bacterial fermentation mediated the plasma cholesterol-lowering effect, either by inhibiting cholesterol synthesis or by other unknown mechanisms (such as reduced cholesterol absorption or increased peripheral clearance) is not clear and warrants future (human) research.
The metabolomics approach also revealed non-cholesterol-related changes in the plasma lipidome. Of note, mycoprotein consumption decreased plasma DHA and n-3 fatty acid concentrations (Fig. 6), presumably due to a lower dietary load. However, given the reported variance in plasma levels of these lipids tends to be related to an individual’s last meal, this may be an acute effect rather than reflective of a ‘deficiency’, particularly over only a 1 week period(Reference Sun, Ma and Campos66). Nevertheless, since n-3 fatty acids in particular have been linked to various desirable health outcomes(Reference Swanson, Block and Mousa67) it would be prudent for future dietary interventions that involve reducing dietary intake of n-3 (and DHA) lipids to monitor such effects.
In conclusion, the present data show that substituting meat/fish for mycoprotein at lunch and dinner for 1 week does not modulate whole-body IS or 24-h free-living (postprandial) glycaemic control but considerably impacts upon the plasma lipidome. Mycoprotein represents a sustainable dietary protein source that can be incorporated into the daily diet without compromising short-term metabolic health and facilitating rapid and possibly beneficial changes to the plasma lipidome.
Acknowledgements
The project was sponsored by Marlow Foods Ltd (B. T. W. as grant holder). The University of Exeter was responsible for the study design, data collection and analysis, decision to publish and preparation of the manuscript. The private partners have contributed to the project through regular discussion.
M. O. C. C. and B. T. W. designed research. M. O. C. C. recruited, randomised and assigned participants to interventions. M. O. C. C., A. J. M. and M. L. D. conducted research. T. J. A. F. provided essential materials. M. O. C. C. analysed data. M. O. C. C., F. B. S. and B. T. W. wrote the paper. B. T. W. had primary responsibility for final content. All authors read and approved the final manuscript.
B. T. W. has received research grants from Marlow Foods. M. O. C. C. and A. J. M. receive PhD studentship funding from Marlow Foods and the College of Life and Environmental Sciences, University of Exeter. T. J. A. F. is an employee of Marlow Foods. The remaining authors declare no conflicts of interest.
Supplementary material
For supplementary material referred to in this article, please visit https://doi.org/10.1017/S0007114520002524


