


With the increase of overweight and obesity, developing approaches to lower food intake is an ongoing public health challenge. In 2016, more than 1·9 billion adults (approximately 39 % of the world’s adult population) were overweight, of which 650 million were obese(1). Nowadays, more attention is given to eating behaviour and how to change this to decrease food intake. There is much evidence that food and energy intake is effectively lowered by decreasing eating rate (amount of food consumed per unit of time, in g/min)(Reference de Graaf2–Reference Robinson, Almiron-Roig and Rutters5). In this context, oral exposure duration can influence food intake(Reference Bolhuis, Lakemond and de Wijk6–Reference Zijlstra, De Wijk and Mars9). Consequently, energy intake rate (energy consumed per unit of time, in kJ/min), ad libitum intake and thereby overconsumption can be reduced when foods are consumed with slower eating rates.
Eating rate depends on both consumer characteristics(Reference McCrickerd and Forde4,Reference Devezeaux de Lavergne, Derks and Ketel10,Reference Ketel, Aguayo-Mendoza and de Wijk11) and food properties(Reference Forde, Leong and Chia-Ming12–Reference van den Boer, Werts and Siebelink14). Individuals have consistent habitual eating strategies for any type of food: those who eat faster were observed to take larger bites from different types of foods and consume typically more energy(Reference McCrickerd and Forde4,Reference Robinson, Almiron-Roig and Rutters5) . Changing food properties has been reported to change eating rate and thereby intake. Well-known examples are changing viscosity in liquids/semi-solids or changing hardness in solids(Reference Lasschuijt, Mars and Stieger7,Reference de Wijk, Zijlstra and Mars15–Reference Zijlstra, Mars and De Wijk17) .
Variation in food shape can also influence oral processing behaviour and food intake, but this aspect has been less studied. Recently, we investigated the effect of carrot shape on oral processing behaviour within one bite(Reference van Eck, Wijne and Fogliano18). Carrot cubes were chewed for a shorter time, with fewer chews and with higher eating rate than carrots julienne served at equal weight(Reference van Eck, Wijne and Fogliano18). Goh et al. and Liem & Russell investigated whether differences in shape and serving size of vegetables (whole v. diced carrots) affected ad libitum intake among children. They found that intake of whole carrots was significantly higher than intake of diced carrots(Reference Goh, Russell and Liem19,Reference Liem and Russell20) . However, the mechanisms by which food shape influences eating behaviour and/or intake are not well understood and require further investigation.
Although some strategies are known to change eating behaviour of single foods, little is known about changes in eating behaviour when foods are consumed in combination with other foods. For example, bread or crackers are often combined with cheese or spreads, salad with dressing or yogurt with cereals. Such foods that are composed of two or more single foods are termed composite foods. From the start of consumption, the combined foods are mixed in the mouth resulting in versatile textural properties and thereby less predictable oral processing behaviour. Previously, we showed that different condiments affected the eating rate of bread and cracker to a different extent. Eating rate was especially influenced by the consistency of the condiment. Fastest eating rate of crackers and breads was obtained when combined with mayonnaise, followed by cheese spread and then firm cheese(Reference van Eck, Hardeman and Karatza21). Bolhuis et al. assessed the effects of varying hardness of bread (soft v. hard) and vegetables (raw v. cooked) on total meal energy intake and found that energy intake was 13 % lower in the harder version of each food(Reference Bolhuis, Forde and Cheng22). Recently, Mosca et al. assessed eating rate and ad libitum intake of yogurts with added granola pieces varying in particle size (6 and 12 mm). Modification of granola particle size changed the eating rate by 7 % and ad libitum intake by 5 %(Reference Mosca, Torres and Slob23). These studies showed that variations in single food properties can affect eating rate sufficiently to affect total energy intake of composite foods.
The aim of this study was to investigate the influence of food properties (shape, viscosity) on eating rate and ad libitum intake of composite snacks. Snack consumption has increased in the last decade(Reference Bellisle, Dalix and Mennen24–Reference Piernas and Popkin26) and contributes substantially to our daily energy intake(Reference de Graaf27). For instance, snack consumption is responsible for 1920 and 2423 kJ/d for US children (2–18 years, 2011–2014)(Reference Dunford and Popkin25) and US adults (≥19 years, 2003–2006)(Reference Piernas and Popkin26). In the past few years, several snacks became globally, commercially available that belong to the category of composite foods. Composite snacks are often designed to be consumed ‘on the go’ by dipping a cracker into a spread. Cracker and spread are both provided in the product package in separate compartments. Examples of commercially available composite snacks include crackers with cheese (Cheez Dippers®, Groupe Bel) and crackers with hazelnut-cocoa spread (Nutella & Go! ®, Ferrero). We investigated crackers and processed cheese in this study and evaluated the snacking and dipping behaviour of these products while participants watched a video, resembling a real-life situation. The second objective of this study was to investigate the relationships between oral processing characteristics, dynamic dipping behaviour and ad libitum intake. We hypothesised that both cracker shape and cheese viscosity would change bite size (and the ratio between cracker:cheese), as cheese might be easier scooped when crackers have a larger surface area or when cheeses have a higher viscosity. We hypothesised that single products could be optimised for their shape and consistency to influence bite size and/or eating rate of composite foods and to regulate food intake. Such an approach offers the possibility to develop snacks that assist in energy intake regulation.
Materials and methods
Design
A 2 × 2 factorial design was used with two cracker shapes (flat squares/finger-shape sticks) and two cheese viscosities (high/low), yielding four crackers with cheese combinations (section ‘Test products’). It should be noted that crackers without cheese (flat squares/finger-shape sticks) were not included in the study design. Crackers without cheese were not iso-energetic and not equally liked as crackers with cheese (data not shown). The comparison of ad libitum food intake between crackers without cheese and crackers with cheese would therefore not have been meaningful in this study.
Participants attended 4 test days over a time period of 4 weeks, 1 test d/week, so that they assessed each cracker–cheese combination once. During each test day, lunch was served at the university (at 12.00 or 13.00 hours) to standardise lunch intake and time. Then, in the late afternoon snack session (at 16.00 or 17.00 hours, respectively), participants consumed crackers with cheese dip ad libitum while watching a video (section ‘Videos: nature documentaries’). While consuming the cracker–cheese samples, participants were video recorded to extract oral processing behaviour parameters. In addition, cheese dipping behaviour was recorded by hidden balances under the cheese bowls. The presentation order of samples and videos was balanced using Williams Latin square design.
Participants
Participants were recruited from Wageningen and surroundings using social media and printed posters. Participants were selected to be cracker and cheese consumers (at least once a month, self-reported), and they had to fulfil the following criteria: age between 18 and 35 years, European nationality, Caucasian ethnicity, BMI between 18·5 and 30 kg/m2 and good general and oral health (self-reported). Participants were excluded from the study if they smoked or had a food allergy or intolerance to any of the ingredients present in both foods assessed in the study. Participants were also excluded if they had difficulties with chewing, swallowing and/or eating in general, had dental braces (not including a dental wire), had smell or taste disorders, used medication that may affect the function of taste/smell/mastication/salivation, had a history of eating disorders, had followed an energy-restricted diet during the last 2 months, gained or lost 5 kg of body weight over the last half year or if they were pregnant or lactating.
Participants were invited to a screening session to check whether they were eligible to participate in the study. Participants completed the screening questionnaire including general information, medical information and information about allergies, product use and eating patterns, the Dutch Eating Behaviour questionnaire(Reference Van Strien, Frijters and Bergers28) and the three-factor eating questionnaire(Reference Stunkard and Messick29).
Eighty-five participants participated in the screening session. After the screening, fifty-one participants were found eligible and available. These fifty-one participants (thirteen males, 23 (sd 3) years old, BMI of 21 (sd 2) kg/m2) completed the study. The primary outcome of interest of this study was ad libitum snack intake. Sample size was estimated for this outcome measure. The estimated sample size was forty-nine participants, which was obtained by a power calculation using α = 0·05, power of 80 % and an effect size of 10 %. Ad libitum food intake has been shown to be affected by food texture properties. Ad libitum food intake effect size depends largely on the extent of the food texture manipulation. Subtle manipulations of food texture have been demonstrated to have small effects on ad libitum food intake. Bolhuis et al. found a 13 % difference in ad libitum food intake for harder v. softer composite meal items(Reference Bolhuis, Forde and Cheng22). Weijzen et al. found a 12 % difference in ad libitum food intake when snack size was changed from nibbles to bars(Reference Weijzen, Liem and Zandstra30). Product manipulations of the present study (cracker shape and cheese viscosity) were considered to be of similar magnitude as the manipulations of Bolhuis et al. and Weijzen et al. Consequently, we estimated an effect size of 10 % for ad libitum snack intake (kJ) for our study.
Participants were kept naïve to the primary outcome of the study. Participants were told that the study aimed to determine liking of crackers with cheese while watching different nature documentaries. Participants were debriefed regarding the actual study objective after the study. Participants received a monetary incentive for their participation (€50 after completion of the study) and gave written informed consent before the start of the study. The study was registered at the Dutch Trial register (NL7741; http://www.trialregister.nl). The experimental protocol of the study was reviewed by the medical ethics committee of Wageningen University (NL70240.081.19, ABR70240). The medical ethical committee advised positively about the medical and ethical acceptability of the study.
Test products
Two cracker shapes were prepared (Fig. 1): flat squares (40 × 40 × 3 mm; surface area per cracker 3680 mm2) and finger-shape sticks (60 × 10 × 10 mm; surface area per cracker 2600 mm2). Crackers were prepared from the same dough and baked into the two shapes with an equal weight per piece to assure equal flavour and energy content between the two shapes (approximately 1620 kJ/100 g). The dough was based on a commercial cracker recipe and was prepared from the following ingredients: wheat flour (Edelweiss, Meneba), tap water, salt (Jozo), barley syrup (Horizon), icing sugar (Van Gilse), margarine (Trio puur zacht, CSM) and bakery enzyme (Biobake BPN, Kerry). Equal cracker weight before and after baking (weight after baking: 2·4 (sd 0·1) g for the squares, 2·5 (sd 0·1) g for the sticks, twelve replicates per cracker type) and similar moisture content (5 (sd 2) wt% for the squares, 7 (sd 0) wt% for the sticks, ten replicates per cracker type) were assured by adjusting baking time and temperature. To characterise the hardness of the two shapes, three-point bend tests were performed with a Texture Analyser (TA.XT Plus, Stable Micro Systems) fitted with a 5 kg load cell and a constant test speed of 2 mm/s. The mean force needed to break the crackers was 5·2 (sd 1·5) and 7·6 (sd 3·0) N, twenty-six replicates per cracker type, for the flat-squared and finger-shape crackers, respectively.
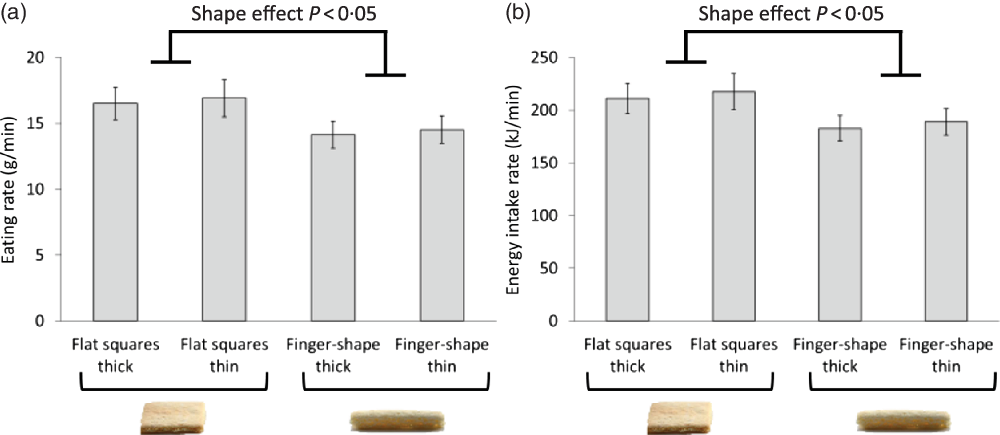
Fig. 1. Eating rate (a) and energy intake rate (b) of crackers varying in shape consumed together with cheese dips varying in viscosity. Pictures of crackers varying in shape are presented for illustration purposes. Values are means, with their standard errors represented by vertical bars.
Cheese dips were based on commercially available processed cheese dip recipe (Cheez Dippers, BEL group). The creaming (stirring at 80°C) and cooling process during production were slightly adapted to obtain cheese dips with different viscosities and identical energy content (approximately 996 kJ/100 g). Flow curves of the two cheese dips were determined using a rheometer (MCR 301 Rheometer, Anton Paar Benelux BVBA) equipped with an Inset I-PP50/SS plate and a CP50-1 cone. A resting period of 5 min was applied, after which the viscosity was measured between shear rates ranging from 1 to 1000/s within a time period of 7·5 min at 20°C. The cheese dip with a viscosity of 124 Pa×s at 1/s, of 16 at 10/s and 2 at 100/s is referred to as thick, whereas the cheese dip with viscosities of 55 Pa×s at 1/s, 9 at 10/s and 1 at 100/s is referred to as thin. At the end of the last snack session, forty-four participants received both cheeses on a spoon in a randomised serving order and were asked to choose the thickest cheese (2-AFC) out of a pair. Thirty-two participants (74 %) chose the high- viscous cheese as the thickest sample, indicating that the difference in viscosity between cheeses led to a difference in thickness perception. Cheeses were removed from the refrigerator the afternoon before evaluation and allowed to equilibrate to a temperature of 17°C (17 (sd 3)°C for the high-viscosity cheese, 17 (sd 4)°C for the low-viscosity cheese).
Videos: nature documentaries
Four different episodes (Galapagos Islands, Scottish Highlands, Great Barrier Reef and Namibia Desert) of a nature documentary (Nature’s Microworlds, BBC Earth) were shown during the test sessions. Nature documentaries were added to the study design for three reasons. First, crackers with cheeses are generally consumed in a distracted state. Second, participants automatically turned their head straight to the screen when watching a documentary, which allowed us to determine oral processing behaviour easily. Third, in order to avoid participants from gobbling the samples to finish the session earlier, participants were told that they had to watch the entire documentary before evaluating final appetite and liking.
Test day procedure
Participants were instructed to eat the same breakfast around the same time for all test session days and to record this in an online diary. Morning snacks were also recorded in this diary.
Participants were provided with a standardised lunch at either 12.00 or 13.00 hours, depending on the time of the test session (16.00 or 17.00 hours, respectively). The lunch consisted of tomato soup, whole-grain bread slices, hummus, Nutella and a fruit yogurt. For each participant, the amount of food was calculated based on 22 % of their daily energy needs (Schofield, WHO, 1985). Participants self-filled the sandwiches, and they were instructed to finish the lunch plate within 30 min. In addition, participants were requested neither to consume anything except water, tea or coffee without milk and sugar nor to perform sports in between lunch and the afternoon test sessions.
At the beginning of the late afternoon snack session, participants rated appetite including hunger, fullness and thirst. Then, participants received a large bowl of pre-weighed crackers (approximately 200 g, approximately eighty pieces) and a large bowl of pre-weighed cheese dip (approximately 500 g), which is about twenty times more than the commercially available snack product Cheez Dippers (BEL group). They also received a pre-weighed glass of tap water (approximately 300 g) that they could consume freely during the session. After the first bite, they rated how much they liked the crackers, cheese dip and the combination. Then, they were asked to watch a nature documentary of about 30 min and to consume crackers with cheese dip until they were comfortably full. Participants could ask for more crackers and cheese if required. Immediately after the documentary ended, participants were asked to indicate how much they liked the documentary. Then, they rated their appetite and product liking again. Finally, participants indicated why they terminated consumption: I was full, the flavour of crackers with cheese was not pleasant anymore, I was bored, on a five-point scale anchored from totally disagree to completely agree. Ratings of appetite, product liking and documentary liking were assessed using a 100-point visual analogue scale anchored with not at all and very much. Data were acquired by Qualtrics survey software (version October 2019, Qualtrics).
Data extraction and analysis
Ad libitum intake
Ad libitum cracker and cheese intake was calculated by subtracting the weight of the bowls before and after consumption. Parameters extracted were total cracker intake (in g, in kJ), total cheese intake (in g, in kJ) and total food intake (in g, in kJ) (Table 1).
Table 1. Overview of the ad libitum intake, bite size and oral processing behaviour parameters extracted throughout the experiment

* Dynamic evolutions in dip size during consumption (from first bite to last bite) were also collected.
Oral processing behaviour
Oral processing behaviour throughout snacking was determined using video recordings. A webcam (Microsoft LifeCam studio) was placed on top of the computer screen, just above the nature documentary that was presented on the screen to ensure that participants looked into the camera (face-on). Videos were decoded using Simple Video Coder Software(Reference Barto, Bird and Hamilton31). A coding scheme was developed to record the frequency and the duration of three key events (i.e. new cracker with cheese dip, re-dipped cracker, sip of water) and two additional behavioural events (i.e. cracker without cheese, two crackers consumed at the same time) during a complete snacking event of about 30 min. Coding of all video recordings was performed by two trained video coders, who watched several videos together until they agreed on the coding scheme. Approximately 10 % of the videos were randomly selected, and codification was validated by both.
Oral processing behaviour parameters directly extracted from the video recordings include number of crackers eaten, number of bites taken, number of sips of water, total snacking time (min), total oral exposure time (min) and averaged oral exposure time per bite (s/bite) (Table 1). Total snacking time was defined as the time between the first bite and the last swallow. Total oral exposure time was defined as the cumulated period that food remains in the mouth during the snacking event. Averaged oral exposure time was defined as the averaged period that food remains in the mouth per bite. Subjects can take multiple swallows, but only the moment of the main swallow was used for analysis.
Additional oral processing behaviour parameters including eating rate (g/min) and energy intake rate (kJ/min) were calculated by combining the intake and video data. Eating rate (g/min) and energy intake rate were calculated by dividing the amount of crackers and cheese dip eaten (g and kJ) by the total snacking time (min).
Cheese dipping behaviour
Cheese dipping behaviour throughout snacking was monitored by precision balances (Kern, type PCD 10K0.1, KERN & Sohn GmbH). Cheese bowls were placed on the balances hidden in a table setup, so that participants did not see the balance. The balances were connected to a computer by a USB cable, which allowed us to continuously record the weight of the cheese bowls (Software BalanceConnection, Kern, KERN & Sohn GmbH).
Dipping behaviour parameters (Table 1) include number of dips and averaged dip size (g), which were extracted from the hidden balances that recorded the weight of the cheese bowl (g) for every second of the complete snacking event of 30 min. In addition, this allowed us to determine the dynamic evolutions in dip size during consumption. The additional dipping behaviour parameter averaged cheese:cracker weight ratio was calculated by combining the dipping and intake data, by dividing the cheese intake in g by the cracker intake in g.
Statistical data analysis
Results were reported as raw mean values with standard errors. When less than 10 g of crackers (n 6) or less than 10 g of cheese dip (n 1) were consumed, data were excluded from the statistical analyses. In total, statistical data analyses were performed on results of forty-four participants (thirteen male, 23 (sd 3) years, BMI 21 (sd 2) kg/m2). One-way ANOVA on appetite and liking data were conducted to assure equal appetite at the start of the snack sessions and to compare products’ effects on appetite and liking. The effect of cracker shape and cheese viscosity on intake, bite size and oral processing behaviour parameters (Table 1) were analysed with linear mixed models using the Lmer package(Reference Kuznetsova, Brockhoff and Christensen32). Shape, viscosity and shape:viscosity interaction were set as fixed effects, and participant and session were set as random effects. The effect of consumption time on dynamic dipping behaviour was analysed with linear mixed models with time, sample and time:sample as fixed effects and participant and session as random effects. Multiple factor analysis was performed on different data sets (intake, oral processing behaviour, dipping behaviour) to compare consumers differing in dipping behaviour using the FactoMineR package(Reference Lê, Josse and Husson33). R language (RStudio, version 1.0.143) was used to perform all statistical tests. Significance level of α < 0·05 was chosen.
Results
Ad libitum food intake
Ad libitum cracker intake was not influenced by cracker shape (F 1,129 = 0·01, P = 0·94) nor cheese viscosity (F 1,129 = 0·09, P = 0·77). Ad libitum cheese intake was significantly influenced by cracker shape (F 1,129 = 5·94, P = 0·016); finger-shape crackers led to a 15 % (13·2 g, 131 kJ) lower intake of cheese dips compared with that of flat squares (Table 2). Consequently, averaged total energy intake was 1971 (sem 138) kJ when cheese dips were served with finger-shape crackers and 2106 (sem 145) kJ when served with flat squares (total energy intake reduction of 7 %). Cheese viscosity did not affect cheese intake (F 1,129 = 0·05, P = 0·83) nor total energy intake (F 1,129 = 0·00, P = 0·98). Total water consumption throughout the snacking session (239 (sd 115) g) was not influenced by cracker shape (F 1,127 = 0·00, P = 0·96) nor cheese viscosity (F 1,126 = 0·25, P = 0·61).
Table 2. Significance values (cracker shape, cheese viscosity, shape:viscosity interaction) describing ad libitum intake (A), oral processing behaviour (B) and dipping behaviour (C) of crackers with cheese dip†
(Mean values with their standard errors)

* Significant (P <0·05).
† The different parameters are explained in Table 1.
Oral processing behaviour
Number of crackers, number of bites, number of sips of water, total snacking time and oral exposure time per bite did not differ significantly between samples (Table 2). On average, participants consumed 28 (sem 1) crackers with 46 (sem 2) bites, regardless of cracker shape and cheese viscosity. Over the total snacking event, total oral exposure time was found to be significantly shorter for flat squares (10 (sem 1) min) than for finger-shape crackers (11 (sem 1) min) (F 1,129 = 5·17, P = 0·025).
Eating rate and energy intake rate of crackers with cheese dip were significantly influenced by cracker shape (F 1,129 = 16·26, P < 0·001; F 1,129 = 16·06, P < 0·001), but not by cheese viscosity nor by a shape:viscosity interaction (Fig. 1). Flat squares resulted in a higher eating rate and higher energy intake rate than finger-shape crackers.
Cheese dipping behaviour
The number of dips was significantly lower for flat squares (33 (sem 2)) than for finger-shape crackers (37 (sem 2)) (F 1,126 = 5·58, P = 0·020). Cheese dip size was significantly larger for flat squares (2·9 (sem 0·2) g) than for finger-shape crackers (2·3 (sem 0·1) g) (F 1,125 = 32·42, P < 0·001). Consequently, cheese:cracker weight ratio was significantly larger for flat squares (1·5 (sem 0·1)) than finger-shape crackers (1·3 (sem 0·1)) (F 1,127 = 16·08, P < 0·001). Cheese viscosity and shape:viscosity interactions did not significantly influence cheese dipping behaviour (Table 2).
Dipping behaviour evolved over snacking time, and our data showed that number of dips (and thereby also other factors such as the eating rate, energy intake rate) decreased with increasing snacking time (F 5,980 = 107·42, P < 0·001), regardless of cracker shape and cheese viscosity (Fig. 2(b)). On average, participants dipped 9–11 times in the first 5 min, whereas this was only 2–3 times in the last 5 min of the snacking session. Dip size remained relatively constant throughout the snack session of 30 min (F 5,859 = 1·76, P = 0·12) (Fig. 2(c)), resulting in a steadily higher consumption of cheese with the presence of flat squares compared with that with finger-shape crackers. No significant time:sample interaction was found for the number of bites (F 980,15 = 0·70, P = 0·79) and dip size (F 858,15 = 0·46, P = 0·96), which indicates that the effect of time was comparable for all cracker–cheese combinations.
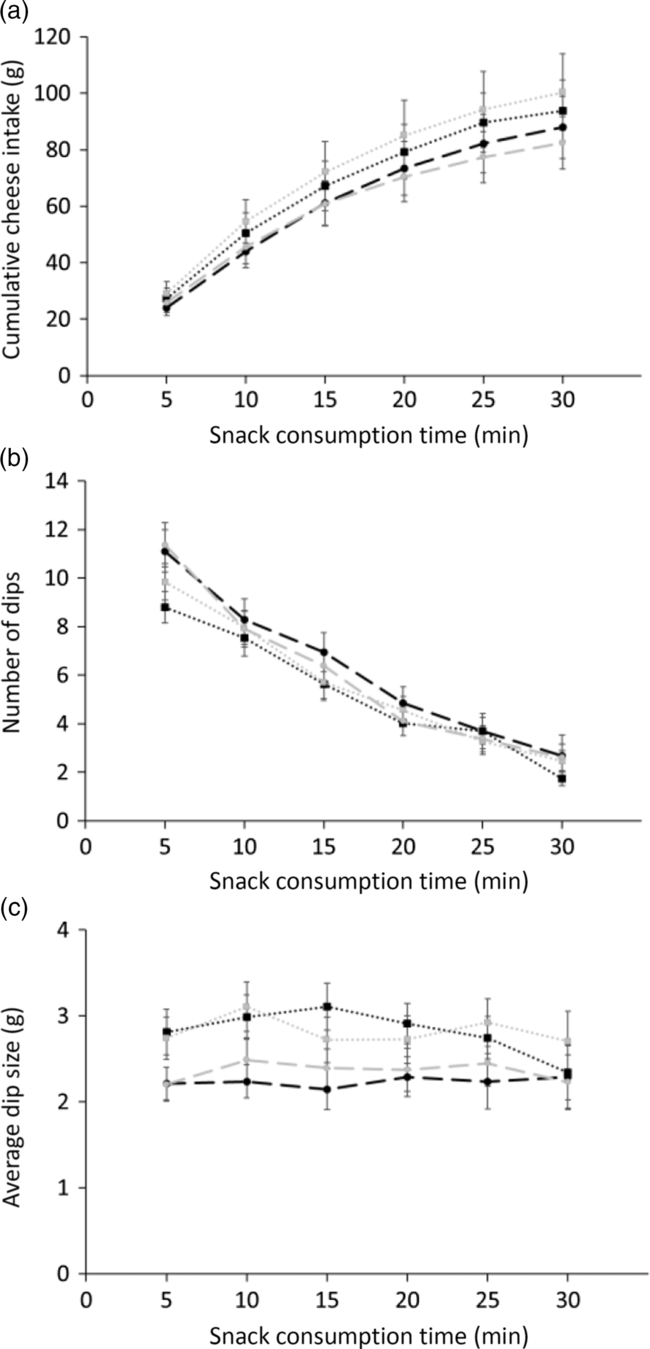
Fig. 2. Cumulative cheese intake (a), number of dips (b) and averaged cheese dip sizes (c) during the consumption of crackers with cheese dip within a 30-min afternoon snack session. Time points are averaged for every 5 min. Values are means, with their standard errors represented by vertical bars. (a) to (c) ![]() , Flat squares/thick;
, Flat squares/thick; ![]() , flat squares/thin;
, flat squares/thin; ![]() , finger-shape/thick;
, finger-shape/thick; ![]() , finger-shape/thin.
, finger-shape/thin.
Individual differences in cheese dipping behaviour
Participants differed in their dipping behaviour, as was observed from the video recordings. Most participants (n 23) dipped crackers more than once per cracker (i.e. they dipped the cracker into the cheese, bit part of the cracker and dipped the remaining part of cracker into the cheese once more). Some participants (n 9) dipped crackers only once per cracker. In addition, some participants adapted their behaviour according to the shape of the cracker, as some participants (n 8) dipped the finger-shape crackers twice or multiple times and the flat squares once per cracker, whereas others (n 3) dipped the flat squares twice or multiple times and the finger-shape crackers once. Multiple factor analysis was performed to represent the different dipping behaviour groups in relation to the different data matrices (intake, food oral processing behaviour and dipping behaviour). Visual inspection of Fig. 3 shows that the first dimension mostly describes the difference in dipping behaviour (Dim 1:58·72 %). When comparing only-once-dippers and more-than-once-dippers, they applied a similar number of dips (34 (sem 3) v. 37 (sem 2)), but the only-once-dippers consumed far more cheese per bite (3·3 (sem 0·2) g) than the more-than-once dippers (2·3 (sem 0·1) g). Consequently, the only-once-dippers snacked faster (20 (sem 1) v. 13 (sem 1) g/min) leading to a higher amount of cracker (87 (sem 9) v. 55 (sem 3) g), cheese (111 (sem 11) v. 86 (sem 7) g) and total energy (2510 (sem 225) v. 1747 (sem 105) kJ) than more-than-once-dippers.
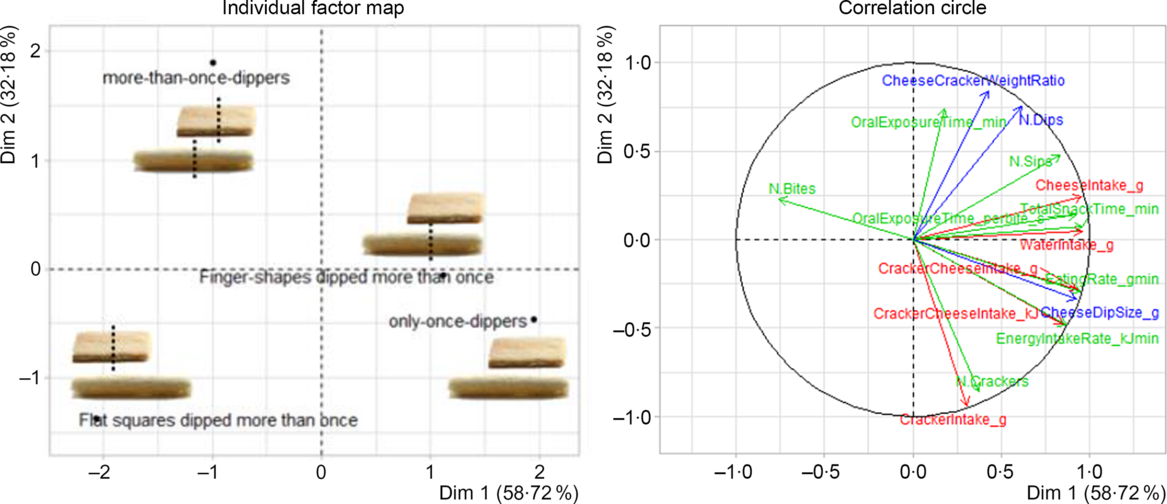
Fig. 3. Comparison of four groups of participants varying in dipping behaviour (crackers were dipped more than once per cracker, n 23; crackers were dipped once per cracker, n 9; only finger-shape crackers were dipped more than once per cracker, n 8; and only flat squares were dipped more than once per cracker, n 3) that consumed crackers with cheese dip ad libitum. Multiple factor analysis was performed on four different datasets (intake, oral processing behaviour, dipping behaviour) that are presented in different colours. The individuals map (groups differing in dipping behaviour) is shown on the left, and the variables map (parameters) is shown on the right. The different parameters are explained in Table 1. Pictures of crackers varying in shape are presented for illustration purposes, and the dotted lines represent two or multiple dips per cracker. ![]() , Intake;
, Intake; ![]() , food oral processing;
, food oral processing; ![]() , dipping.
, dipping.
Appetite and hedonic ratings
Hunger ratings decreased from 60 (sem 1) to 24 (sem 1) points (F 1,350 = 315·42, P < 0·001), fullness ratings increased from 36 (sem 2) to 70 (sem 2) points (F 1,350 = 244·79, P < 0·001) and thirst ratings decreased from 50 (sem 2) to 35 (sem 2) points (F 1,350 = 43·73, P < 0·001) during the snacking session. Ratings of hunger, fullness and thirst both before and after the snack session did not differ between the different cracker–cheese combinations (Table 3).
Table 3. Appetite (A) and hedonic (B) ratings before and after the snack session
(Mean values with their standard errors)
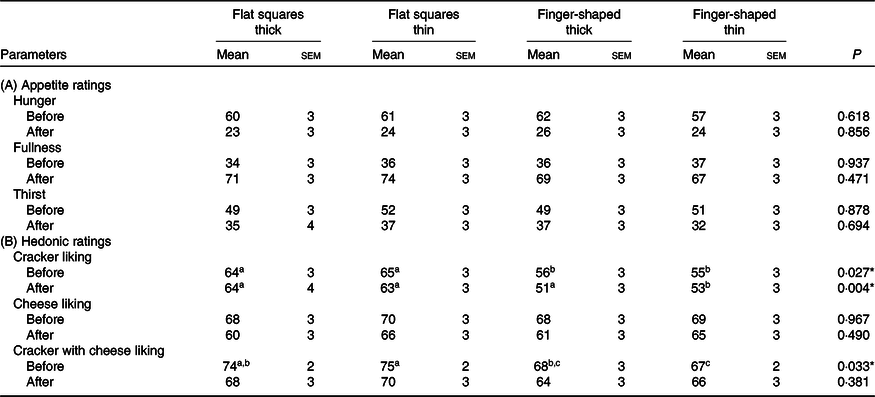
a,b,c Unlike superscript letters indicate significant differences between cracker–cheese combinations (least significant difference post hoc, P < 0·05).
* Significant (P < 0·05).
Overall, the crackers with cheese dip combinations were rated as positively pleasant (i.e. 64 (sem 3) to 75 (sem 2) points on a 100-point visual analogue scale), and the hedonic ratings after the snack session did not differ among the four combinations (F 3,172 = 1·03, P = 0·38) (Table 3).
The four video episodes were equally liked by consumers (F 3,172 = 1·09, P = 0·20), and the type of episode did not affect eating behaviour nor intake (P > 0·05).
Discussion
Cheese dip intake was substantially influenced by the shape of cracker it was combined with. Flat-squared crackers led to a 15 % higher cheese intake (13·2 g, 131 kJ) than finger-shape crackers. This effect of cracker shape on ad libitum cheese intake can be explained by a difference in dip size, as the flat squares were consumed with 26 % more cheese dip. The flat squares have a 41 % larger surface area than the finger-shape crackers, which makes it easier to scoop more cheese on the cracker leading to a larger bite size. Participants unconsciously consumed more cheese with flat-squared crackers than with finger-shape crackers and, most importantly, they do this without differences in self-reported fullness. This is in line with another study, which compared spoon and fork users, showing that spoon users ate faster leading to higher food intake than fork users, probably because more food fitted on a spoon than on a fork(Reference Bolhuis and Keast34). In general, larger bite sizes are associated with an underestimated, increased food intake by consumers(Reference Zijlstra, De Wijk and Mars9,Reference Bolhuis, Lakemond and de Wijk35,Reference Weijzen, Smeets and de Graaf36) . The present results show that by solely changing the shape of a single food, one can regulate food intake of food composites without changing liking for the food. This has important implications for future snack design since modifications of food shape are easy to implement by the food industry, and foods do not require ingredient reformulation while product liking is maintained.
Cracker intake was not influenced by cracker shape nor cheese viscosity in the present study, when crackers were consumed with cheese. Participants steadily consumed 28 (sem 1) crackers throughout a snacking event of 30 min. Also the number of bites and thereby cracker bite size remained constant (on average: 46 (sem 2) bites). It may be that consumers apply a certain habitual consumption effort (i.e. reaching for a cracker, taking a bite) that results in certain familiar intake. Likewise, others found that consumers applied an almost equal number of bites in different yogurt-granola conditions(Reference Mosca, Torres and Slob23). Several studies suggest that intake can be influenced by a small difference in consumption effort. For example, intake was lower when snack foods were served as smaller nibbles compared with that of large bars(Reference Weijzen, Liem and Zandstra30). Similarly, children consumed a lower amount of diced carrots than whole carrots(Reference Goh, Russell and Liem19,Reference Liem and Russell20) . In both cases, intake was lower when consumers had to consume the foods into more smaller bites (increased effort). Apparently, consumers use a constant, habitual consumption effort before they terminate snacking (see also Fig. 2). In case of the present study, cheese intake was influenced by modification of cracker shape. In contrast to previous studies(Reference Goh, Russell and Liem19,Reference Liem and Russell20,Reference Weijzen, Liem and Zandstra30) , the crackers differed in shape but had the same weight per piece. Therefore, our study demonstrates that snack intake can be modified without changing convenience or consumption effort of the consumer. Such knowledge can be applied in future snack development.
Cheese viscosity was also expected to influence bite size, as viscosity can change the ease at which it can be scooped onto the crackers and/or the ease of safe-to-swallow bolus formation. However, cheese viscosity did not affect intake, food oral processing behaviour nor dipping behaviour of crackers with cheese dip. To be able to dip crackers into the cheese, the cheese dips could not be too solid nor too liquid. Consequently, the viscosity range was relatively small. We suggest that the difference in viscosity might not have been large enough to affect eating behaviour and intake (viscosity differed with a factor 2). Even though differences in viscosity were instrumentally present and perceived by 74 % of the participants, the difference in viscosity was apparently too small to affect oral exposure time, eating rate and subsequent intake of the crackercheese combinations. Similarly, Mosca et al. showed that a yogurt viscosity that differed with a factor of 1·5 to 2 did not affect ad libitum intake of yogurt with granola(Reference Mosca, Torres and Slob23). In previous studies where a viscosity effect on oral exposure time, eating rate and/or intake was observed, products were used with much larger viscosity differences (e.g. liquid, semi-liquid v. semi-solid milk-based products; carrier foods combined with cheese spread v. mayonnaise)(Reference de Wijk, Zijlstra and Mars15–Reference Zijlstra, Mars and De Wijk17,Reference van Eck, Hardeman and Karatza21,Reference Tarrega, Marcano and Fiszman37) . For example, Zijlstra et al. reported that the viscosity differed with a factor of 9(Reference Zijlstra, Mars and De Wijk17). Apparently, the difference in viscosity should be large enough to be able to affect oral processing behaviour, eating rate and intake.
In our experimental settings, participants were free to choose their own way of consumption (Fig. 3), which resulted in large differences in eating/dipping behaviour and intake between participants. Most participants (52 %) dipped the cracker into the cheese, bit part of the cracker and dipped the remaining part of cracker into the cheese once more (more-than-once-biters), whereas others (20 %) dipped each cracker once and consumed it at once (only-once-biters). Interestingly, such differences in biting and dipping behaviour impacted total food intake considerably. Multiple dipping led to less cheese per cracker compared with one dip per cracker (3·3 (sem 0·2) v. 2·3 (sem 0·1) g). Those who consumed one dip per cracker showed higher intakes for crackers (87 (sem 9) v. 55 (sem 3) g) and cheese (111 (sem 11) v. 86 (sem 7) g). This implies that taking smaller bite sizes slows down eating rate and reduces energy intake, in agreement with other studies(Reference Zijlstra, De Wijk and Mars9,Reference Bolhuis and Keast34–Reference Weijzen, Smeets and de Graaf36,Reference James, Maher and Biddle38,Reference Mishra, Mishra and Masters39) .
Although large differences were observed between different participants, dipping behaviour per participant remained relatively constant throughout a snacking session of 30 min. The amount of cheese dipped on a cracker did not differ between the beginning and end of consumption. Although one could expect that consumers add less cheese to the cracker with increasing snacking time as a result of satiation or sensory specific satiety, this was not the case. One can also argue the other way around, that consumers add more cheese with increasing snacking as a result of product liking. However, this was also not the case. Bite sizes remain constant throughout the snacking episode, and consumers use their own standardised dip size and dipping strategy until they terminate snacking.
This study explored the effect of cracker shape and cheese viscosity on ad libitum snack intake of cracker–cheese combinations when the cracker was dipped into the cheese. Although crackers are frequently consumed with cheese, they can also be consumed with other dips, spreads or toppings (e.g. butter, hummus, jam, hazelnut-cocoa spreads). In the past few years, several composite snacks became commercially available that are designed to be consumed ‘on the go’ by dipping crackers into spreads (i.e. Cheez Dippers®, Groupe Bel; Nutella & Go!®, Ferrero). We speculate that the effect of cracker shape on snack intake can be generalised towards other spreads. Changing cracker shape affects cracker surface area, so that a larger amount of spread can adhere to crackers with increased surface area leading to a higher energy intake. We speculate that this mechanism holds for a variety of spreads. When spreads are applied to crackers using a knife (spreading instead of dipping), a larger amount of spread can adhere on a cracker with increased surface area. This is of particular relevance, as dips, spreads and toppings are generally high in energy, fat and/or sugar(Reference de Graaf27). Therefore, changing carrier shape could be a promising approach to reduce intake of such less desirable nutrients.
The results of this study show that food intake can easily be reduced by changing food shape. However, a limitation of the present study was the measurement of ad libitum intake for one type of snack product only (i.e. cracker with cheese) and in a laboratory setting. We speculate that the effect of shape on food intake can be generalised towards a majority of composite food combinations. Changes in shape that affect the surface of carrier are expected to influence the amount of toppings, sauces, spreads or condiments consumed. Changing food carrier shape in a way that creates less surface per g will (unconsciously) lead to lower amounts of mostly energy dense condiments and sauces. More research is needed if this can be translated to meals as well, with for example French fries or pasta. The advantage of simply changing the shape of a carrier food is that producers do not have to change the ingredients nor the recipe so that sensory perception and liking are probably maintained. Therefore, modifying food shapes seems to be a promising strategy to unconsciously affect food and energy intake. This can be a particularly effective strategy to target unrestrained consumers which are not actively looking at moderating their energy intake.
Acknowledgements
The authors would like to thank Cees Heddes and Stefano Renzetti for their help in the development of the cracker recipe, Olivier Schranz and Clarisse Mandegou for the preparation of all cheese dips and Els Siebelink for her help regarding the standardised lunch sessions.
The project is funded by TiFN, a public–private partnership on precompetitive research in food and nutrition. The public partners are responsible for the study design, data collection and analysis, decision to publish and preparation of the manuscript. The private partners have contributed to the project through regular discussion. The private partners are Royal Friesland Campina, Fromageries Bel and Unilever. This research was performed with additional funding from the Top Consortia for Knowledge and Innovation of the Dutch Ministry of Economic Affairs.
The authors’ responsibilities were as follows: A. v. E., B. G., E. S., V. F., D. B. and M. S. designed research; A. v. E., A. v. S. and D. A. conducted research; A. v. E., A. v. S. and D. A. analysed data and A. X., P. G. Y. and A. v. E., B. G., E. S., V. F., D. B. and M. S. wrote the paper. A. v. E. and D. B. had primary responsibility for final content. All authors read and approved the final manuscript.
The authors declare that there are no conflicts of interest.


