


The ‘Southern’ dietary pattern is a dietary pattern derived from factor analysis within the REasons for Geographic And Racial Disparities in Stroke (REGARDS) cohort. This dietary pattern is characterised by high consumption of added fats, fried food, eggs and egg dishes, organ meats, processed meats and sugar-sweetened beverages(Reference Judd, Letter and Shikany1). Prior studies have shown that increased adherence to the Southern dietary pattern is associated with a higher risk of incident stroke(Reference Judd, Gutierrez and Newby2), CHD(Reference Shikany, Safford and Newby3), sepsis(Reference Gutierrez, Judd and Voeks4), end-stage renal disease and chronic kidney disease(Reference Gutierrez, Muntner and Rizk5), cancer mortality(Reference Akinyemiju, Moore and Pisu6) and cognitive impairment(Reference Pearson, Wadley and McClure7). Furthermore, this dietary pattern is a large mediator of the black–white difference in stroke risk(Reference Judd, Gutierrez and Newby2) and is the largest mediator of the black–white difference in the risk of incident hypertension(Reference Howard, Cushman and Moy8). Characteristics of those most likely to adhere to the Southern dietary pattern remain unclear.
Adherence to particular dietary patterns is influenced by numerous social, economic and environmental factors(Reference Bautista-Castano, Molina-Cabrillana and Montoya-Alonso9–Reference Epstein, Sherwood and Smith16). These include sex(Reference Bautista-Castano, Molina-Cabrillana and Montoya-Alonso9), age(Reference Bautista-Castano, Molina-Cabrillana and Montoya-Alonso9,Reference Tinker, Rosal and Young10,Reference McCabe-Sellers, Bowman and Stuff14) , race(Reference Allen, Kuczmarski and Evans12,Reference McCabe-Sellers, Bowman and Stuff14,Reference Epstein, Sherwood and Smith16) , education(Reference Tinker, Rosal and Young10,Reference Fransen, Boer and Beulens11,Reference McCabe-Sellers, Bowman and Stuff14,Reference Raffensperger, Kuczmarski and Hotchkiss15) , socio-economic stability(Reference Bhattacharya and Currie13,Reference Raffensperger, Kuczmarski and Hotchkiss15) and food security(Reference Bhattacharya and Currie13). Additionally, clinical factors, such as BMI(Reference Bautista-Castano, Molina-Cabrillana and Montoya-Alonso9,Reference Aggarwal, Liao and Allegrante17) , waist circumference(Reference Aggarwal, Liao and Allegrante17,Reference Downer, Gea and Stampfer18) , depression(Reference Aggarwal, Liao and Allegrante17) and physical inactivity(Reference Aggarwal, Liao and Allegrante17,Reference Downer, Gea and Stampfer18) , influence diet adherence. Evidence for these associations has involved well-studied dietary patterns including the Mediterranean diet, Dietary Approaches to Stop Hypertension diet and diet-quality measures such as the Healthy Eating Index. Factors describing groups in the population with a high adherence to other dietary patterns, such as the Southern dietary pattern, have not been described.
Given that adherence to the Southern dietary pattern is associated with higher risk of many adverse health outcomes and is a contributor to the black–white differences in several of these outcomes, identifying subgroups of the population with a high intake of the diet may provide actionable targets for intervention. Therefore, the aim of the present study was to identify population groups with a high adherence to the Southern dietary pattern.
Methods
Study participants
REGARDS is a longitudinal cohort study designed to examine the reasons for racial and regional differences in stroke mortality. Details of the study design are provided elsewhere(Reference Howard, Cushman and Pulley19). Briefly, 30 239 black and white adults ≥ 45-years old were recruited between 2003 and 2007 using commercially available lists from Genesys, Inc. The study oversampled individuals who were black and residents of the Southeastern US, an area known as the stroke belt (includes Louisiana, Arkansas, Mississippi, Alabama, Tennessee, Georgia, North Carolina and South Carolina) and specifically within the stroke ‘buckle’ region along the coastal plains of North Carolina, South Carolina and Georgia. Participants were first contacted through an introductory mailing to inform them of an upcoming phone call. REGARDS staff conducted a 45-min phone call to recruit the participant, obtain verbal informed consent and collect demographic, socio-economic and medical history data. Approximately 2–3 weeks after the phone call, an in-home visit was conducted by a trained health professional to obtain written consent and collect anthropometrics, blood and urine specimens, blood pressure measurements, an electrocardiogram and medication history. During the in-home visit, a self-administered questionnaire was provided to collect data on dietary intake, residential history and family history of selected diseases. This study was conducted according to guidelines in the Declaration of Helsinki, and all procedures involving human subjects were approved by the Institutional Review Board at all participating universities. Verbal and written informed consent was obtained from all participants.
Dietary assessment
The Block 98 FFQ was included as part of the baseline self-administered questionnaires that were left with participants. The Block 98 FFQ was developed by Block Dietary Data Systems, distributed by NutritionQuest and validated in populations similar to REGARDS(Reference Block, Woods and Potosky20,Reference Caan, Slattery and Potter21) . The questionnaire includes more than 150 multiple-choice questions based on 107 food items and can be completed in about 30–40 min. Participants were asked to recall usual dietary intake from the past year and mail the completed form along with the other questionnaires to the REGARDS coordinating centre.
Dietary pattern derivation
As previously reported, usable FFQ data from the baseline FFQ were available for 21 636 paricipants(Reference Judd, Letter and Shikany1). A total of fifty-six food groups were constructed based on culinary use and nutrient similarity as in similar studies(Reference Newby22). For example, beverages containing only some juice, such as Hi-C, were grouped with sugar-sweetened beverages based on nutritional content. Similarly, other foods, including fried potatoes, fish and chicken, were separated into a different group because of nutritional content and likely differences in culinary use across race and geographically defined populations. Other items, such as ‘Chinese food,’ were left in stand-alone groups due to their uniqueness. Principal component analysis was used to derive dietary patterns. An eigenvalue cutpoint of approximatley 1·5 was employed, based on scree plots and interpretability of the derived factors. A five-factor solution was selected to provide optimal congruence across region, sex and race. Final factor loadings were derived using factor analysis with orthogonal rotation. Patterns were empirically named based on foods that loaded highly in each factor by consensus of the investigators. One of the patterns identified was the ‘Southern pattern,’ named because of high loadings in added fats, fried food, eggs and egg dishes, organ meats, processed meats and sugar-sweetened beverages, foods sometimes associated with a traditional diet consumed in the Southeastern US (Table 1). Other patterns comprised the ‘convenience pattern,’ ‘plant-based pattern,’ ‘sweets/fats pattern’ and ‘salads and alcohol pattern.’ As noted above, the Southern dietary pattern subsequently was found to be associated with higher risk of an array of health outcomes and a substantial potential contributor to black–white disparities and as such is the focus of this report.
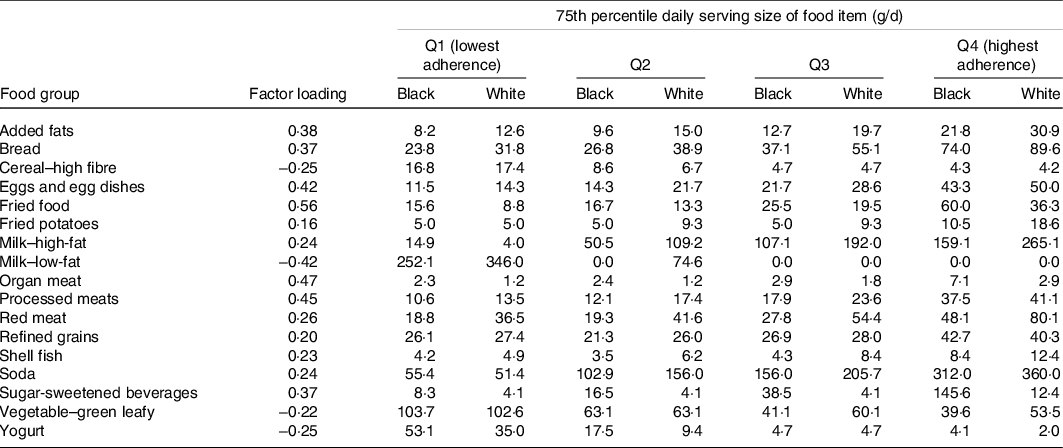
Table 1 Final factors loadings and 75th percentile of daily g/d of food groups making up the southern dietary pattern (showing only those with absolute value > 0·20 for simplicity)
Risk factors of interest
Risk factors were based on baseline measurements and classified as in prior REGARDS studies(Reference Judd, Gutierrez and Newby2–Reference Gutierrez, Muntner and Rizk5,Reference Pearson, Wadley and McClure7,Reference Howard, Cushman and Pulley19,Reference Gray, Wang and Martin23) . Self-reported variables were age (continuous, in years), race (black/white), sex (male/female), region of residence (stroke belt and stroke buckle v. non-belt/buckle), income (≤$75 K/year v. >$75 K/year), current smoker (yes v. no) and education (high school graduate or less v. some college or more). Physical activity, also self-reported, was assessed as the number of times per week participants engaged in exercise enough to work up a sweat (none v. some). Height, weight, waist circumference and blood pressure were measured during the in-home visit by a trained examiner. BMI was calculated as weight in kg divided by height in metre squared, (kg/m2). Hypertension was defined as a systolic blood pressure ≥140 mmHg and/or a diastolic blood pressure ≥90 mmHg or a self-report of a prior diagnosis of hypertension or current use of anti-hypertensive medications. Diabetes was defined as a fasting blood glucose concentration of ≥126 mg/dl or a non-fasting blood glucose concentration of ≥200 mg/dl or a self-reported use of insulin or oral anti-glycaemic agents. Geographical covariates were census tract level and determined with United States Department of Agriculture data. These data included living in a food desert (yes v. no), neighbourhood disadvantage (yes v. no) and residence in rural or urban areas (rural v. urban). These data were then linked to participant residence via geocoding, methods described elsewhere(Reference Dutko, Michele and Farrigan24,Reference Gray, Lakkur and Howard25) .
Statistical analyses
The outcome of interest was a participant’s adherence to the Southern dietary pattern, as quantified by the loading score from the factor analysis. The score was a continuous scale, with a range of −4·5 to 8·2 (mean = −0·001, sd = 1·0), with higher scores indicating greater adherence to the dietary pattern. χ 2 and ANOVA tests were used to assess unadjusted means of demographic characteristics by quartile of Southern dietary pattern score. Multivariable linear regression was used to calculate standardised beta coefficients across all covariates for the entire sample and then stratified by race and region (stroke belt/stroke buckle v. non-belt/buckle). The standardisation of the estimated regression coefficients was to allow an easy comparison of the differences in the strength of the associations across the different predictor variables. Specifically, differences in Southern diet score are expressed as the number of standard deviation difference associated with the factor, hence, between groups for dichotomous variables and per standard deviation for continuous variables (age, BMI and waist circumference). Unadjusted and fully adjusted coefficients were calculated to compare the impact of adding additional covariates to the model. Covariates included in the final model were chosen because they have previously been shown to be associated with other dietary patterns(Reference Epstein, Sherwood and Smith16,Reference Downer, Gea and Stampfer18,Reference Zazpe, Estruch and Toledo26–Reference Morland and Wing28) . Multicollinearity was not a problem, and variance inflation factor was checked for all variables. In order to account for multiple testing, a P-value of < 0·01 was considered statistically significant. Analyses were performed using SAS 9.4 (SAS Institute Inc.).
Results
Of the 30 239 participants, fifty-six had data anomalies (incomplete or unusuable forms, other than the FFQ, due to being damaged), 8547 (28 %) had missing dietary data or implausible energy intakes and 4855 (16 %) were missing risk factors of interest, leaving an analytical sample of 16 781 participants (Fig. 1). Among these participants, 34·6 % were black, 45·6 % male, 55·2 % resided in stroke belt region and the average age was 65 years. Online Supplementary Table S1 provides demographic characteristics of included and excluded participants. Briefly, those excluded were more likely to be black, have a high school education or below, have an income of <$75 K/year, live in a food desert and reside in a disadvantaged neighbourhood.
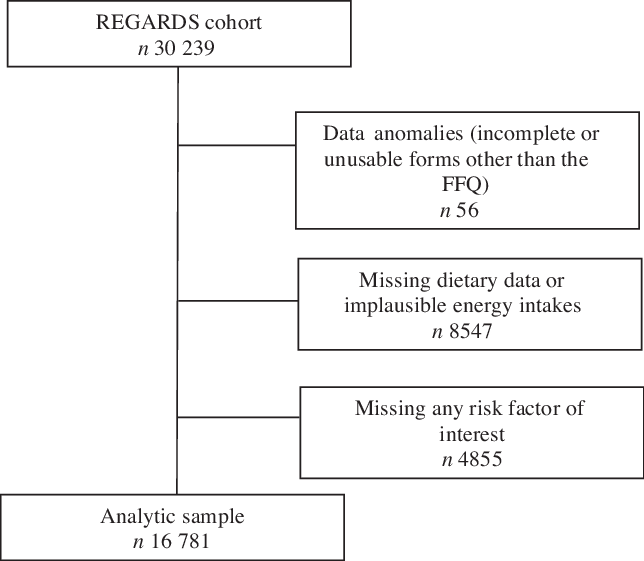
Fig. 1 Participant selection.
Stratification of daily intake for food groups making up the Southern dietary pattern allowed for observation of racial differences in dietary intake (Table 1, online Supplementary Table S2). Black participants in the highest quartiles of Southern pattern adherence consumed higher amounts of fried foods, organ meats and sugar-sweetened beverages compared with white participants. Fried food intake in black participants in the fourth quartile was close to double the intake in white participants (60 g/d v. 36 g/d, respectively). Consumption of organ meats (liver, gizzard, neckbones and chitlins) for black participants in the fourth quartile was triple the intake of white participants (7·1 g/d v. 2·9 g/d, respectively). Sugar-sweetened beverage intake among black participants in the highest quartile of Southern dietary pattern adherence was 145·6 g/d and 12·4 g/d for white participants. White participants in the highest quartile of Southern dietary pattern adherence reported higher consumption of high-fat milk and red meat. High-fat milk intake for white participants was 265 g/d (approximately 1 cup) and 160 g/d for black participants (approximately 0·68 cups). White participants in the highest quartile of adherence consumed almost double the amount of red meat compared with black participants (80 g/d v. 48 g/d, respectively).
Baseline characteristics of participants by quartile of Southern diet score are shown in Table 2. Those least adherent to the Southern dietary pattern appear in the first quartile, while those most adherent in the fourth quartile. The following characteristics were associated with greater adherence to the Southern diet pattern: black race, male sex, residence in stroke belt region, lower education level, lower income, current smoker, residence in a food desert, living in a disadvantaged neighbourhood, physical inactivity, higher BMI, higher waist circumference, history of hypertension and history of diabetes (P < 0·0001). Residence in a rural region was the only covariate not associated with Southern diet score (P = 0·23).
Table 2 Baseline characteristics by quartile (Q) of southern diet score in the REasons for Geographical and Racial Differences in Stroke (REGARDS) Study
(Numbers and percentages; ranges)
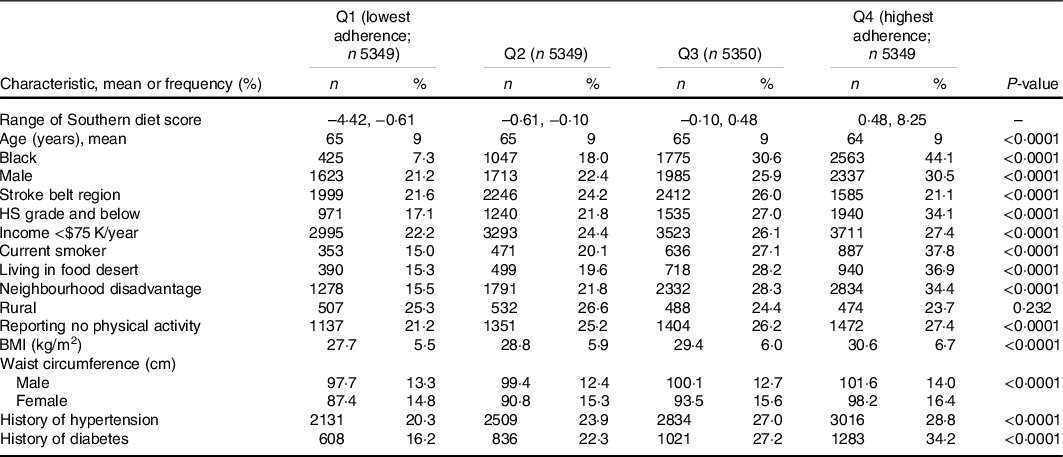
HS, high school.
Linear regression results are shown in Table 3. With the exception of residence in a rural region (P = 0·08), all factors were significant (P < 0·0001) in each unadjusted model. After fully adjusting each model for all other risk factors, residence in a rural region became significant (P = 0·0009) and all other covariates, except for living in a food desert (P = 0·037), remained significant. The magnitude of the association with adherence to the Southern dietary pattern was highest for race (Δ = 0·76 sd, P < 0·0001), followed by sex (Δ = 0·4 sd, P < 0·0001) and smoking status (Δ = 0·3 sd, P < 0·0001).
Table 3 Results from linear regression models investigating factors associated with a Southern dietary pattern* (β-coefficients)
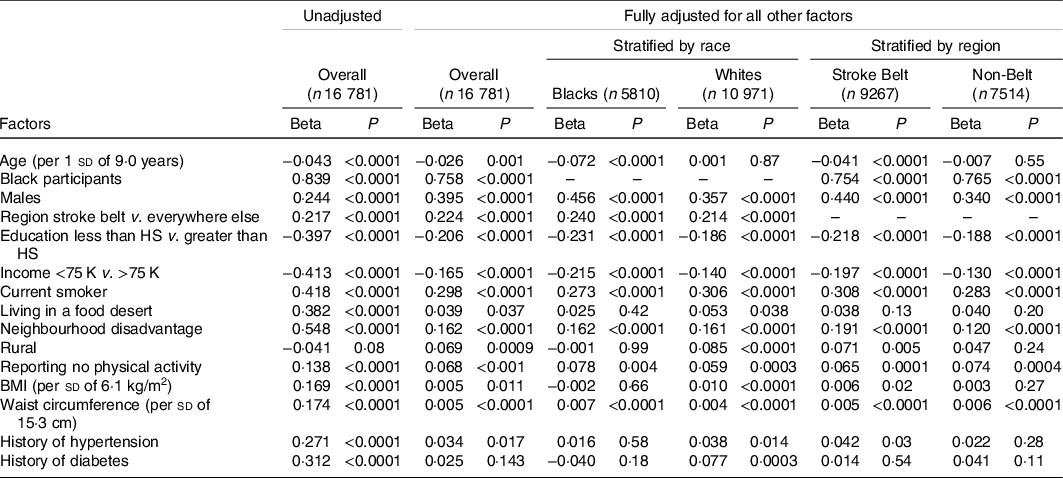
*HS, high school.
* As the Southern diet score is a standardised factor (mean of 0·0, sd of 1·0), beta coefficients can be interpreted as the number of standard deviation difference associated with the factor (i.e. between groups for dichotomous predictors and per standard deviation for continuous predictors). Fully adjusted model adjusts for all other variables.
As the focus of REGARDS is on racial and geographic disparities, the data were stratified by both race and region (Table 3). For both black and white participants, male sex, residence in the stroke belt, being a current smoker, living in a disadvantaged neighbourhood, reporting no physical activity and having a greater waist circumference were all associated with greater adherence to the Southern dietary pattern. Of these, sex had the highest magnitude of association with Southern dietary pattern adherence (Δ = 0·46 sd, P < 0·0001 and Δ = 0·36 sd, P < 0·0001, for black participants and white participants, respectively). Having more than a high school education level and an income >$75 K were both associated with being less adherent to the Southern dietary pattern for both black and white participants, with education level having the stronger magnitude of association (Δ = –0·23 sd, P < 0·0001 and Δ = –0·19 sd, P < 0·0001, for black participants and white participants, respectively). For black participants only, older age was significantly associated with being less adherent to the Southern dietary pattern. Residence in a rural region and higher BMI were only associated with greater pattern adherence in white participants. Additionally, for white participants only, history of hypertension and history of diabetes were both associated with greater adherence to the Southern dietary pattern.
In both the stroke belt region and elsewhere, black race, male sex, being a current smoker, living in a disadvantaged neighbourhood, reporting no physical activity and greater waist circumference were all associated with greater adherence to the Southern dietary pattern. Having greater than a high school education level and an income >$75 K were associated with less adherence to the dietary pattern in both regions. Only in the stroke belt region, older age was associated with less adherence to the Southern dietary pattern and residence in a rural region, higher BMI and history of hypertension were associated with greater pattern adherence. History of diabetes and living in a food desert were not associated with Southern diet pattern adherence in either the stroke belt or non-belt region.
Discussion
In this study, characteristics of individuals with a higher intake of the Southern dietary pattern were identified. Despite the diet being referred to as the ‘Southern Diet’, the single factor with the largest separation of diet adherence was race. Further, the high intake of the diet by the black population was relatively consistent in both stroke belt and non-stroke belt regions. This substantial racial difference in the diet is a major contributor to the previously reported mediation of the black–white difference in stroke risk(Reference Judd, Gutierrez and Newby2) and risk of incident hypertension(Reference Howard, Cushman and Moy8). Adherence to this dietary pattern was also higher for men, those with a lower education and income level, those who reside in a food desert and/or disadvantaged neighbourhood, current smokers, those who are physically inactive and those with higher BMI and waist circumference.
Previously, education and income have been associated with diet intake and quality, with higher income households and those with greater education being more likely to adhere to higher quality diets (those with greater servings of fresh fruits and vegetables and less energy from solid fats, alcoholic beverages and added sugars)(Reference McCabe-Sellers, Bowman and Stuff14,Reference Raffensperger, Kuczmarski and Hotchkiss15,Reference Shimakawa, Sorlie and Carpenter27) . Higher quality diets also have higher costs, with income being a consistent predictor of diet intake(Reference Rehm and Monsivais29,Reference Diez-Roux, Nieto and Caulfield30) . Several of the foods comprising the Southern dietary pattern are high in energy from solid fats and added sugars, and the pattern is low in fresh fruits and vegetables. Our results are consistent with these findings, in that low education and low income were associated with greater adherence to the Southern dietary pattern.
Similarly, residence in a food desert and disadvantaged neighbourhood are both environmental factors that directly affect the cost and availability of foods to an individual, thereby influencing dietary patterns followed(Reference Morland and Wing28,Reference Diez-Roux, Nieto and Caulfield30) . Disadvantaged or lower income neighbourhoods often have less access to diverse food selections, and residence in these areas has been associated with decreased intake of fruits, vegetables and fish and increased intake of less healthy meats such as processed meats(Reference Diez-Roux, Nieto and Caulfield30,Reference Morland, Wing and Diez Roux31) . Fresh foods can often take more time to prepare, and those living in disadvantaged neighbourhoods often work many jobs. This presents a complex issue of availability, affordability and time. Consequently, this can contribute to diets low in fruits and vegetables and high in energy from processed foods and saturated fat(Reference Diez-Roux, Nieto and Caulfield30), which is consistent with the foods found within the Southern dietary pattern.
We observed large differences in Southern dietary pattern adherence between black participants and white participants (stroke belt Δ = 0·75 sd, non-belt Δ = 0·77 sd). In contrast, the differences between the stroke belt and non-stroke belt were smaller regardless of race (black participants Δ = 0·24 sd, white participants Δ = 0·21 sd). As such, the differences between black participants and white participants (regardless of region) dominate the differences between regions (regardless of race). This suggests that black participants in the stroke belt are just as likely to adhere to this dietary pattern as black participants in the non-stroke belt. It also suggests that residents of the stroke belt consume more of the Southern dietary pattern regardless of race. The racial differences in daily intake of several of the foods prominent in the Southern dietary pattern reinforce this observation.
Large, but similar, differences in Southern dietary pattern adherence were observed between males and females for both race and region. The difference in adherence between males and females was larger among black participants than white participants (black participants Δ = 0·46 sd, white participants Δ = 0·36 sd). Additionally, the difference was larger for participants in the stroke belt compared with participants in the non-belt (stroke belt Δ = 0·44 sd, non-belt Δ = 0·34 sd).
One of the greatest strengths of this research is that the study was conducted in a large sample of geographically dispersed adults, with detailed measurement of covariates using standardised methods. Additionally, oversampling of black participants and residents from the southeastern US allowed a unique opportunity to investigate socio-demographic and geographical predictors of a Southern diet pattern. However, limitations must also be considered. The study relied on FFQ data, increasing the chances for error in individual dietary reporting. Those who did not return the FFQ or had implausible data were more likely to be black, which could bias the results. Furthermore, although several covariates were adjusted for, other confounding variables from unmeasured health and lifestyle factors linked with diet cannot be excluded. Finally, as a cross-sectional study, causality cannot be inferred.
In conclusion, in this national US sample, we demonstrated that the characteristic associated with strongest adherence to the Southern dietary pattern was black race compared with white race, and this was consistent regardless of residential region and other factors. Racial differences were observed in daily intake of foods making up the Southern diet pattern, with black participants consuming greater amounts of fried foods, organ meats and sugar-sweetened beverages compared with white participants. These findings reinforce the role of race in dietary pattern adherence and underscore the need for nutrition interventions in predominantly black communities. Future research should focus on the development and delivery of nutrition interventions and understanding of barriers to healthy eating in these communities and the impact of these interventions on the development of chronic diseases.
Acknowledgements
The authors thank the other investigators, the staff and the participants of the REGARDS study for their contributions. This study was supported by cooperative agreement U01NS041588 from the National Institute of Neurological Disorders and Stroke, National Institutes of Health, Department of Health and Human Services. The content is solely the responsibility of the authors and does not necessarily represent the official views of the National Institute of Neurological Disorders and Stroke or the National Institutes of Health. The first author was supported by award number T32HL105349 by the National Heart, Lung, and Blood Institute of the National Institutes of Health.
C. A. C. wrote the manuscript. S. E. J. acquired the data, supervised data analysis and contributed to the writing and reviewing of the manuscript. M. S. G. analysed the data and contributed to the writing and reviewing of the manuscript. J. M. S., V. J. H., G. H., D. L. L., J. J. M., M. C., N. A. Z., K. E. P. and E. B. L. contributed to the writing and reviewing of the manuscript.
The authors have nothing to disclose.
Supplementary material
For supplementary material referred to in this article, please visit https://doi.org/10.1017/S0007114521000696


 Open access