


Toxic elements, including metals and metalloids, demonstrate an undesirable effect on the environment and living organisms. Some of them are dangerous even in trace amounts (Pb, Hg, Cd and As), while others at low concentrations are essential to maintain the physiological and biochemical functions of living organisms (e.g. Fe, Cr, Cu and Zn)(Reference Koller and Saleh1). Since these elements (or their excessive amounts) cannot be included in metabolic processes, they build up in selected human tissues and are only partially excreted (in adipose tissue, liver, kidneys, hair and urine).
The human body, especially children, is exposed to the adverse effects of toxic elements caused by their natural occurrence in high amounts in some geographical regions of the earth’s crust. Furthermore, this problem is increasing as a consequence of industrial development without the application of environmentally friendly technologies. The economies of mainly developing countries such as Madagascar have been struggling with this type of problem. The Lancet Commission on Pollution and Health(Reference Landrigan, Fuller and Acosta2) reported that environmental pollution was responsible for 22·3 % of all deaths in Madagascar. Because of the low industrialisation, for many years Africa was considered safe from heavy metal pollution. However, the beginning of the 21st century showed that pollution had increased drastically, probably as a result of urbanisation processes and intensive and predatory exploitation of natural resources(Reference Yabe, Ishizuka and Umemura3). The problem also affects the urban community of Antananarivo, one of the main industrial centres of Madagascar. Huge landfill without water treatment or containment system, located in the distance of 10 km from the city centre, exacerbates the environmental pollution in this area(4). Although there is limited information on the Madagascar pollution with heavy metals and metalloids, it has been confirmed that the high mortality on the island is caused by these factors(Reference Landrigan, Fuller and Acosta2).
The interference of malnutrition and environmental pollution and their impact on young Malagasy may cause even worse health problems for this population. Malnutrition is a consequence of the country’s underdeveloped economy. The source of income for most Malagasy people is agriculture (rice, cassava and sweet potato cultivation). Ninety-two per cent of the Malagasy population lives on less than US $ 1·90 a day. Madagascar is a third-world country where malnutrition and environmental pollution is at the top of the list of factors contributing to death or disability(5). Lack of nourishment affects the whole country and acute malnutrition afflicts 6 % of children under 5 years of age and in many regions is even higher(6), accounting for 83 % of all deaths in infants and children under 5 years of age. It is one of the most serious health problems in Madagascar(7), and many public organisations around the world are involved in feeding programmes for Malagasy children.
To study the Malagasy girls’ exposure to toxic elements, analyses of the concentration of Al , As, Cd, Cr, Hg, Pb, Ni, Sn and Sb in their hair were conducted. As, Pb, Hg, Cd and Cr are usually considered the most toxic elements for the human body. Moreover, Sb, Sn, Ni and Al are significant pollutants of African countries, and their chronic toxicity to the human body has been literature confirmed(Reference Saerens, Ghosh and Verdonck8–Reference Genchi, Carocci and Lauria15).
The Environmental Protection Agency noted hair analysis as being an important marker of the long-term exposure of the human body to the action of heavy metal ions(Reference Rashed and Hossam16). It is convenient for sampling, transport and storage compared with physiological fluids and other tissues (e.g. blood, urine or saliva). Thus, hair is considered in biomedical sciences as a tissue which reflects the metabolism of certain elements in the human body(Reference Trojanowski, Trojanowski and Antonowicz17,Reference Liang, Pan and Liu18) . Moreover, it is suggested that soil and air samples do not provide reliable data for the assessment of the health hazard caused by environmental contamination. The reason is high variability of metal concentration over time(Reference Liang, Pan and Liu18,Reference Srogi19) .
The data on the occurrence of dangerous metals and metalloids in Malagasy girls’ hair have not been reported in scientific papers. The following elements showing potential toxicity were selected in the studies: Al, As, Cd, Cr, Hg, Pb, Ni, Sb and Sn. The analysis of the nutritional status of girls and its impact on toxic metal accumulation in hair increases the scientific value of the study. Presented study analysed the above-mentioned relation for two differently economically developed (industrial and rural) regions.
Study sample and methods
Study design
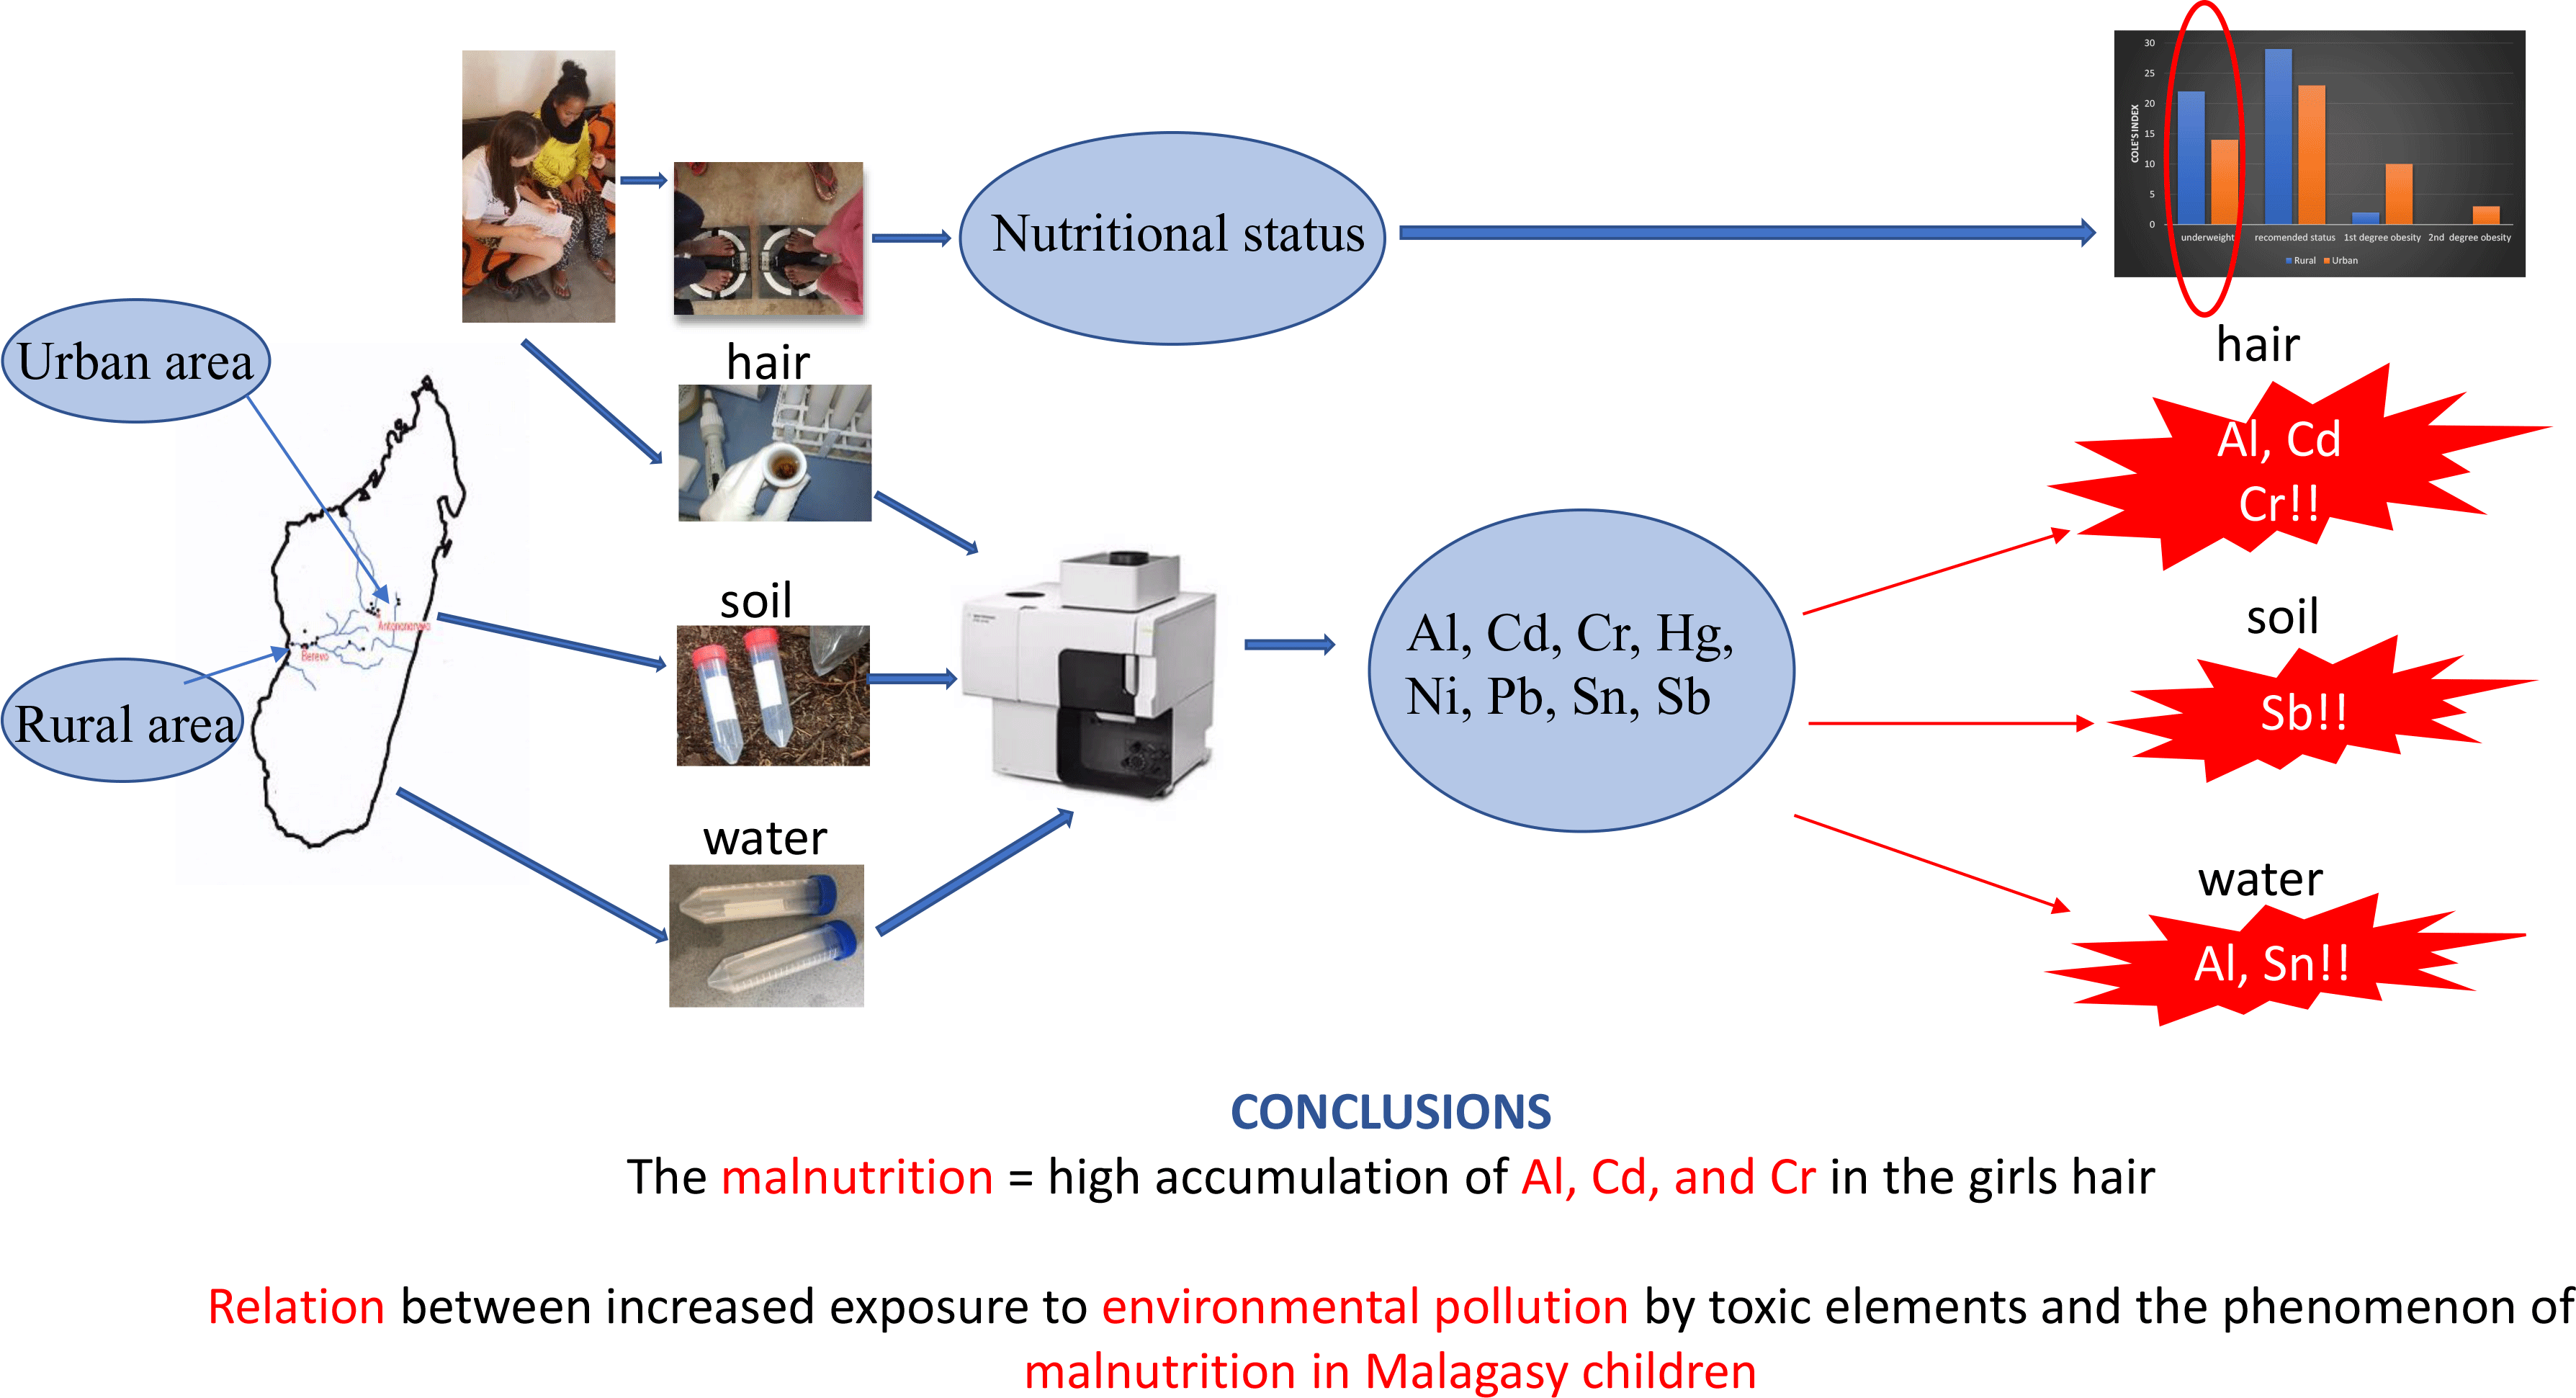
The study was conducted in Madagascar in autumn 2018 and involved a total of 103 girls aged 8–15 years from 2 regions of the country (study design Fig. 1, Table 1). The recruitment was carried out in urban – Antananarivo (UR) and rural – Berevo (Menabe) (RU) regions. In the UR region, fifty girls from a halfway house for girls and college were enrolled, while in the RU region, fifty-three girls from a school run by a Catholic mission were selected for the study. At schools in the UR region, girls participated in a feeding programme financed by a non-governmental organisation, whereas girls from the halfway house received breakfast and dinner. There was no additional form of feeding programme in the RU region. Table 1 presents the characteristics of the study. The research was approved by the local bioethics commission at the Poznan University of Medical Sciences (Poland) (No. 1273/18). Informed consent was obtained from all subjects and/or their parents or legal guardian involved in the study.

Fig. 1. Study design and sample collection.
Table 1. Sample characteristic by sociodemographic and lifestyle variables of RU and UR groups
(Mean values and standard deviations; minimum and maximum values)

* Statistically significant differences between UR and RU children were marked with different letter inscriptions ab as P < 0·001.
† Statistical significance (Person’s χ 2 test): P < 0·0001.
‡ Participation in the feeding programme at school (one meal at school).
§ The financial situation was assessed using the question: ‘How would you describe your household’s overall situation?’; The ‘modest’ category consisted of two answers: ‘we have to be very careful with our daily budget’ and ‘we have enough money for our daily needs, but we need to budget for bigger purchases’; The ‘comfortably’ category consisted of one answer: ‘we have enough money for our needs without particular budgeting’; The ‘wealthy’ category consisted of one answer: ‘we can afford some luxury’.
Anthropometrics
The measurements of body weight (kg) and height (cm) were taken and recorded with a precision of 0·1 kg or 0·1 cm, respectively, using professional devices and a measuring tape. All measurements were taken in light clothing and without shoes according to the guidelines(Reference Zdunek, Lichota and Górniak20). BMI (kg/m2) was then calculated. The above parameters were used to calculate the Cole’s index using the formula(Reference Cole, Flegal and Nicholls21):
 $$CI\% = {{Weight\;\left( {kg} \right) \times \;height\;\left( m \right)\;for\;age\;and\;sex\;{{\left( {50th\;percentile} \right)}^2}} \over {S\tan dard\;body\;weight\;\left( {kg} \right) \times \;height\;{{\left( m \right)}^2}}}{\rm{ }} \times 100\% $$
Based on the criteria, the results were interpreted as follows: < 90 underweight, 90–109 – recommended values, 110–119 – first-degree obesity (overweight), 120–139 – second-degree obesity, 140 and above – third-degree obesity(Reference Zdunek, Lichota and Górniak20,Reference Abrantes, Lamounier and Colosimo22) . The data are presented in Table 1.
Hair sample collection
Approximately 1 g of hair samples from the back lower part of the head were collected from subjects who did not have coloured or treated hair (dreadlocks, etc.) in autumn. The samples were stored in encoded, sealed polyethylene bags at room temperature until analysis.
Environmental samples
Samples of water and soil (twenty samples of both types) were collected from the areas presented in Fig. 2. Water samples in the UR area were collected from the water supply network, and in the RU area from rivers, lakes and wells. Water samples from the river (RU) were collected in several places along the river, before the water flows into Berevo. However, since children originated from approximately a 30-square km area, samples were also collected from sites located at a distance from the school. The samples of water were taken at the place of daily activity of the studied groups, that is, place of use of drinking water, and water intended for hygienic purposes or vegetable and crops cultivation (Fig. 2). Water samples were collected manually, next filtered through a 0·45-μm syringe filter into 40-ml tubes immediately after collection and stored at room temperature. In laboratory, samples were acidified by nitric acid and stored at ambient temperature until analysis. Soil samples were collected from the same places as water. Soil sampling was provided from the surface (100 cm2), soils were homogenised, the fraction < 2 mm was removed and a ca. 50 g of subsample was stored in some Eppendorf-type tubes at room temperature until analysis. Two soil types were collected: red ferruginous (dominant among sampling points 1–10) and ferralitic soil, generally characterised by high Fe and Al levels with a deficiency of nitrogen and phosphorus. Due to the very difficult field and climatic conditions, it was not possible to determine the Hg recovery from environmental samples. Hence, the content of this element was not included into the discussion.

Fig. 2. Locations of the soil and water sampling sites in the rural (samples numbered 1–10) and urban (samples 11–20) regions of Madagascar.
Determination of elemental composition by inductively coupled plasma – optical emission spectrometers
Sample preparation
Hair samples were washed with acetone and twice in ultrapure water (Milli-Q, Millipore) and dried at the ambient temperature. For selected samples, the washing solution was analysed to control the cleaning procedure. After separating the ends, the hair up to 10 cm long was cut into small pieces with a ceramic knife. The samples (0·100 ± 0·001 g) were digested in 5·0 ml of 65 % nitric acid (Merck) in closed Teflon containers at 180°C (20 min) in the Mars 6 Xpress microwave digestion system (CEM) and were filtered through paper filters and diluted with water to a final volume of 10·0 ml. Extraction of the acid leachable fraction from the soil samples was carried out using hydrochloric acid following the previously developed procedure(Reference Kozak and Niedzielski23). Soil samples were dried at 105 ± 5°C for 96 h in an electric oven. Extraction of the acid leachable fraction from the soil samples (1·000 ± 0·001 g of soil) was performed with 20 ml of 2 mol l–1 HCL (Merck) at 80°C under reflux. Samples were then filtered through paper filters and diluted with water to a final volume of 20·0 ml. Each of the samples was processed in three replicates.
Sample analysis and quality control
An inductively coupled plasma optical emission spectrometer (ICP-OES) (model 5110, Agilent) was used to analyse the samples. The following conditions were maintained for multielemental analysis: plasma gas flow of 12·0 l/min, nebuliser gas flow of 0·7 l/min, auxiliary gas flow of 1·0 l/min and radio frequency power of 1·2 kW. The analytical wavelengths were Al 394·401 nm (high concentration – soils) and 396·152 nm (low concentration – water and hair), As 188·980 nm, Cd 214·439 nm, Cr 267·716 nm, Hg 194·164 nm, Ni 231·604 nm, Pb 220·353 nm, Sb 206·834 nm and Sn 283·998 nm. Signal was measured in five replicates during 5 s for soil analysis, and 30 s for hair and water analysis. Potential spectral interferences were recognised in the method validation and the background correction methods (fitted or off-peak) were selected. Commercial ICP analytical standards (Romil) and ultrapure water were used for the calibration. The detection limits were estimated for hair and soil samples in the range of 0·02–0·10 mg/kg dry weight and in the range of 0·001–0·009 mg/l for water samples using the criteria of 3 sd of calibration blank analysis (n 10) with correction using reagent blank to control the purity of reagents and sample preparation procedure. The uncertainty level was estimated for the procedure, including sample preparation at the level of 20 %. Certified reference material analyses (soils: SRM 2709; sediments: CRM 667 and CRM 405) were used in quality control with acceptable recovery (80–120 %). The analytical procedure has been revalidated with the use of human hair-certified reference material ERM-DB001, soil-certified reference material AMO S1, water-certified reference material (EnviroMAT EP-L-4) and standard addition method for all analysed matrix with acceptable recovery (80–120 %).
Statistical analysis
The Clinical Calculator (ClinCalc, LLC) was used to calculate the minimum hair sample size(Reference Campbell, Thomson and Ramsay24). The calculation was based on means and standard deviations of As in soil. The minimum number of studied subjects for adequate study power was calculated as 43 for each independent group with the enrolment ratio set at 1, type I error at 0·05 and 80 % power. The data were presented as means and standard deviations or medians (lower and upper quartiles) as appropriate. A Shapiro–Wilk test evaluated the normality of the distribution of continuous variables in the total sample, rural and urban areas. Skewed variables were logarithmically transformed. Differences between the concentrations of metals and metalloids in hair in urban v. rural area, water and soil samples were examined using independent t tests ANOVA. The significance of the main effects and the interaction of experimental factors were determined with a two-way ANOVA.
For exploratory analysis, a Spearman rank correlation of Cole’s index with the concentration of metal and metalloid in hair and age as well as the correlation between the element concentrations in hair were analysed. For these analyses, a significance level of < 0·05 was adopted and correlation levels were interpreted as from 0·00 to 0·19 – very weak correlation, 0·20 to 0·39 – weak correlation, 0·40 to 0·69 – moderate correlation, 0·70 to 0·89 – strong correlation and 0·90 to 1·00 – very strong correlation(25). All statistical analyses were performed using STATISTICA software (version 12.0 PL; StatSoft Inc.; StatSoft). The threshold for statistical significance was P ≤ 0·05.
Results and discussion
The concentration of studied elements in the girls hair
Girls’ hair samples from two Madagascar region (urban or rural) were collected for the current study. The urban area (UR) represented the province of the capital Antananarivo, located on the east coast of the island, the most industrialised region of East Madagascar. The rural area (RU) was Berevo, a town situated 360 km southwest of Antananarivo, close to the island west coast. The content of elements studied in the hair samples is presented in Table 2 and is compared with the data from Poland(Reference Michalak, Mikulewicz and Chojnacka26), Japan(Reference Yasuda, Tsutsui and Suzuki27,Reference Yasuda, Yoshida and Segawa28) , France(Reference Goullé, Mahieu and Castermant29), Turkey(Reference Doǧan-Saǧlamtimur and Kumbur30), Sweden(Reference Rodushkin and Axelsson31), Italy(Reference Senofonte, Violante and Caroli32), Brazil(Reference Miekeley, Dias Carneiro and Porto da Silveira33), Spain(Reference González-Muñoz, Peña and Meseguer34), India(Reference Samanta, Sharma and Roychowdhury35), China(Reference Liang, Pan and Liu18) and Egypt(Reference Rashed and Hossam16,Reference El, Zaky and El-Sayed36) . Visible dispersion of results in the two studied population was noted. Despite this, a significantly higher average concentration of Al, Cr and Hg in girls’ hair from the RU area was confirmed. The Al accumulation is surprising, much higher in the hair of RU children than in the UR region (median 1951 v. 338 mg/kg, P < 0·001). The Al content in Malagasy girls’ hair was higher than the highest levels noted for Japanese children (5·4–20·6 mg/kg; threefold higher than in adults’ hair)(Reference Yasuda, Yoshida and Segawa28), as well as for healthy and autistic Egyptian children (16·8 ± 17·3 mg/kg and 59·2 ± 38·0 mg/kg, respectively)(Reference Rashed and Hossam16,Reference El, Zaky and El-Sayed36) . These high outcomes in Malagasy hair may be connected with the manufacturing of Al articles in this area and the widespread use of Al cookware (hence its additional migration into food during preparation)(37,Reference Sukumar and Subramanian38) . Bering that the important source of elements in the human body is diet, food samples collection, was considered. Unfortunately, during the humanitarian mission, it was not possible. Toxic elements migrate into food from water and soil. Thus, the soil and water samples were taken from the girls’ everyday life sites. It must be emphasised that the local population consumed water from their inhabited areas, that is, tap water (UR) or lake and river (RU), never bottled water. Moreover, mentioned water was used for cooking for hygienic purposes and for watering commonly planted and consumed rice. Food for the girls is prepared from raw materials grown in a given area only. Girls from the UR region may have eaten food produced elsewhere in the country occasionally.
Table 2. Comparison of studied elements content in the hair samples† (mg/kg)
(Median values; minimum–maximum; mean values and standard deviations)

IN, indicative values.
*Values of LOD (mg kg–1): Al – 0·048; As – 0·061; Cd – 0·026; Cr – 0·028; Hg – 0·058; Pb – 0·018; Ni – 0·087; Sb – 0·081; Sn – 0·088.
† Data were analysed after their logarithmic transformation, but in the table, elements concentration was presented as raw data.
Table 3 presents the average content of studied toxic elements in samples of water and soil taken from the areas Antananarivo (UR) and Berevo (RU). A significantly higher Al content was noted in water samples from the RU region, although the content of Al in the RU soil samples was lower than in the UR area. The water most frequently drunk in the RU area (Berevo) was lake water, where the content of Al (0·76 mg/l) exceeded the recommended value (Table 3) several times. The level was also high in samples of water collected at a short distance from the school (1·0 mg/l). Despite a low bioavailability of Al from water (about 0·3 %), and that from food (about 0·1 %)(39), this may be the most crucial source exposing girls to the harmful effects of this element.
Table 3. Comparison of the studied elements content in the environmental samples
(Mean values and standard deviations)

NA, not analysed; X, the natural level of Al is connected with the mineralogical composition of soils (the level of aluminosilicates). The P values below the threshold of statistical significance are marked in bold.
* Values of LOD (mg L–1): Al – 0·00048; As – 0·00061; Cd – 0·00026; Cr – 0·00028; Hg – 0·00058; Pb – 0·0018; Ni – 0·0087; Sb – 0·00081; Sn – 0·0088.
** Values of LOD (mg kg–1): Al – 0·048; As – 0·061; Cd – 0·026; Cr – 0·028; Hg – 0·058; Pb – 0·018; Ni – 0·087; Sb – 0·081; Sn – 0·088.
In the studied hair samples, the concentration of As was noted to be below the level of detection. The As concentration was detected only in the hair samples of four girls, two from each region, and the determined concentration ranged from 1·2 to 18·3 mg/kg, while the levels noted in the literature ranges from 0·011 ± 0·007 in Spain up to 0·12 ± 0·08 mg/kg in Beijing(Reference Liang, Pan and Liu18,Reference González-Muñoz, Peña and Meseguer34) . The bioavailability of this metalloid from water and food varies widely (45–95 %)(Reference Bizoń, Andrzejewska and Milnerowicz43) and depends on the element species, with higher toxicity for an inorganic form(44). The form of As was not analysed; thus, even if the concentration in the UR water samples exceeded twice the recommended value, the element could be not bioavailable for the girls.
High Cd content was reported in the girls’ hair in both regions, although its levels in soil and water samples were below the level of detection. The literature suggests Cd concentration in hair ranges from approximately 0·011 (in France) to 0·23 ± 0·55 mg/kg (in Italy)(Reference Goullé, Mahieu and Castermant29,Reference Senofonte, Violante and Caroli32) . The median level of Cd in the hair of the studied group from both regions was 0·23 mg/kg (UR) and 0·20 mg/kg (RU). This is surprising because of the low industrialisation of Madagascar, the lack of tobacco smoking as the primary source of Cd and the high isolation of the rural area. However, such high exposure to Cd was also observed in other African countries and is explained by the use of fossil fuels and the municipal waste incineration(Reference Orisakwe45).
The content of Cr in the studied girls’ hair differed significantly between the RU and UR areas. The current study reported about fivefold higher content in the RU region samples than from the UR region (median 2·8 mg/kg v. 0·52 mg/kg). Such a concentration was much higher than those found in the literature (reported in Sweden 0·17 mg/kg ± 0·12 and Italy 0·99 mg/kg ± 2·2)(Reference Rodushkin and Axelsson31,Reference Senofonte, Violante and Caroli32) . The high Cr content in the studied samples was not expected because the mean content of Cr in soil and water samples did not exceed the recommended values. Thus, the reason why girls were exposed to this element is difficult to explain on the basis of the presented research. It is worth emphasising that the bioavailability of Cr by the digestive tract in human studies ranges between 0·69 and 10 % and depends on its chemical form(Reference Król and Krejpcio46).
High Hg content in hair is usually correlated with high Al content, and this trend was also observed in the studied samples: hair from RU samples contained more Hg, that is, the median was 0·28 mg/kg, while in UR girls, it was 0·15 mg/kg. Fortunately, the content of Hg in the studied hair was lower than noted in the literature, where ranges from 0·26 ± 0·14 mg/kg (in Sweden) up to 3·2 ± 3·4 (in Japan) were quoted(Reference Rodushkin and Axelsson31,Reference Sera, Futatsugawa and Murao47) .
Although the Ni pollution in analysed water samples was higher than admissible in both regions, the Ni concentrations in hair were 1·0 in UR and 1·8 mg/kg in RU samples. These levels were lower than in the samples obtained from university students from an urban area in Poland (median from 1·8 for men up to 2·1 mg/kg for women)(Reference Michalak, Mikulewicz and Chojnacka26). Hair contamination with Ni is often connected with the use of cosmetics, but also with exposure to processed food(Reference Michalak, Mikulewicz and Chojnacka26); thus, this route of exposure was unavailable for the Malagasy girls.
Pb content in the hair (median in UR 6·1 and RU 5·4 mg/kg) corresponded to levels reported in the literature (from 0·96 ± 0·84 mg/kg in Sweden up to 14·1 ± 4·6 mg/kg in Turkey)(Reference Doǧan-Saǧlamtimur and Kumbur30,Reference Rodushkin and Axelsson31) . The level of Pb was much lower than recommended in soil but higher than recommended in water (compare reference value, Table 3). It can be a consequence of widespread river transport use of leaded petrol(Reference Orisakwe45). The Tsiribihina River is the only drinking water supplier and transport route to Berevo and is oil-polluted from barges and sewage from local farms.
Exposure to Sb is usually accompanied by pollution with As. Nevertheless, gastrointestinal absorption of Sb (5–20 %) is far lower(Reference Gebel, Suchenwirth and Bolten48). The Sb content in the hair it is highly variable even in industrialised areas. Median content was 0·028–0·044 mg/kg in a samples from German mining area(Reference Gebel, Suchenwirth and Bolten48), while in a Chinese mining region mean content was 5·21–15·9 mg/kg(Reference Liang, Pan and Liu18,Reference Liu, Wu and Li49) . The Sb content in the samples collected in the current study depended on the region: a median of 1·0 mg/kg (RU) and 1·6 mg/kg (UR). It could be affected by an increased content of Sb in the soil. The correlation between the content of Sb in hair and soil was previously confirmed, and Sb can be detected in hair even 1 year after exposure(Reference Lauwers, Roelants and Rosseel50).
Despite the increased Sn content in the UR region water, this element was not detected in the studied hair samples of girls from both regions.
It has been literature confirmed that accumulation of toxic elements in human body may be negatively correlated with concentration of some other elements. Such competitiveness is proven in the absorption of elements desired and toxic for human health (e.g. Cd, Pb, Fe, Zn and Cu)(Reference Yasuda, Tsutsui and Suzuki27,Reference Długaszek51–Reference Bressler, Olivi and Cheong53) . There is little information about possible correlation among accumulated in human bodies toxic elements.
In the studied samples, the content of Al in the girl’s hair was positively correlated with the content of Cr (R = 0·945, P = 0·023), Ni (R = 0·737, P = 0·031), Pb (R = 0·473, P = 0·043) and Hg (R = 0·379, P = 0·08). The content of Cd was correlated with the content of Pb (R = 0·416, P = 0·031) and Ni (R = 0·345, P = 0·029). The concentration of Cr was the most strongly positively correlated with Al but also with Ni (R = 0·661, P = 0·019), Hg (R = 0·435, P = 0·034) and Pb (0·384, P = 0·032), while the concentration of Pb (besides Al, Cd and Cr) was also correlated with Ni (R = 0·426, P = 0·037). Therefore, no competition was observed between the absorption of toxic elements in the studied individuals. This is obvious that increased concentration of even one toxic elements in the body exposes the girls to dangerous health consequences. The more concern should be that the increased level of a toxic element does not inhibit the absorption of other hazardous to health.
Previous studies suggest(Reference Długaszek51) that the accumulation of toxic elements depends on the age and sex of individuals. Presented studies confirmed that younger girls accumulate more Al (R = –0·502, P = 0·038), Cr (R = –0·494, P = 0·044) and Ni (R = –0·348, P = 0·047). A negative correlation was also observed between the age and total accumulation of studied elements (R = –0·423, P = 0·029). These results are very disturbing, because it suggests that the youngest girls, that is, in the period of intensive growth, are particularly vulnerable to the harmful effects of the studied elements. It was observed before that the highest burden level for Al, Pb and Cd was observed in infants (0–3-year-olds) and declined with the age of children (in the group up to 11 years)(Reference Yasuda, Tsutsui and Suzuki27).
Nutritional status
A key aspect worth noting in interpreting above-presented results might be related to differences in nutritional status between UR and RU children, and it should be preceded by bringing the readers closer to the nutrition of the girls. According to the collected data, in the UR area, all girls participated in the feeding programme. In the halfway house, schools’ canteens and homes, the diet was composed of locally produced food crops. There were limited (maximum two times per week) in terms of the animal protein sources supply (mainly chicken, pork and rare fish) and in terms of fruit and other vegetables amount. Children in the RU region did not share any humanitarian action. Some help in feeding children were supplied there only periodically by Catholic missions. It should be mentioned that the girls of both groups consumed unprocessed food, which was prepared from raw materials obtained from the areas in which they lived (from the surrounding gardens and fields).
Malnutrition of Malagasy children, especially in the poorest parts of the country, such as the studied RU region, was confirmed and discussed by other studies(Reference Miller, Garchitorena and Rabemananjara54–Reference Quintarelli, Di Gioia and Creta58). It was shown that nutritional deficiencies in Madagascar, but also generally, are widely conditioned by many factors, mainly by inadequate food intake and infectious diseases, socio-economic factors, nutritional education and family influence(Reference Di Gioia, Creta and Fittipaldi57,Reference Sobas, Wadolowska and Slowinska59,Reference Bykowska-Derda, Czlapka-Matyasik and Kaluzna60) .
Although Cole’s index distribution indicated that the majority of studied Malagasy girls were characterised by normal body weight (46 % v. 55 %, UR v. RU sample), the mean values of body weight, body height and Cole’s index were higher in the girls from the UR area (Table 1). Underweight was more common among girls living in RU (where food and nutrition support programmes were unavailable) than in UR settings (42 % v. 28 %) (Table 1). Girls from RU areas of the studied group did not eat breakfast, and only 1/2 of the UR group declared everyday breakfast and lunch eating. Children from RU region declared only random meals consumption, and the consumption of water is mainly from lake in Berevo, less often from the river and wells. Only those two factors could cause the significantly lower Cole index in the RU group. Gastroenteritis caused by the consumption of untreated water affect the condition of the intestinal microflora, which may contribute to the increased accumulation of the studied elements in the bodies of girls(Reference Liu, Liang and Lei61).
Moreover, nutritional status of the studied girls was negatively correlated with the age of the surveyed girls (R = –0·400, P = 0·026) and probably may be explained by the more care in families for younger children.
Toxic elements accumulation in relation to nutritional status and environmental exposure
The relations between dietary intake and element concentrations in hair were previously studied in older populations(Reference Wójciak, Krejpcio and Czlapka-Matyasik62), while research on children are scarce. There is no research on relationship between Malagasy girls’ exposure to toxic elements and their nutritional status. The nutritional status of children is an essential element of the health monitoring(Reference Oninla, Owa and Onayade63,Reference Rabasa, Omatara and Padonu64) .
Spearman’s rank analysis demonstrated that with decreased nutritional status, girls were more exposed to the accumulation in their hair of Al (R = –0·384, P = 0·024), Cd (R = –0·320, P = 0·042) and Cr (R = –0·379, P = 0·022). This can be explained by the decreased level of protein and desirable macro- and micronutrients in the diets of malnourished girls(Reference Długaszek51,Reference McLaughlin, Parker and Clarke65) .
There is a lot of research and evidence that some toxic elements are associated with metabolic disturbances leading to the weight gain or loss(Reference Baillie-Hamilton66), because they evoke among others endocrine disruption(Reference Paschoalini, Savassi and Arantes67). Adipose tissue has protective and storage functions and that large weight loss leads to the release of dangerous substances from fat tissue into the bloodstream, which can generate deterioration of health. Then, toxic elements circulating in the children body might be in detoxification process accumulated in dead epidermal cells (such as hair). However, there is very little data on the accumulation of elements in the hair (and bodies) as a result of malnutrition, where the content of fat tissue is lowered.
Two-way ANOVA demonstrated significant effects of place of residence, nutritional status and nutritional status × place of residence interaction on some hair metals content (Table 4). This search showed apparently the relationship between the nutritional status and the hair accumulation in the case of Cd. While residence was considered an important factor influencing hair accumulation of Cd in previous studies(Reference Tippairote, Temviriyanukul and Benjapong68,Reference Bosque, Domingo and Llobet69) , we revealed nutritional status as a significant factor of this element accumulation in girls’ hair. Xue and Ke (2012) sugested that higher Cd concentrations were associated with lower weight gain in animals(Reference Xue and Ke70). We hypothesise that in our group, low diet quality and even starvation could cause tissue atrophy and lead to higher Cd accumulation, which is especially fast and effective in the youngest population. It was proved before that reasonable diet and proper nutritional status protect against undesirable Cd effects, but dietary deficiencies of essential elements (with the greatest importance of Fe, Zn, Cu and Ca) and the high share of grain in the diet increase absorption of Cd(Reference Tippairote, Temviriyanukul and Benjapong68,Reference Fox71) . Deficiency of Fe and other essential micronutrients as well as the diet based on rice grain is a great problem of Malagasy children.
Table 4. ANOVA results of analysis of the dependence between the accumulation of the elements (Al, as, Cd, Cr, Hg, Pb, Ni, Sb and Sn) in the girls’ hair and the combined effect of their nutritional status and place of residence. A – underweight; B – recommended values; C – first-degree obesity, D – second-degree obesity; n – group size*

IN, indicative values. The P values below the threshold of statistical significance are marked in bold.
* Data were analysed after their logarithmic transformation, but in the table, elements concentration in the hair was presented as raw data.
The data are presented in Table 4 indicate also that place of residence was the significant factor in case of Cr and Hg accumulation in the hair. It is obvious that girls living in UR area were more exposed to environmental pollution. As a consequence, the accumulation of harmful elements in their hair could be increased.
The research on the influence of environmental exposure on metal concentrations in hair of subjects from areas adjacent to mines, landfills and contaminated regions, where an increased concentration of metals occurs, is commonly presented. Our results were in line with other authors who have shown that the place of residence has the most significant influence on the results(Reference Sukumar and Subramanian38,Reference Winde, Geipel and Espina72–Reference Sahoo, Žunić and Kritsananuwat75) . In many residences, consumption of fish, whose meat is contaminated with Hg, has the highest importance(Reference Counter and Buchanan76,Reference Aleksina and Komov77) , but fish in the Malagasy’s diet are rare. However, it must be remembered, that girls from these two studied places of residence consumed different food. It is difficult at the present stage of research to separate the influence of the environment from the influence of the quality of the girls nutrition in both regions. The diet of the girls from RU region was poorer, exposing them on micronutrients, vitamins and proteins deficiency, and consequently the RU girls may be more predisposed to toxicity of the studied elements(Reference Peraza, Ayala-Fierro and Barber78).
Moreover, two-way ANOVA indicated that Cole’s index and place of residence affected the combination of the Al (P = 0·0103) and Cr (P = 0·028) concentration in the girl’s hair (Table 4). Underweight girls living in the RU area had higher hair Al and Cr levels than those from the UR region, where not only exposition of these two toxic elements was weaker (Table 3), but also malnutrition was less frequent (Table 1). There are no studies reporting data on these factors in Malagasy girls to the authors’ best knowledge. Confirmed influence of both factors, nutritional status of the girls and place of residence on the accumulation in their hair studied elements are consistent with the previously cited studies that not only the environmental pollution but also the nutritional status and the quality of the diet used affect the exposure of the human organism to toxic elements(Reference Liu, Liang and Lei61,Reference Tippairote, Temviriyanukul and Benjapong68,Reference Fox71,Reference Peraza, Ayala-Fierro and Barber78) .
ANOVA analysis showed that neither nutritional status level expressed by Cole index (Factor A) nor place of residence (Factor B) affected the As, Ni, Pb, Sb or Sn concentration in hair samples of the studied girls (Table 4).
Although the research has reached its aims, it may have some limitations, primarily the retrospective setting of the study. It should be emphasised that the obtained results could be supported by air samples and an analysis of the diet composition, which are the missing elements of intoxication sources. Missing hair samples and unreliable anthropometrical data or date of birth were removed from the analyses. The genetic differences between the examined girls also were not taken into account at this stage of the research. Moreover, even though the present study determined Cole’s index (commonly used as a nutritional status marker), it was difficult to evaluate the dietary intake by a food consumption frequency questionnaire or dietary recording due to limited language communication skills. Therefore, the photos of main dishes delivered at school and the halfway house were collected, and the data will be analysed by the Wellnavi(Reference Kikunaga, Tin and Ishibashi79) method and published in the next manuscript.
Conclusion
The current results indicate that the concentration of metals and metalloids in hair should be considered multifactorial and confirmed hypothesis that malnutrition increases exposition of Malagasy girls to some toxic elements.
Extremely high contents of Al (which requires further studies) and very high contents of Cd and Cr were detected in the hair of the studied girls. The contents of other toxic elements in hair were found to be within the ranges reported in the literature. It was also confirmed that younger girls were more exposed to Al, Cr and Ni.
However, malnutrition of children resulted in greater accumulations of Al, Cd and Cr in their bodies. The combination of two factors, the place of residence and malnutrition, significantly differentiated the accumulation of Al and Cr in the girls’ hair. The presented research suggests that in the case of environmental pollution, malnutrition of children may be a factor which significantly increases the accumulation of harmful elements in their bodies. Absorption of toxic elements frome the environment was significantly higher for children with lower nutritional status.
Acknowledgement
The research was carried out through the Foundation Ankizy Gasy – Children of Madagascar represented by Ms Patrycja Malik (https://www.dziecimadagaskaru.pl/en/) and the Catholic Mission Center of the Franciscan Missionaries of Mary in Berevo represented by Sister Iwona Korniluk. The data were collected as part of the voluntary nutritional and medical mission’ Feed Madagascar’. The mission was run by university students from Poznań University of Life Sciences, by gynecologist Dr. Anna Paczkowska (St. Wojciech Hospital in Poznan) in October 2018. This paper and the research involved would not have been possible without the exceptional support group of volunteers who worked with the authors (in alphabetical order): Krzysztof Bartmanski, Izabela Bednarczyk, Angelika Głodowska, Julia Kłosowicz, Zuzanna Krzyżaniak, Weronika Marchwicka, Paulina Pobłocka, Magdalena Pracka, Bartosz Radecki, Wojciech Rafiński and Aleksandra Stolarzewicz.
This research received no external funding.
Conceptualisation: M. Z-D. and P. N.; Methodology: M. Cz-M. and P. N.; Validation: M. Z-D., M. Cz-M. and P. N.; Formal analysis: M. Z-D., M. Cz-M. and P. N.; Investigation: M. Z-D., M. Cz-M., Z. W. and J. P.; Resources: M. Z-D., M. Cz-M. and Z. W.; Data curation, M. Z-D., M. Cz-M. and P. N.; Writing – original draft preparation: M. Z-D.; Writing – review & editing M. Z-D., M. Cz-M. and P. N.
The authors declare that they have no known competing financial interests or personal relationships that could have appeared to influence the work reported in this paper.


