


Diet is an important and effective component in the treatment of type 2 diabetes (T2D) as it contributes to improved metabolic control and reduced risk of complications related to T2D( Reference Mann, De Leeuw and Hermansen 1 – 3 ). Energy balance, metabolic goal and individual dietary preferences are recommended to be taken into account when supporting a healthy eating pattern( Reference Mann, De Leeuw and Hermansen 1 – 3 ).
Existing data indicate that the vast majority of those diagnosed with T2D do not make major lifestyle changes( Reference King, Mainous and Carnemolla 4 – 6 ) and do not meet dietary recommendations( 6 – Reference Rivellese, Boemi and Cavalot 17 ). However, cross-sectional studies also indicate that individuals with T2D differ from the general population with regard to diet( Reference Close, Wiles and Lockton 11 – Reference Virtanen, Feskens and Rasanen 16 , Reference Nothlings, Boeing and Maskarinec 18 ). Individuals with diabetes tend to have a higher intake of protein and a lower intake of carbohydrates( Reference Close, Wiles and Lockton 11 – Reference Shimakawa, Herrera-Acena and Colditz 15 ), and they acquire more energy from fat( Reference Thanopoulou, Karamanos and Angelico 13 , Reference Shimakawa, Herrera-Acena and Colditz 15 , Reference Virtanen, Feskens and Rasanen 16 ) compared with individuals without diabetes. Moreover, those with diabetes have a higher intake of fruits( Reference Helmer, Bricout and Gin 12 , Reference Shimakawa, Herrera-Acena and Colditz 15 , Reference Virtanen, Feskens and Rasanen 16 ) and vegetables( Reference Virtanen, Feskens and Rasanen 16 , Reference Nothlings, Boeing and Maskarinec 18 ) and a lower intake of juice( Reference Nothlings, Boeing and Maskarinec 18 ). To the best of our knowledge, the only studies exploring possible changes in diet due to the diagnosis of T2D in longitudinal settings observed that women in the Nurses’ Health Study began consuming high-fat and low-sucrose diets after T2D diagnosis( Reference Shimakawa, Herrera-Acena and Colditz 15 ), whereas no change in diet quality (using Alternative Healthy Eating Index) was observed among men and women in the Whitehall II study( Reference Akbaraly, Tabak and Shipley 19 ). Even though reported differences in dietary patterns may point towards an attempt to improve eating habits, there is a gap in the scientific literature regarding observed long-term changes in diet following a T2D diagnosis.
Against this background, we aimed to examine the possible changes in consumption of fruits, vegetables and juice over 12 years among men who were diagnosed with T2D as compared with those without diabetes. We hypothesised that individuals diagnosed with T2D alter their diet as an attempt to manage their disease and its health consequences.
Methods
Study population
The Cohort of Swedish Men is a prospective cohort that was established in late 1997 when all men between 45 and 79 years of age, living in Västmanland and Örebro counties, received a questionnaire regarding diet (FFQ) and other lifestyle factors. A total of 48 850 men returned a completed questionnaire, yielding an overall response rate of 49 %. From the baseline cohort, men with incomplete/incorrect personal number, men with prevalent cancer and men with implausible energy intakes (±3 sd from the log-transformed mean energy intake) were excluded, leaving 45 339 men. A second wave of questionnaires was sent out in 2008 and 2009 to those men still alive. The 2008 questionnaire (response rate 78 %) included general health status questions and updated anthropometric measures. The 2009 questionnaire (90 % response rate of the 2008 responders) included questions on diet (FFQ), physical activity, alcohol consumption and smoking. A total of 25 976 men responded to these two questionnaires. From the 2008/2009 questionnaires, we excluded those with incomplete/incorrect personal number and implausible energy intakes, leaving 25 697 men. From this eligible population, we further excluded men with prevalent diabetes in 1997, men who developed diabetes other than T2D between the questionnaires and men whose self-reported T2D in the 2008 questionnaire could not be verified in the register. Moreover, because of the extended time period during which the 2009 FFQ was distributed and completed, we also excluded men who developed diabetes during that year. After these exclusions, the final analytical cohort consisted of 23 953 men, see Fig. 1.
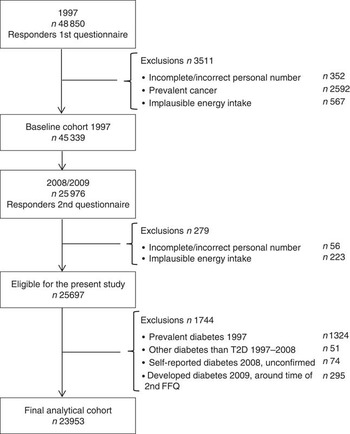
Fig. 1 Flow chart of participants in the present study.
The baseline cohort represents the Swedish population well with regard to age distribution, educational level and BMI( Reference Harris, Håkansson and Olofsson 20 ). The proportion of men with diabetes in the cohort was 7 % at baseline, which is similar to the proportion for the corresponding age group in the general Swedish population( Reference Norberg and Danielsson 21 , 22 ). Study design and characteristics of the cohort, as well as validity of the FFQ, have been described in more detail elsewhere( Reference Harris, Håkansson and Olofsson 20 ). The study protocol was approved by the Regional Ethical Review Board at Karolinska Institutet in Stockholm, Sweden.
Ascertainment of type 2 diabetes cases and other diseases
Cases of T2D were identified by linking the cohort, using personal identity numbers( Reference Ludvigsson, Otterblad-Olausson and Pettersson 23 ), to the National Patient Registry (NPR) and the Swedish National Diabetes Registry (NDR). The NPR, which is a mandatory register, contains information on the main and secondary diagnoses for all inpatient care since 1987 and outpatient visits since 2001. Code E11 in the International Classification of Disease (ICD-10) was used to identify cases. The NDR, which was established in 1996, provides clinical data from patient visits. Retrospective recording of diabetes debut was performed, and its coverage is estimated to be nearly complete in the study area. When validated against the Prescribed Drug Registry, approximately 90 % of individuals on diabetes medication were found to be covered by the NDR( 24 ). First available date in either of the two registers or self-reported diabetes status at the time of the questionnaires (1997 and 2008) was used to classify diabetes status. The question regarding self-reported diabetes did not clarify the type of diabetes; thus, the diagnosis was verified in either of the two registries to classify the type of diabetes.
Incident cases of cancer (except non-melanoma skin cancer) and prevalent and incident cases of CVD (including ischaemic heart disease, stroke and heart failure; I11·0, I20–25, I50, I60–69 in ICD 10 and corresponding ICD codes in ICD 7 and ICD 9) were identified through the NPR.
Assessment of dietary intake and covariates
Dietary intake for the years 1997 and 2009 was assessed using a 96- and 132-item FFQ, respectively, where added items and separation of clustered items explain the expansion. Study participants indicated how often, on average, they consumed fruits, vegetables and juice during the past year using eight predefined frequency categories (never, 1–3 times/month, 1–2 times/week, 3–4 times/week, 5–6 times/week, 1 time/d, 2 times/d and ≥3 times/d). Possible changes in consumption were evaluated using five questions for fruits (orange/citrus, apple/pear, banana, other fruits and berries), five questions for vegetables (cabbage, cauliflower, broccoli/Brussels sprouts, carrots and beetroot) and one for orange and grapefruit juices. These foods were selected on the basis of current nutritional recommendations from the American Diabetes Association and Diabetes and Nutrition Study Group of the European Association for the Study of Diabetes (DNSG-EASD) for management of diabetes. These recommendations state that fruit and vegetables should be incorporated into the diet for good health, and that fructose-containing beverages may have negative effects on health status and should be consumed in moderation( Reference Mann, De Leeuw and Hermansen 1 , Reference Evert, Boucher and Cypress 2 ). The DNSG-EASD, moreover, recommends consumption of at least 5 servings of vegetables or fruits/d( Reference Mann, De Leeuw and Hermansen 1 ). Current Swedish recommendations for the general public state a total of 500 g of fruits and vegetables/d( 25 ), whereas recommendations for diabetics state that fruits in combination with >250 g of vegetables and legumes/d will have a positive effect on health( 3 ).
Energy intake was calculated using age-specific portion sizes. The FFQ has been validated against four 1-week weighted diet records with Pearson’s correlations coefficients of 0·5 for apples/pears, 0·5 for citrus fruits, 0·4 for bananas, 0·4 for juice, 0·5 for root vegetables and 0·8 for cabbage (A Wolk, unpublished results). The FFQ has also been validated for nutrients using 24-h recall interviews among 248 men aged 40–74 years. The mean Spearman rank correlation coefficients for macronutrients and micronutrients were 0·65 and 0·62, respectively( Reference Messerer, Johansson and Wolk 26 ).
Relevant covariates including BMI (calculated by dividing reported weight in kilograms by the square of reported height in metres), physical activity, smoking habits and alcohol consumption were reported in the respective questionnaires in 1997 and 2008/2009, whereas information on education was reported only at baseline in 1997.
Statistical analysis
Baseline characteristics of the study participants, as well as baseline intakes of fruits, vegetables and juice, are described using age-standardised distribution at baseline. Linear mixed models were used to explore changes over time and differences in mean consumption of fruits, vegetables and juice. Men who developed T2D during follow-up and men who remained diabetes free were treated as separate groups from baseline to allow for possible differences of intake at baseline. Changes and differences in mean intake were further adjusted for age (<50, 50–54, 55–59, 60–64, 65–69, ≥70 years), education (primary school, high school, university), BMI (<25, ≥25 to <30, ≥30 kg/m2), physical activity (walking/bicycling≤20 min/d, >20 min/d), smoking status (never, former, current) and alcohol consumption (non-drinkers, quartiles of alcohol consumption). To take into account any possible changes in diet because of CVD or cancer, diagnosis with these diseases (yes/no) was also adjusted for in the analyses as individuals with T2D are at a higher risk to develop CVD( Reference Bate and Jerums 27 ) and cancer( Reference Xu, Zhu and Zhu 28 ).
In a sensitivity analysis performed among 16 768 men, we excluded those with incident cancer (n 2637) and/or incident and prevalent CVD (n 5311). Possible statistical interactions between change in diet and age, education, physical activity, BMI and smoking status were examined and tested using the likelihood ratio test. Stratified analyses were only presented in cases of statistically significant interactions according to age, <60 years and ≥60 years; education, primary school, high school and university; and physical activity, ≤20 min/d and >20 min/d.
An indicator variable was used for covariates with missing data. Statistical analyses were carried out using Stata 13 (StataCorp LP). P-values<0·05 (two-sided) were considered to be statistically significant.
Results
Out of 23 953 men who answered both questionnaires, 1741 (7 %) developed T2D between 1997 and 2008. Baseline characteristics of the study population are presented in Table 1. In brief, men who developed T2D had a lower educational level, were less physically active, were more likely to be current smokers and had a higher BMI in comparison with those who did not develop diabetes during follow-up.
Table 1 Baseline characteristics by type 2 diabetes (T2D) status during follow-up, 1998–2008Footnote *
* Proportions of missing data at baseline for T2D and non-T2D: BMI 5 and 4 %, smoking 1 and 1 %, physical activity 8 and 9 %, respectively.
† Values (except age) are standardised to the age (<50, 50–54, 55–59, 60–64, 65–69, ≥70 years) of the study population.
‡ Data will not add up to 100 % due to missing data.
Baseline consumption of fruits, vegetables, and orange and grapefruit juice as well as changes in consumption over time are presented in Table 2. There were only modest differences in baseline consumption of all foods between the two groups. Both men who developed T2D and men who did not develop T2D significantly changed their consumption of all foods during the follow-up period. In the multivariable adjusted model, men who developed T2D increased their total consumption of fruits and vegetables by 1·6 servings/week (95 % CI 1·08, 2·03, P<0·001), whereas men who remained without diabetes increased their intake by 0·7 servings/week (95 % CI 0·54, 0·84, P<0·001) (Fig. 2). The difference in changed consumption of fruits and vegetables between men with T2D and those who remained without diabetes was 0·9 servings/week (95 % CI 0·38, 1·35, P=0·001). This difference was attributed mainly to changes in the consumption of vegetables (equivalent to 0·6 servings/week, 95 % CI 0·32, 0·80, P<0·001). With regard to orange and grapefruit juice, the multivariable model showed decreased consumption by 0·6 servings/week (95 % CI −0·71, −0·39, P<0·001) among men with T2D, whereas consumption increased by 0·1 servings/week (95 % CI 0·05, 0·15, P<0·001) among those who remained without diabetes.

Fig. 2 Change in mean servings/week of total fruits and vegetables for men with type 2 diabetes (T2D) and men without diabetes among all participants, excluding those with cancer and CVD, and analysis stratified by age using multivariable mixed models. Vertical lines denote 95 % CI. ○, T2D; ●, non-T2D.
Table 2 Baseline intake, change in intake and difference in change of fruits, vegetables and juice between 1997 and 2009 among men who developed type 2 diabetes (T2D) and among those who remained free of diabetes (Mean intake servings per week and 95 % confidence intervals)

* Linear mixed model. Adjusted for age in 1997 (<50, 50–54, 55–59, 60–64, 65–69, ≥70 years).
† Linear mixed model. Adjusted for age (<50, 50–54, 55–59, 60–64, 65–69, ≥70 years), education (primary school, high school, university) in 1997, BMI (<25, ≥25 to <30, ≥30 kg/m2) in 1997 and 2009, smoking status (never, former, current) in 1997 and 2009, physical activity (≤20, >20 min/d) in 1997 and 2009, alcohol consumption (non-drinkers/quartiles), CVD (yes/no) in 1997 and 2009, and cancer (yes/no) in 2009.
‡ Standardised to the age (<50, 50–54, 55–59, 60–64, 65–69, ≥70 years) of the study population.
§ Carrots and beetroots.
|| Cabbage, cauliflower, broccoli/Brussels sprouts.
¶ Orange/citrus, apple/pear, banana, other fruits, berries.
In the analysis excluding men with CVD and/or cancer (Table 3), the results showed increased consumption of fruits and vegetables in both groups (Fig. 2), decreased consumption of juice among those with T2D and increased consumption of juice among those who remained without diabetes, which was slightly strengthened.
Table 3 Change in intake between 1997 and 2009 and differences between men who developed type 2 diabetes (T2D) and those who remained free of diabetes. Sensitivity analysis excluding men with incident cancer and/or prevalent CVDFootnote * (Mean intake servings per week and 95 % confidence intervals)

* Included in analysis: T2D n 974 and non-T2D n 15 794.
† Linear mixed model. Adjusted for age (<50, 50–54, 55–59, 60–64, 65–69, ≥70 years), education (primary school, high school, university) in 1997, BMI (<25, ≥25 to <30, ≥30 kg/m2) in 1997 and 2009, smoking status (never, former, current) in 1997 and 2009, physical activity (≤20, >20 min/d) in 1997 and 2009, and alcohol consumption (non-drinkers/quartiles) in 1997 and 2009.
‡ Carrots and beetroots, cabbage, cauliflower, broccoli/Brussels sprouts.
§ Orange/citrus, apple/pear, banana, other fruits, berries.
We found some evidence of an interaction between change in consumption of fruits and vegetables and age, educational level and physical activity (Table 4). In brief, men in the younger age category increased their intake of total fruits and vegetables to a larger extent than men in the older age category, and the largest increase in consumption was seen among men who developed T2D (Fig. 2). Lower level of education among men who developed T2D was associated with a larger increase in the total consumption of fruits and vegetables, whereas among men who remained without diabetes the increase was larger at a higher level of education. With regard to physical activity, men with lower levels of physical activity had a higher increase in fruit and vegetable consumption, and this was seen both among those who developed T2D and among those who remained without diabetes. For orange and grapefruit juice intake, there was only evidence of interaction with education (P=0·02), where men with T2D decreased their mean intake of 1 serving/week (95 % CI −1·42, −0·62, P<0·001) among the university-educated subjects in comparison with a decrease of 0·4 servings/week (95 % CI −0·68, −0·19, P=0·001) among those with only primary school education.
Table 4 Stratified analysis for total fruits and vegetables over baseline age, education and physical activity for mean baseline intake, change in intake and difference in change between 1997 and 2009 among men who developed type 2 diabetes (T2D) and those who remained healthy (Baseline and change in intake and 95 % confidence intervals)

* Carrots, beetroots, cabbage, cauliflower, broccoli/Brussels sprouts, orange/citrus, apple/pear, banana, other fruits and berries.
† Standardised to the age (<50, 50–54, 55–59, 60–64, 65–69, ≥70 years) of the study population.
‡ Linear mixed model. Adjusted for the following baseline characteristics: age (<50, 50–54, 55–59, 60–64, 65–69, ≥70 years), physical activity (≤20 min/d, >20 min/d), BMI (<25, ≥25 to <30, ≥30 kg/m2), smoking status (never, former, current), education (primary school, high school, university), alcohol consumption (non-drinkers/quartiles) and CVD (yes/no).
The proportion of men who consumed the recommended ≥5 servings of fruits or vegetables/d according to the 2009 FFQ was 36 % of men with T2D and 35 % among those without T2D. In the 2009 FFQ, five questions were included for fruit intake and eighteen questions for vegetable intake (n 23 in total). The equivalent proportions for 1997 were 24 % for men who developed T2D and 25 % for those who remained without diabetes. The number of questions included in the 1997 FFQ was lower – five for fruits and thirteen for vegetables (n 18 in total).
Discussion
In this large, population-based, prospective cohort of middle-aged Swedish men with longitudinal measurements of diet, we observed that after being diagnosed with T2D, men reported increased consumption of total fruits and vegetables to a larger extent, approximately 1 more serving/week, than men who did not develop diabetes during the follow-up period. Men with T2D also reported decreased consumption of orange and grapefruit juice equivalent to 1/2 serving/week, whereas men who did not develop diabetes slightly increased their intake. Exclusion of men with CVD and cancer supported the findings. Overall, the findings suggest an attempt to improve dietary health behaviours after being diagnosed with T2D in order to meet current dietary recommendations for the management of diabetes. The level of changes in consumption of fruits and vegetables was dependent on age, educational level and physical activity. Among men who developed T2D, those with a lower baseline intake of fruits and vegetables increased their intake the most. This group of men was younger, had lower education and was less physically active.
To the best of our knowledge, the present study is the first to explore changes in vegetable, fruit and juice consumption in a prospective design among men with and without T2D, as previous studies have been performed within cross-sectional settings. In previous cross-sectional studies, the observed differences in diet between individuals with diabetes and those without diabetes were attributed to differences in health status( Reference Helmer, Bricout and Gin 12 – Reference Virtanen, Feskens and Rasanen 16 , Reference Nothlings, Boeing and Maskarinec 18 ). Results of the present study, with only modest differences in baseline intake and a larger increase in consumption over time among men who developed T2D, support the previous observed differences. In the cross-sectional Seven Country Cohort, differences in diet between men with diabetes and those without were examined in Finland, the Netherlands and Italy. Men with diabetes, as compared with those without, consumed more vegetables and fruits in Italy, more fruits in the Netherlands but no difference was observed in Finland( Reference Virtanen, Feskens and Rasanen 16 ). In a French population, it was observed that men with diabetes had higher consumption of fruits in one study( Reference Helmer, Bricout and Gin 12 ) but not in another one( Reference Gauthier-Chelle, Mennen and Arnault 14 ). Within the European Prospective Investigation into Cancer and Nutrition study (EPIC) and the Multiethnic Cohort Study(MEC), slightly higher vegetable consumption was observed among those with diabetes in comparison with those without in cross-sectional analyses of the baseline data( Reference Nothlings, Boeing and Maskarinec 18 ). Regarding juice intake, the EPIC and MEC studies also observed that consumption was lower among individuals with diabetes when compared with their non-diabetic counterparts. The difference was most prominent among participants from Sweden in the EPIC study( Reference Nothlings, Boeing and Maskarinec 18 ). These findings support our prospective results in which men who developed T2D reduced their intake of orange and grapefruit juice, whereas men who remained without diabetes increased their intake.
The strengths of the present study include the longitudinal design and the large sample size with detailed questionnaires completed both before and after the diagnosis of T2D. Moreover, T2D was ascertained and verified through national healthcare and quality registers. We were also able to adjust for several important covariates that might have an impact on changes in diet.
Limitations of the study include the fact that information on dietary intake and most covariates were self-reported. Although it has been reported that overweight and obese diabetics under-report their energy intake( Reference Salle, Ryan and Ritz 29 – Reference Heitmann and Lissner 31 ), one should, however, keep in mind that the direction of reporting might be different between foods. Thus, foods considered healthy might be over-reported as it has been observed among Finnish male subjects, aged 55–69 years, as well as intake of fruits( Reference Pietinen, Hartman and Haapa 32 ). We cannot rule out that the dietary reporting in 2009 was affected by the disease among those with T2D, and that this might explain some of the differences observed between those with T2D and healthy subjects. With regard to classification of T2D, there may be difficulties in differentiating between T2D and latent autoimmune diabetes of adults (LADA)( Reference Tuomi, Santoro and Caprio 33 ), and this can introduce some misclassification of T2D cases( 24 ). However, as nutrition plays an important role in the treatment of both LADA and T2D, this misclassification should not have a major impact on the results.
The time period between the two FFQ was 12 years, which is a lengthy time period, and we cannot rule out that the observed greater changes in diet among men who developed T2D are due to other causes than disease. However, by exploring changes in diet also among men who remained diabetes free, we were able to explore the magnitude of changes in diet that might be due to secular trends, as the intake of fruits and vegetables (including root vegetables) has increased among adults in Sweden between 1997/1998 and 2010/2011( 34 ). Further, the number of questions on diet differed between the two questionnaires with more items included in the 2009 questionnaire. As any separated or added questions could bias the results, we only assessed food items that were presented in exactly the same way in both questionnaires. Although we cannot fully exclude that the results could be affected by the differences between the FFQ, our approach should have minimised the possible impact on observed changes in intake.
Another limitation concerns the fact that the severity of T2D or the medical treatment, which could not be accounted for in the present study, may impact the dietary change. However, the proportion of those who fulfilled recommendations for carbohydrates, protein and fat were similar for different treatment groups of T2D in six Mediterranean countries( Reference Thanopoulou, Karamanos and Angelico 13 ). It was concluded that those with T2D seem to adhere better to nutritional recommendations, irrespective of medical treatment, in comparison with those with type 1 diabetes( Reference Thanopoulou, Karamanos and Angelico 13 ). Further, we have no information on to what extent men who developed T2D received education in nutrition or sought information through patient organisations, and we could not explore the possible impact of these support services. Swedish dietary recommendations for diabetes available during the time period between the two FFQ stated that vegetables should be consumed at every meal and fruits should be consumed every day( 35 ). The patient organisation of diabetes had at that time a similar recommendation for vegetables, but was more specific for fruits and stated that they should be consumed a couple of times per day( 36 ). Further, most patients with T2D are treated at primary-care facilities with the exception of more complicated cases( 24 ). Closer to 90 % of the primary-care facilities have access to a nurse who is educated in the care of patients with diabetes and nurses have an important and central role. However, the availability of consultation with a dietitian is low, and group-based training is provided by about 20 % of the primary-care facilities( 37 ). Diet and physical activity can be considered the core treatment for T2D( Reference Evert, Boucher and Cypress 2 ), and it may be the only treatment for many newly diagnosed cases. The low availability of dietitian- and/or group-based training may therefore have health consequences as those who develop T2D could be lacking in nutritional education and other aspects of disease management. The importance of improvement in diet lies in its favourable impact on risk factors associated with complications related to T2D, and as complications can be prevented and quality of life maintained the clinical relevance of education in nutrition cannot be stressed enough.
When using the cut-off point of ≥5 servings of fruits and vegetables/d, 36 % of men who developed T2D and 35 % among men who remained without T2D fulfilled this criterion in 2009. Although percentages for the years 1997 and 2009 cannot directly be compared because of added items in the 2009 FFQ, the proportions for the years were reverse between the groups – that is, fewer men who developed T2D fulfilled the recommendation of ≥5 servings of fruits and vegetables/d in 1997 compared with men who remained without diabetes. In 2009, conditions were reversed, as men who developed T2D fulfilled this criterion to a larger extent than men who remained without diabetes. However, as similar percentages were observed in both groups, one can conclude that there is a need for increased consumption of fruits and vegetables overall.
The Mediterranean diet, rich in fruits and vegetables, has been shown to reduce the risk of developing T2D( Reference Martinez-Gonzalez, de la Fuente-Arrillaga and Nunez-Cordoba 38 ), as well as to improve glucose tolerance and reduce the risk for CVD among individuals with already developed T2D( Reference Ley, Hamdy and Mohan 39 ). In addition, total intake of fruits, vegetables and legumes has also been associated with reduced risk of all-cause and cardiovascular mortality in the diabetic population( Reference Nothlings, Schulze and Weikert 40 ). Although the present study indicates improvements in diet concerning consumption of fruits and vegetables, one can conclude that the magnitude of the T2D epidemic, and the risk of subsequent complications, reinforces the need for nutritional education among this population.
Acknowledgements
The authors thank the Swedish National Diabetes Register for data contribution.
This work was supported by The Swedish Research Council.
C. O., A. D., N. O. and A. W. contributed to the design of the study. C. O., A. D. and N. O. performed the statistical analyses. C. O. drafted the manuscript. A. W., C. O., A. D., A. Å., N. O., K. B. and A. W. contributed to the interpretation of data and critically revised the manuscript for important intellectual content. C. O. and A. W. are the guarantors of this work. All authors gave final approval.
The authors declare that there are no conflicts of interest.


