


Water is a multifunctional macronutrient critical for homoeostasis(Reference Jéquier and Constant1,Reference Sawka, Cheuvront and Carter2) . However, the importance of water consumption is often ignored due to the abundance of water and its lack of energetic content(Reference Rush3). Accordingly, a significant proportion of the US population does not meet the Institute of Medicine’s daily water intake recommendation(Reference Drewnowski, Rehm and Constant4,Reference Rosinger and Herrick5) . Individuals who do not meet these recommendations are at a greater risk for dehydration(6) which can disturb mood state(Reference Ganio, Armstrong and Casa7,Reference Armstrong, Ganio and Casa8) , and this can lead to negative quality of life(Reference Bloch9).
The most common type of dehydration induces extracellular fluid hypertonicity (high plasma osmolality) with a concomitant decrease in extracellular fluids (low plasma volume), also known as hypertonic-hypovolaemia(Reference Cheuvront and Kenefick10). Arginine vasopressin (AVP) is released in response to elevated plasma osmolality to regulate body fluid homoeostasis through renal water retention(Reference Koshimizu, Nakamura and Egashira11) and thirst activation(Reference Bichet12). While a small increase (>2 %) in plasma osmolality stimulates AVP secretion and thirst, a decrease in plasma volume does not stimulate either of those responses until a significant decline is reached (>10 %)(Reference Stachenfeld13,Reference Balanescu, Kopp and Gaskill14) .
When these responses are not able to restore uncompensated water losses, dehydration can occur and induce disturbances to cognition and mood. Specifically, recent studies have reported that cognitive function and mood are impaired when mild dehydration (<2 % reduction in body weight) is present(Reference Ganio, Armstrong and Casa7,Reference Armstrong, Ganio and Casa8,Reference Edmonds, Crombie and Ballieux15–Reference Benton, Jenkins and Watkins18) as well as by water deprivation for 24 h or more(Reference Pross, Demazières and Girard19–Reference Shirreffs, Merson and Fraser21). However, common methods for inducing dehydration (i.e. exercise and heat exposure) result in the presence of potential confounding factors such as physical fatigue, alterations in exercise-associated hormones or elevated body temperature, which may also cause disruption in cognition and mood, independently(Reference Grandjean and Grandjean22–Reference Sharma, Sridharan and Pichan26). Small increases in body temperature (approximately 0·5°C) and other parameters that occur across the circadian cycle have been found to enhance mood, which could alter results found in 24-h water deprivation studies(Reference Benton and Young23). As a result, it is unclear how dehydration independently influences mood.
Thus, the aim of the current study was to examine the acute effect of cellular dehydration on mood in healthy adults, by utilising controlled methodology that minimises confounding factors. We hypothesised that cellular dehydration in the absence of hypovolaemia would have a negative impact on mood. A secondary aim of this study was to examine fluid regulatory pathways that may explain the relationships between dehydration and mood.
Methods
Subjects
Seventy-seven volunteers from North-West Arkansas were screened throughout 1 year (April 2016 and March 2017), of which sixty-five were enrolled in this study after initial screening with medical history questionnaire. Twelve volunteers were ineligible to participate, while five subjects later decided not to complete the study (online Supplementary Fig. S1). While sixty subjects completed the study, twelve were excluded from analyses (no mood data, n 9; outliers based on copeptin analysis, n 3), resulting in n 49. Subject enrolment was balanced to control for sex (twenty-seven females). All the participants were compensated with pre-paid gift card after completing the study.
Females and males aged 30–55 years with a sedentary lifestyle were included in the current study. Prior to enrolment, volunteers completed a medical history questionnaire and were excluded upon recommendation by an advanced nurse practitioner if they self-reported diabetes (since the original aims of this clinical trial was to investigate the effect of vasopressin on glucose regulation), kidney disease, metabolic disorders, CVD, surgical operation on digestive tract (except possible appendectomy), drastic change in weight in the last month (≥3 kg) and/or other potential fluid balance covariates (e.g. habitual use of non-steroidal anti-inflammatory drugs, serotonin reuptake inhibitors). Female volunteers were excluded if they reported current pregnancy, lactation or use of injectable contraceptives. Females who reported use of oral contraception satisfied inclusion criteria as long as they included a 7-d washout period during their monthly cycle. Participants were considered enrolled once they were screened, were determined to satisfy inclusion and exclusion criteria and signed an informed consent statement. The institutional review board for human experimentation approved this study in accordance with the Helsinki Declaration of 1975 as revised in 1983. This trial was registered at www.clinicaltrials.gov as NCT02761434 with the name HYPERGlu.
Experimental design
Subjects visited the laboratory on two separate occasions in a counterbalanced, crossover order. During both visits, subjects completed a 120-min saline (0·1 ml/kg per min) infusion and were blinded to the concentration of the saline administered. Subjects were infused with hypertonic saline (HYPER; 3 % NaCl) to osmotically stimulate vasopressin secretion in one trial and were infused with isotonic saline (ISO; 0·9 % NaCl) to serve as a control in the other visit(Reference Feig and McCurdy27). Subjects were assigned in order to either ISO/HYPER or HYPER/ISO based on the sequence of enrolment, balanced by sex. Hence, fifteen males and fifteen females underwent the ISO trial first followed by HYPER in a single-blinded manner, whereas the rest of the subjects performed HYPER first followed by ISO. A 1-week washout period between trials was used for males or for females who were post-menopausal or ovariectomised. To limit the influence of reproductive hormones on body fluid balance, females with regular menstrual cycles were tested during the early follicular phase with a washout period of one menstrual cycle.
Prior to both trials, subjects were instructed to abstain from exercise, caffeine and alcohol intake for 24-h preceding testing. Subjects were also provided with a food diary before their first trial and recorded all food and fluid intake during the 24 h prior to the trial. They were then encouraged to replicate food and fluid consumed in the 24 h prior to the second trial. To provide additional standardisation of food intake, subjects were provided with a frozen meal to prepare and consume for dinner before each trial (two Smart Ones Spaghetti bowls; 506 kcal, 78 g carbohydrates, 10 g fat, 26 g protein). Between dinner and testing the next day, subjects fasted for 10 h during which they were allowed to consume plain water. Subjects were also provided with bottled water (2 litres for females and 3 litres for males) and instructed to consume the entire volume within the 24-h period preceding testing to ensure adequate hydration(Reference Sawka, Cheuvront and Carter2).
Upon arrival at the laboratory, subjects provided a urine sample to confirm euhydration by assessment of urine-specific gravity (<1·020). Subjects remained seated throughout testing to limit shifts in intercompartmental body fluids; standing up and laying down were not permitted. Once seated, an intravenous (IV) catheter was placed into an antecubital vein. Baseline blood samples were collected a minimum of 20 min after IV placement. Saline infusion commenced following blood sample collection via an IV pump (Baxter Flo-Guard® 6201, Baxter Healthcare Corporation) for 120 min at a constant rate of 0·1 ml/kg per min. Blood samples were collected every 30 min (0–120 min), followed by assessment of blood pressure in duplicate from the non-catheterised arm (Tango+, SunTech Medical Inc.). Diastolic blood pressure (DBP) and systolic blood pressure were later used to calculate mean arterial pressure through the following equation: mean arterial pressure (mmHg) = DBP + ((systolic blood pressure − DBP)/3)(Reference Madhavan, Ooi and Cohen28).
Subjects were asked to report their perception of thirst for every 30 min time point with a 175 mm visual analogue scale (VAS). The scale had an anchor on the left side of the scale (0 mm) indicating absence of thirst and no desire to drink anything (‘not thirsty at all’), while there was another anchor at 125 mm, representing the greatest sensation of thirst they had ever felt prior to this trial (‘extremely thirsty’). The line was extended beyond 125 mm and up to 175 mm, and participants were permitted to designate thirst sensation beyond 125 mm and up to 175 mm points if they felt thirst surpassed those levels. Alertness was also assessed by using 175 mm VAS. The only difference from the VAS for thirst was that the anchor on one side (0 mm) indicated no alertness at all, while the other side (125 mm) indicated ‘extremely alert’. Finally, subjects completed the validated thirty-five-question Adult Short Profile of Mood States (POMS) questionnaire (POMS 2®-A Short, Multi-Health Systems Inc.) immediately before and after the 120-min infusion period, while they were sitting in the same chair with the IV catheter still attached. Responses were scored and used to quantify total mood disturbance as well as the seven mood sub-scales (range of each sub-scale 0–20): anger-hostility, confusion-bewilderment (CB), depression-dejection (DD), fatigue-inertia (FI), tension-anxiety, vigour-activity (VA) and friendliness. Total mood disturbance (TMD) score (range −20 to 100) was calculated as follows: TMD = (anger-hostility + CB + DD + FI + tension-anxiety) −VA(Reference Heuchert and McNair29). TMD is not a comprehensive measure of mood disturbance. Generalisations from summing the sub-scales of the POMS and considering this score to be equivalent to a direct measure of overall mood are not justified as noted by Ekkekakis & Zenko(Reference Ekkekakis and Zenko30).
Biochemical analysis
Haematocrit and Hb concentrations were used to calculate plasma volume change across the 120-min intervention based on the Dill & Costill equation(Reference Dill and Costill31). Plasma Na (ion-selective electrode analysis) and osmolality (freezing point depression) were analysed every 30 min (0–120 min). Instead of AVP which is unstable and quickly cleared (half-life of about 20 min)(Reference Robertson, Mahr and Athar32,Reference Heida, Boesten and Ettema33) , we measured its surrogate biomarker copeptin with an ultra-sensitive sandwich immunoassay (B·R·A·H·M·S Copeptin proAVP Kryptor Compact Plus, Thermo Fisher). Copeptin is a thirty-nine amino acid molecule, which is the c-terminal portion of the pre-provasopressin. It is stable in plasma or serum ex vivo and is stoichiometrically secreted with AVP in a 1:1 ratio; thus, it is secreted in equimolar proportion to AVP. Hormones of the renin–angiotensin–aldosterone system (angiotensin II by radioimmunoassay; aldosterone and plasma renin activity by liquid chromatography/tandem MS) and hormones of the hypothalamic–pituitary–adrenal (HPA) axis for stress response (human corticotrophin-releasing hormone (CRH), adrenocorticotropic hormone (ACTH) and total cortisol by ELISA) were measured at baseline (0 min) and at the end of the intervention (120 min).
Sample size calculation
The study of mood outcomes was a secondary objective of this clinical trial, whose primary objective was to evaluate the glycaemic response to an oral glucose tolerance test after hypertonic saline infusion(Reference Jansen, Suh and Adams34). Thus, no power calculation for mood outcomes was made. However, the sample size in this study was consistent with many previous studies examining mood changes in response to dehydration(Reference Jansen, Suh and Adams34,Reference Pross, Demazières and Girard35) . Moreover, the mood state questionnaire was administered before the oral glucose tolerance test. Therefore, oral glucose tolerance test did not affect the results of the current study.
Statistical analysis
Baseline data were assessed via the Shapiro–Wilk test for normality. Data that violated the normality assumption were log transformed. Repeated-measures ANOVA on plasma osmolality, copeptin, thirst, alert, hormones of renin–angiotensin–aldosterone system and POMS scales were evaluated within-subject effects across conditions and time, as well as between-subject effects for sex. Significant main effects were further analysed using contrast comparisons and Tukey HSD tests for multiple comparisons. Mood data were also stratified by sex and then evaluated for within-subject effects across conditions and time with repeated-measures ANOVA and Tukey HSD tests for multiple comparisons. The increment of copeptin and thirst only during HYPER trial in males and females was presented by plasma osmolality, after plasma osmolality was stratified into quintile. The effects were evaluated with ANOVA and Tukey HSD tests for multiple comparisons as well. All data are reported in mean values and standard deviations, and statistical significance was set a priori at α of 0·05. All analyses were performed with the software package JMP® Pro 14.1.0 (SAS Institute Inc. 2018).
Results
Baseline subjects’ characteristics are shown in Table 1. Hypertonic saline infusion induced a gradual increase in plasma osmolality that exceeded 300 mmol/kg after 2 h of infusion in both males and females (P < 0·01), while it remained unchanged in the ISO trial (P = 0·30, Fig. 1). Plasma copeptin and thirst also increased in the HYPER trial compared with the ISO trial in both males and females (P < 0·01). Compared with males, females had greater copeptin levels at the end of the infusion (120 min) (21·3 (sd 2·0) v. 14·1 (sd 1·4) pmol/l; P < 0·01) and greater thirst throughout the entire trial including at baseline. The plasma copeptin and thirst responses according to plasma osmolality categories during the HYPER trial by sex are plotted in Fig. 2(a) and (b), respectively. While plasma copeptin levels observed with plasma osmolality categories below 300 mmol/kg were similar between sexes (P > 0·05), there was a clear distinction between sexes in categories above 305 mmol/kg (P < 0·01). For plasma osmolality ≥305 mmol/kg, plasma copeptin was 19·8 (sd 10·4) pmol/l in females and 13·4 (sd 7·2) pmol/l in males.
Table 1. Subject characteristics
(Mean values and standard deviations)

* Mean value was significantly different from that of females.

Fig. 1. Time course response of plasma osmolality (a), copeptin (b) and thirst (c) with hypertonic and isotonic saline infusion in males and females. * Statistically significant difference (P < 0·05) between trials for the same time point, † difference in comparison with baseline value for the same trial and § difference between sexes. Error bars were displayed in one direction (HYPER: upwards, ISO: downwards) to avoid overlap. ![]() , HYPER, female;
, HYPER, female; ![]() , HYPER, male;
, HYPER, male; ![]() , ISO, female;
, ISO, female; ![]() , ISO, male.
, ISO, male.

Fig. 2. Response of plasma copeptin (a) and thirst (b) by change in plasma osmolality during the HYPER trial in males (open circle: •) and females (closed triangle: ▴). Error bars were displayed in one direction (HYPER: upwards, ISO: downwards) to avoid overlap.
For all participants in the HYPER condition, the POMS sub-scales of CB, DD and FI increased (P < 0·05, Table 2). When the data were stratified by sex, FI increased only in females (P < 0·01), whereas the increases in CB and DD were not significant in males or females (P > 0·05). In agreement with the results from the POMS, self-reported alertness, assessed by the VAS, also decreased in the HYPER trial (pre 99 (sd 24) mm, post 73 (sd 32) mm; P < 0·01), but was maintained in the ISO trial (pre 95 (sd 27), post 92 (sd 22); P = 0·94). However, no sex differences were observed in the alertness scale in either trial (P = 0·84). Post intervention TMD score was significantly higher in the HYPER trial compared with the ISO trial (16·6 (sd 11·6) v. 10·9 (sd 7·9); P < 0·01; Fig. 3). Compared with baseline, TMD score assessed by POMS increased significantly in the HYPER trial (∆pre–post 6·3 (sd 10·8), P < 0·01), while it remained unchanged in the ISO trial (∆pre–post 0·6 (sd 4·5), P = 0·99). There was interaction among trial, time point and sex (P = 0·16) in the full-factorial model. However, when stratified by sex, the increase in TMD score in the HYPER trial was significant in females (P < 0·01) but not in males (P = 0·42). Post copeptin value was not correlated with post TMD score (R 2 0·02, P = 0·18); however, post copeptin was significantly correlated with one of the post POMS sub-scales, FI only in females when stratified by sex (R 2 0·14, P = 0·01). In addition, post intervention thirst values showed a significant correlation with post intervention TMD (R 2 0·24; P < 0·01) as well as its sub-scales such as CB (R 2 0·06; P = 0·01), FI (R 2 0·27; P < 0·01) and VA (R 2 0·17; P < 0·01). Plasma volume expanded with saline infusion in both trials and the expansion was greater in the HYPER trial compared with the ISO trial (P < 0·01, Table 3). However, no significant change was observed in blood pressure in HYPER (Δsystolic blood pressure −0·4 (sd 2·1), ΔDBP −0·2 (sd 1·7) mmHg; P > 0·05) nor ISO (Δsystolic blood pressure −1·5 (sd 2·0), ΔDBP −1·4 (sd 1·4) mmHg; P > 0·05) trials. Among the renin–angiotensin–aldosterone system hormones, angiotensin II was suppressed (P > 0·05), while plasma renin activity and aldosterone were reduced (P < 0·05) during both trials (Table 3). Among the HPA axis hormones, cortisol decreased only in the ISO trial (P < 0·01) but was maintained in the HYPER trial (P = 0·11; Table 3). While baseline ACTH was higher in males than females for the HYPER trial (P = 0·03), no changes in ACTH or CRH were observed in either trial (P > 0·05).
Table 2. Scores of total Profile of Mood States sub-scales
(Mean values and standard deviations)

* Mean value was significantly different from that pre-intervention.
† Mean values were significantly different between trials at the same time point.
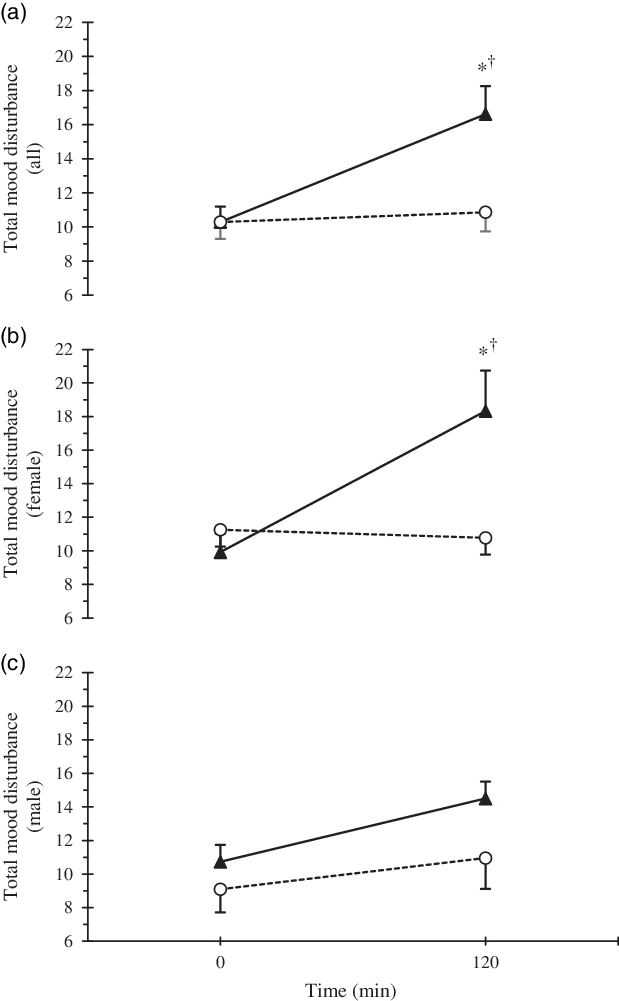
Fig. 3. Time course response of total mood disturbance by trial (a) and separated by sexes (b). * Statistically significant difference (P < 0·05) between trials, and † difference in comparison with baseline value for the same trial. Error bars were displayed in one direction (HYPER: upwards, ISO: downwards) to avoid overlap. ![]() , HYPER,
, HYPER, ![]() , ISO.
, ISO.
Table 3. Plasma volume and hormonal responses
(Mean values and standard deviations)

PV, plasma volume; PRA, plasma renin activity; CRH, corticotrophin-releasing hormone; ACTH, adrenocorticotropic hormone.
* Mean value was significantly different from that pre-intervention.
† Mean value was significantly different from that of females.
‡ Mean value was significantly different from that of the hypertonic infusion trial.
Discussion
In the present study, we examined the effect of cellular dehydration independent of the effect of hypovolaemia that is usually present during dehydration. These data indicate that acute cellular dehydration due to changes in the osmotic gradient degrade specific aspects of mood in healthy females. In addition, thirst significantly increased in the HYPER condition. Changes in the osmotic gradient were documented by an elevation of plasma osmolality (Fig. 1(a)).
During the HYPER trial, we observed an increase in the POMS sub-scales of CB, DD and FI as well as an increase in the TMD score of the POMS in the full-factorial model. When stratified by sex, significant increases in FI and TMD were observed in females, but not males. No significant changes in mood were observed during the ISO trial. Similarly, alertness score, evaluated by a VAS, declined only in the HYPER condition. The negative impact of osmotic stimulation on specific POMS sub-scales and alertness as measured by an analogue scale in the present study was consistent with previous studies of dehydration that employed exercise(Reference Ganio, Armstrong and Casa7,Reference Armstrong, Ganio and Casa8) , combined exercise and heat exposure(Reference Ely, Sollanek and Cheuvront25), and water deprivation(Reference Pross, Demazières and Girard19–Reference Shirreffs, Merson and Fraser21). While one water deprivation study(Reference Pross, Demazières and Girard19) did not assess the level of dehydration, the remaining aforementioned studies induced approximately 1–2 % dehydration(Reference Ganio, Armstrong and Casa7,Reference Armstrong, Ganio and Casa8,Reference Shirreffs, Merson and Fraser21) , with the exception of the heat and exercise protocol that induced approximately 4 % dehydration(Reference Ely, Sollanek and Cheuvront25).
In agreement with the present study, TMD has previously been shown to increase after exercise-induced dehydration in females(Reference Armstrong, Ganio and Casa8) and exercise- and heat-induced dehydration in males(Reference Ely, Sollanek and Cheuvront25). The one water deprivation study that assessed mood did not report TMD(Reference Pross, Demazières and Girard19); thus, it is not clear whether all methods of dehydration affect TMD. In terms of specific POMS subscales affected and sex differences observed, previous literature has shown varying degrees of agreement depending on the method of dehydration utilised. Similar to the findings in the current study, all methods of dehydration previously reported induced significant increases in FI(Reference Ganio, Armstrong and Casa7,Reference Armstrong, Ganio and Casa8,Reference Pross, Demazières and Girard19,Reference Ely, Sollanek and Cheuvront25) , whereas only exercise and 24-h water deprivation induced a corresponding decrease in VA(Reference Armstrong, Ganio and Casa8,Reference Pross, Demazières and Girard19) . Significant time effects were reported for FI and VA across 24-h water deprivation, suggesting perception could be related to the amount of time an individual spends becoming dehydrated and/or maintaining a dehydrated state. Similarly, participants reported significantly greater tiredness after 24-h(Reference Shirreffs, Merson and Fraser21) and 28-h(Reference Szinnai, Schachinger and Arnaud20) water deprivation compared with euhydrated conditions, but not after 37 h(Reference Shirreffs, Merson and Fraser21). Thus, the duration of water deprivation/controlled water intake protocols alone may induce a degree of fatigue or tiredness that confounds the observed relationship with dehydration. Additionally, FI in males was adversely affected by dehydration via exercise and exercise in heat(Reference Ganio, Armstrong and Casa7,Reference Ely, Sollanek and Cheuvront25) , but not by cellular dehydration in the current study. This suggests that physical and/or environmental stress may have a greater influence on males’ perception of FI when dehydration is achieved in a longer time period. In contrast, dehydration achieved within a shorter time period appears to adversely affect females’ perception of FI regardless of the methodology.
The influence of dehydration on CB and DD is less clear. CB was significantly increased by exercise in the heat in males(Reference Ely, Sollanek and Cheuvront25) and 24-h water deprivation in females(Reference Pross, Demazières and Girard19) in females, whereas DD was significantly increased by exercise in the heat in males(Reference Ely, Sollanek and Cheuvront25) and cellular dehydration. Alertness, a measure of cognitive function, was significantly reduced with cellular dehydration in males and females and is reported to be adversely affected by water deprivation(Reference Pross, Demazières and Girard19–Reference Shirreffs, Merson and Fraser21). While alertness was not assessed in exercise or exercise and heat studies, those protocols were found to have minimal to no effects on cognitive performance(Reference Ganio, Armstrong and Casa7,Reference Armstrong, Ganio and Casa8,Reference Ely, Sollanek and Cheuvront25) .
One potential mechanism through which dehydration may adversely influence mood is the HPA axis. Mood state is associated with stress responses(Reference van Eck, Berkhof and Nicolson36), and the HPA axis is a stress response system that links the central nervous and endocrine systems(Reference Sivukhina and Jirikowski37). When a threat or other adverse environmental condition is present, the HPA is activated via a central pathway that increases activity in the amygdala and activates the hypothalamus. The state of dehydration is a direct threat to the survival of the organism which must be rapidly addressed by appropriate behavioural actions such as seeking water and/or altering the environmental condition that is causing dehydration, such as finding a cooler environment. Perception of increased thirst and dysphoric mood is both likely to contribute to this adaptive, homoeostatic responses. Since we found a significant increase in thirst during the HYPER trial, we examined the relationship between thirst and the individual sub-scales of the POMS. There were significant correlations between three sub-scales of the POMS (CB, FI and VA) and thirst. This suggests that thirst may be an important cue to alert individuals who are in danger of significant dehydration by altering specific aspects of mood such as fatigue. AVP influences this interaction as it is synthesised with CRH in the paraventricular nucleus in the brain and can synergistically increase ACTH production, which regulates cortisol secretion(Reference Sivukhina and Jirikowski37). Goncharova et al. reported that AVP receptor 1b antagonist injection reduced ACTH secretion in response to insulin-induced hypoglycaemia in female primates apparently experiencing increased anxiety, as indicated by increased motor activity(Reference Goncharova, Oganyan and Marenin38). One recent human study also examined thirst and mood with mild hypohydration induced by water restriction and heat and suggested that autonomous nervous system activity, measured with fMRI, may have negative consequences for mood(Reference Young, Cousins and Johnston17). Copeptin, as a surrogate marker of vasopressin, has been studied for its potential role in various health issues(Reference Dobša and Cullen Edozien39) and its interaction with CRH(Reference Lewandowski, Lewiński and Skowrońska-Jóźwiak40). Although increases in copeptin were observed with cellular dehydration in the present study, ACTH, CRH and cortisol did not appear to be influenced. Osmotic stimulation appeared to counteract the typical decrease in cortisol that occurs throughout the day, which was observed in the ISO trial. However, cortisol was not elevated beyond the baseline value. Thus, it is not likely that mood state was altered through stimulation of the stress response. Similarly, changes in cortisol were not observed with adverse changes in mood after dehydration induced by intermittent moderate exercise in males(Reference Ganio, Armstrong and Casa7) and females(Reference Armstrong, Ganio and Casa8).
In addition to its anti-diuretic effects, AVP has various physiological and behavioural functions(Reference Koshimizu, Nakamura and Egashira11) and they may explain the observed relationship between cellular dehydration and mood. While this has largely been assessed in animal models, preliminary investigations in humans have demonstrated continuity in the behavioural effects of AVP(Reference Caldwell, Lee and Macbeth41,Reference Mccall and Singer42) . For example, AVP may play a role in anxiety and depression-related behaviour(Reference Caldwell, Lee and Macbeth41). Anxiety in particular appears to be regulated in part by the AVP receptor 1a. AVP receptor 1a knockout mice display lower anxiety-like behaviour, assessed by the time spent in the light, than wildtype animals(Reference Egashira, Tanoue and Matsuda43), while AVP receptor 1a overexpression in mice leads to anxiety-like behaviour(Reference Bielsky, Hu and Ren44). Another animal study orally administered a V1bR antagonist to mice and observed antidepressant-like effects(Reference Griebel, Simiand and Serradeil-Le Gal45). Similarly, high plasma AVP in humans has been correlated with both high levels of anxiety and major depressive disorders(Reference Caldwell, Lee and Macbeth41). Additional relevant findings from animal models have not been assessed in humans to date. For example, Faraco et al. reported that water deprived mice with elevated plasma AVP up-regulated endothelin-1, a vasoconstrictor in the cerebral blood vessels, causing cerebrovascular and cognitive dysfunction(Reference Faraco, Wijasa and Park46).
Previous studies reported that mild dehydration (<2 % body weight loss) induced by exercise could increase plasma osmolality to 300 mmol/kg(Reference Cheuvront and Kenefick10,Reference Popowski, Oppliger and Lambert47) . In the current study, plasma osmolality increased across the HYPER trial in a similar manner in both sexes (Fig. 1(a)), whereas plasma copeptin was significantly higher in females compared with males in the last two time points (Fig. 1(b)). Stratification of the plasma copeptin response to various levels of plasma osmolality revealed a greater sensitivity to plasma osmolality ≥300 mmol/kg in females (Fig. 2(a)). There was no correlation between post copeptin value and post TMD score in the current study; however, post copeptin was still correlated with FI in females, but not in males. Collectively, these data suggest the observed sex differences in mood may be related to AVP stimulation as measured by copeptin. Interestingly, previous 120-min hypertonic saline (3 % NaCl) infusion induced a greater sensitivity to plasma osmolality in males compared with females in the early follicular menstrual phase(Reference Stachenfeld, Splenser and Calzone48). Elevated plasma AVP was observed in males after 10 min of infusion and was maintained for the duration of the infusion. However, plasma osmolality did not appear to surpass 300 mmol/kg in either sex. While authors attributed sex differences in AVP sensitivity to oestrogen and testosterone(Reference Stachenfeld, Splenser and Calzone48), that theory appears to be contradicted by the present data.
Although the current study was conducted in a carefully controlled manner, there are several limitations. For example, a measure of global mood state would have improved the study given the limitations associated with the TMD score of the POMS as discussed above. Mood is inherently a diffuse-dependent measure(Reference Ekkekakis and Petruzzello49), and such a measure may have detected additional changes of mood in males. Additionally, the administration of any mood survey in a laboratory environment after spending hours in a chair with an IV is dissimilar from normal daily life. Also, it should be noted that isolated cellular dehydration is difficult to relate directly to real-world dehydration, since increases in plasma osmolality are typically accompanied by significant decreases in plasma volume. Finally, although we infused the same volume of saline in both trials, the osmotic load associated with the hypertonic saline led to greater volume expansion in HYPER trial. However, renin–angiotensin–aldosterone system was suppressed in both trials as a response to baroreceptors loading.
In conclusion, the present study indicated that cellular dehydration induced by the hypertonic saline infusion acutely degraded mood state mainly in women. The underlying mechanisms to explain these sex differences remain to be determined but may be related to higher AVP levels, as assessed by copeptin in women.
Acknowledgements
We would like to thank Craig Crandall, Michael Joyner, Avin Rekhi and Carlos Acosta for their support with the project approval. Also, we thank Zachary Lewis, Bruce Wall, Marshall Ward, Kyle Cook, Chunbo Young, Rachel Graham and Cameron Sprong for their valuable help during data collection.
The study was funded by a grant from Danone Research, France (no. EAU-8644-GD).
S. A. K., G. L. and E. T. P. designed the study; H. G. S., L. T. J., J. D. A., C. L. B., T. W. K. and O. M. conducted data collection and/or sample analysis; S. A. K., H. G. S., L. T. J., J. D. A. and A. T. C. analysed the data; H. G. S., A. C., S. A. K., H. R. L., E. T. P., A. D. and T. V. wrote the manuscript; S. A. K. was the principal investigator and had primary responsibility for the final content. All authors read, critically revised and approved the final manuscript.
H. G. S., L. T. J., J. D. A., C. L. B. and T. W. K. do not have any conflicts of interest to declare. A. D. S. is a scientific consultant for Gatorade Sports Science Institute; T. V., A. D., G. L. and E. T. P. are employees of Danone Research; H. R. L., O. M. and S. A. K. have served as occasional consultants; O. M. and S. A. K. have received grants from Danone Research; S. A. K. has served as an occasional scientific consultant for Quest Diagnostics and has received grants from Standard Process.


