


Hyperglycaemia, including postprandial hyperglycaemia, is recognised to contribute to microvascular and macrovascular complications in subjects with type 2 diabetes( Reference Sudhir and Mohan 1 ). Postprandial hyperglycaemia has also been shown to be an important contributor to overall glycaemic control and a predictor of myocardial infarction and mortality( Reference Cavalot, Petrelli and Traversa 2 , Reference Hanefeld, Fischer and Julius 3 ). Postprandial glucose increments contribute more to HbA1c in well-controlled patients and contribute with approximately 70 % in patients with HbA1c<7·3 %( Reference Monnier, Lapinski and Colette 4 ). Such findings suggest that treatments that specifically reduce postprandial glucose excursions will significantly decrease HbA1c ( Reference Monnier, Colette and Owens 5 ). Dietary management, often focusing on weight loss, is suggested to be a cornerstone of the prevention and treatment of type 2 diabetes mellitus (T2DM)( 6 ). However, results from most studies focusing on body weight reduction have been disappointing, as weight gain inevitably followed shortly after the interventions( Reference Strohacker, McCaffery and MacLean 7 , Reference Evert, Boucher and Cypress 8 ).
Some evidence suggests that the macronutrient composition of the diet plays a role in the postprandial and diurnal glucose excursions in T2DM( Reference Gannon and Nuttall 9 ) and changes in the macronutrient composition of the diet intended to reduce postprandial glycaemia may be a tool to reduce HbA1c and diabetic complications( Reference Pearce, Noakes and Keogh 10 ). Carbohydrate content in the meal has been shown to be the most important factor of postprandial glycaemia in T2DM( Reference Nuttall, Almokayyad and Gannon 11 ).
The aim of this mechanistic study was to investigate whether a moderate reduction in carbohydrate in the diet might cause clinically meaningful reductions of postprandial hyperglycaemia and insulin hypersecretion (β-cell stress) in subjects with well-controlled T2DM. Incretin hormones were evaluated because of their role in postprandial glucose regulation( Reference Madsbad 12 ), and we also measured the effects on subjective satiety, as well as on the secretion of satiety-regulating hormones (peptide YY (PYY), cholecystokinin (CCK), glucagon-like peptide-1 (GLP-1)), to account for any changes in appetite sensations experienced by the T2DM patients in response to a macronutrient shift towards less carbohydrate and more protein and fat.
Methods
Subjects
In all, sixteen subjects with T2DM treated with metformin monotherapy, fourteen male and two female, with a median age of 65 (range 43–70) years and a BMI of 30 (sd 4·4) kg/m2 were included in the study. Median HbA1c at baseline was 6·5 % (47 mmol/l) (range: 5·5–8·3 % (37–67 mmol/l)) and mean fasting plasma glucose (PG) was 8·2 (sd 2·0) mmol/l. All participants were weight-stable before and throughout the study. Fasting insulin resistance, β-cell function and insulin sensitivity calculated by the homoeostasis model assessment (HOMA2-IR, HOMA2-%β and HOMA2-%S, respectively) (HOMA2 Calculator version 2.2.3; University of Oxford) were 2·4 (sem 1·0), 74·5 (sem 7·0) and 47·7 (sem 3·3), respectively( Reference Wallace, Levy and Matthews 13 ). Estimated daily total energy expenditure (TEE) was 10·3 (sem 1·4) MJ. Participants were recruited from August 2015 to June 2016 by searching through medical records at Bispebjerg Hospital, Copenhagen University, Denmark. In all, fifty-one subjects were contacted; of these, sixteen fulfilled the inclusion criteria and wished to participate: men and postmenopausal women below 70 years of age with T2DM and no recent smoking history. Diagnosis of T2DM was based on the American Diabetes Association criteria( 14 ) and negative plasma glutamate decarboxylase antibodies. Subjects with renal or liver disease, dietary restrictions or critical illness were excluded. The study was registered at clinicaltrials.gov (ID: NCT02472951) and the study protocol was approved by both the Health Ethics Committee of Copenhagen and the Danish Data Protection Agency. Written informed consent was obtained from all participants, and the study was in accordance with the Helsinki II declaration. No participants dropped out of the study.
Diet compositions
Two energy-matched diets providing 10·3 (sem 1·4) MJ/d were compared. All meals were weighed out individually to match each participant’s estimated TEE. A carbohydrate-reduced high-protein (CRHP) diet was compared with the conventional diabetes (CD) diet. Macronutrient composition of the CRHP diet corresponded to 31 % energy from carbohydrate, 29 % from protein and 40 % from fat. The CD diet was in accordance with the recommended diet for T2DM( Reference Mann, De Leeuw and Hermansen 15 ) and had 54 % energy from carbohydrate, 30 % from fat and 16 % from protein (Table 1). Fibre content was higher in the CD diet, whereas added sugar content and glycaemic index were comparable (>55) in both diets. Vitamin D and Ca contents were higher in the CRHP diet.
Table 1 Macronutrient composition and ingredients of test meals standardised at 10 MJ/d
CRHP, carbohydrate-reduced high protein; CD, conventional diabetes; E%, percentage of energy intake.
Study design
The study was a two-way, randomised, cross-over, controlled study and consisted of two separate 48-h interventions with a 2- to 8-week wash-out period between interventions. Participants were randomised by a study nurse to start with either a CRHP or CD diet by drawing blinded ballots. Participants were provided with their assigned diets for 2 consecutive days comprising breakfast, lunch, pre-dinner snack, dinner and post-dinner snack. Mixed meal tests (MMT) were performed at The Endocrine Research Unit, University of Copenhagen, Bispebjerg Hospital, Denmark, at breakfast and lunch both consecutive days on each diet. Snacks and dinner were provided to be consumed at home. A dual-energy X-ray absorptiometry (DXA) scan (Lunar iDXA; GE Healthcare) was undertaken before the intervention to allow a calculation of the individual resting energy expenditure (REE) from body composition( Reference Nielsen, Hensrud and Romanski 16 ). Physical activity level (PAL) was set to be 1·4 for all participants during intervention days. TEE was calculated as REE×PAL. In all, 30 % of TEE was ingested at breakfast, 30 % at lunch, 5 % as a pre-dinner snack, 30 % at dinner and 5 % as a post-dinner snack. Both diets were isoenergetic. All meals were weighed out individually to match each participant’s estimated TEE. Participants were also provided a standard isoenergetic dinner (macronutrient content: 55 % of energy from carbohydrates, 15 % from protein and 30 % from fat) to consume on the evening before the 48-h intervention period. Furthermore, participants were instructed to refrain from ingestion of alcohol and strenuous physical activity for 3 d before experimental days. Intake of coffee or tea was not allowed during intervention days. All participants were non-smokers.
Mixed meal tests
On each test day, participants arrived to the department after an overnight fast. Body weight was measured after voiding the bladder. Participants rested in a reclined position while a venous catheter was placed in an antecubital vein. Blood samples were drawn at times −10, 0, 10, 20, 30, 45, 60, 90, 120, 150, 180, 210, 240, 270, 280, 290, 300, 315, 330, 360, 390, 420 and 450 min (min). At each time point, the initial 2 ml of blood was discarded. Subjective appetite sensations were assessed at times 0, 30, 60, 120, 180, 240, 270, 300, 330, 390 and 450 min by using visual analogue scales (VAS)( Reference Gibbons, Finlayson and Dalton 17 ). Breakfast was served at time 0 min and lunch was served at time 270 min. Both meals were consumed within 30 min. Upon completion of each meal, participants rated the organoleptic quality of the meal by using VAS. Participants remained sedentary throughout the MMT.
Visual analogue scale
The organoleptic quality of each meal was assessed by four questions (appearance, taste, aftertaste and palatability) on 100 mm VAS, with a rating of 100 mm being the most positive score. Overall palatability of the meal was calculated as a general palatability score by calculating the mean of all four scores. To assess overall satiety, participants repeatedly rated four appetite sensations (satiety, fullness, hunger and prospective food consumption (PFC)) on a 100-mm VAS on which 100 mm was the most positive and 0 mm the most negative – that is a score of 100 mm on satiety means absolute satiation. Both the VAS scale and each sensation were thoroughly explained before breakfast MMT. A composite satiety score (CSS) was calculated with the following formula:
 $$\eqalign { &{\rm CSS }\,{\equals}\,{{{\rm satiety {\plus} fullness {\plus} (100 - hunger){\plus}(100 - PFC)}} \over {\rm 4}}.$$
The CSS integrates appetite sensations into one index (range 0–100 mm) and indicates overall satiety (or appetite suppression)( Reference Gibbons, Finlayson and Dalton 17 – Reference Chaput, Gilbert and Gregersen 19 ).
Analytical procedures
Plasma was acquired by collecting blood in pre-chilled EDTA tubes that were centrifuged immediately at 4°C, whereas serum was acquired by collecting blood in clot activator tubes that were left for 30 min before centrifugation. Plasma was used for analysis of total GLP-1, total glucose-dependent insulinotropic polypeptide (GIP), total PYY, glucagon and CCK at time points 0, 30, 60, 90, 120, 150, 180 and 240. Serum was used for analysis of insulin and C-peptide at all time points. PG was measured using YSI 2300 STAT plus (Yellow Spring Instruments) on plasma from blood taken in immediately centrifuged, smaller EDTA-containing tubes at all time points. Serum insulin and C-peptide were analysed using the IMMULITE 2000 Immunoassay System (Siemens Healthcare). Plasma CCK was measured by RIA using antiserum no. 92128, which binds all the bioactive forms of CCK in circulation (CCK-58, −33, −22 and −8) with equimolar potency and without cross-reactivity with the homologous gastrin peptides( Reference Rehfeld 20 ). For analysis of GLP-1, glucagon, PYY and GIP, plasma samples were first extracted with ethanol (70 % v/v). Measurement of total PYY( Reference Torang, Bojsen-Moller and Svane 21 ) was performed using monoclonal antibody MAB8500 (clone RPY-B12; Abnova), which reacts equally well with PYY1–36 and PYY3–36. The recovery of synthetic PYY3–36 and PYY3–34 added to plasma before extraction and assay was between 60 and 75 %. The plasma concentrations of GLP-1 were measured( Reference Orskov, Rabenhoj and Wettergren 22 ) using antiserum code no. 89390, which is specific for the amidated C terminus of GLP-1 and therefore reacts with all amidated GLP-1-containing proglucagon fragments. The results of the assay reflect the rate of secretion of GLP-1 because the assay mainly measures the sum of intact GLP-1 and the primary metabolite, GLP-1 9-36 amide, into which GLP-1 is rapidly converted. For the GIP RIA( Reference Krarup, Madsbad and Moody 23 ), we used the C-terminally directed antiserum code no. 867, which was raised against a synthetic peptide corresponding to the C terminus of human GIP. It does not cross-react with the so-called GIP 8000, whose chemical nature and relationship to GIP secretion is uncertain, but it reacts fully with the primary metabolite GIP 3–42. Plasma glucagon concentrations were measured with an antibody (code no. 4305) directed against the C terminus of the glucagon molecule and therefore mainly reacts with glucagon of pancreatic origin( Reference Lund, Bagger and Wewer Albrechtsen 24 ). The assay has been validated against sandwich ELISA and MS( Reference Lund, Bagger and Wewer Albrechtsen 24 , Reference Wewer Albrechtsen, Hartmann and Veedfald 25 ).
Calculations and statistics
All values and graphical presentations are expressed as and show the mean of both days on each diet for sixteen participants. AUC were calculated using the trapezoidal rule and net AUC were calculated by subtracting the area below fasting concentrations. Fasting concentrations were taken at time 0 min for all variables measured, except for glucose, C-peptide and insulin, for which fasting concentrations were calculated as means of the −10 and 0-min samples. Differences between AUC, peaks and so on were assessed using paired t tests unless normal distribution was not met, in which case Wilcoxon-matched pairs signed-rank test was used. Normal distribution was tested for with both the Shapiro–Wilk normality test and graphical evaluation. The difference between time points and treatments was analysed with two-way repeated-measures ANOVA with subjects as fixed effects and treatment and time as repeated measures. Post hoc comparisons at individual times of measurements were made with Bonferroni’s multiple comparison adjustment of significance levels for the pairwise comparisons between treatments.
Prehepatic insulin secretion rates (ISR) expressed in pmol/kg per min were derived by deconvolution of C-peptide concentrations for each individual from both dietary interventions by utilising a two-compartment model of C-peptide kinetics and population-based C-peptide parameters( Reference Van Cauter, Mestrez and Sturis 26 ) as implemented in the ISEC software program( Reference Hovorka, Soons and Young 27 ). Change in ISR in relation to change in PG from baseline to each individual peak after breakfast and lunch, respectively (ΔISR/ΔPG), expressed as pmol/kg per min per mm was calculated to evaluate initial β-cell glucose sensitivity (β-GS).
A difference between arms of 20 % with a standard deviation of 10 % was calculated to be detectable using a paired t test with a sample size of eight participants (power 0·90, significance level of 0·05).
All results are expressed as means with their standard errors unless normal distribution was not met, in which case medians and interquartile range (IQR) were used. Correlations were evaluated with Pearson’s correlation unless normal distribution was not met, in which case Spearman’s correlation was used. Statistically significant correlations will be presented. For all results, P-values below 0·05 were considered significant.
Statistical analyses were performed using GraphPad Prism (version 7.02; GraphPad Software).
Results
Glucose, insulin and C-peptide
No differences in fasting Glucose, insulin or C-peptide were found between the intervention days.
Glucose
A time×treatment interaction was found in the repeated measures of glucose. Peak plasma glucose concentrations were reached 60 min after breakfast and lunch, respectively, on both diets (Fig. 1(a)). Compared with the CD diet, the CRHP diet reduced peak glucose concentration by 18 % (2·1 (sem 0·3) mmol/l, P<0·0001) and 15 % (1·5 (sem 0·3) mmol/l, P<0·001) after ingestion of breakfast and lunch, respectively.
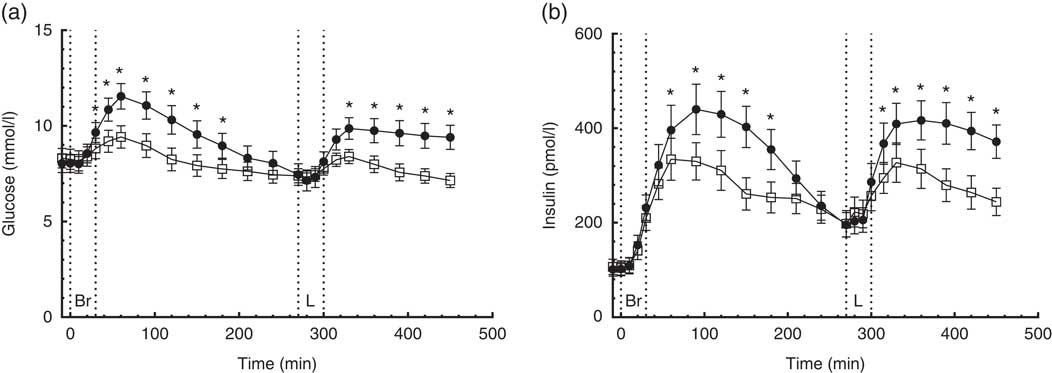
Fig. 1 7·5-h concentrations of glucose (a) and insulin (b) in sixteen subjects with type 2 diabetes mellitus after intake of a carbohydrate-reduced high-protein (CRHP, ![]() ) or conventional diabetes (CD,
) or conventional diabetes (CD, ![]() ) breakfast and lunch, respectively (mean of 2 consecutive days on each diet). Values are means with their standard errors. * Significant difference (P<0·05) between CD and CRHP diets.
) breakfast and lunch, respectively (mean of 2 consecutive days on each diet). Values are means with their standard errors. * Significant difference (P<0·05) between CD and CRHP diets.
Compared with the CD diet, the CRHP diet reduced total glucose AUC by 14 % (594 (sem 105) mmol/l×min, P<0·0001) and net glucose AUC by 121 % (704 (sem 108) mmol/l×min, P<0·0001).
Insulin
A time×treatment interaction was found in the repeated measures of insulin. Peak serum insulin concentrations on the CD diet were reached 90 min after ingestion of breakfast and lunch, respectively, compared with 60 min after ingestion of the CRHP diet breakfast and lunch (Fig. 1(b)). Compared with the CD diet, the CRHP diet reduced peak serum insulin concentration by 24 % (106 (sem 45) pmol/l, P=0·032) and 21 % (90 (sem 41) pmol/l, P=0·043) after ingestion of breakfast and lunch, respectively.
Compared with the CD diet, the CRHP diet reduced total insulin AUC by 22 % (34 (sem 8·0) nmol/l×min, P<0·001) and net insulin AUC by 33 % (35 (sem 6·7) nmol/l×min, P<0·0001).
C-peptide
A time×treatment interaction was found in the repeated measures of C-peptide. On the CD diet, serum C-peptide reached peak concentrations 120 min after ingestion of breakfast and lunch, respectively, compared with 90 min after ingestion of the CRHP diet breakfast and lunch (Fig. 2(a)). Compared with the CD diet, the CRHP diet reduced peak serum C-peptide concentration by 24 % (713 (sem 146) pmol/l, P<0·001) and 23 % (686 (sem 179) pmol/l, P=0·002) after ingestion of breakfast and lunch, respectively.
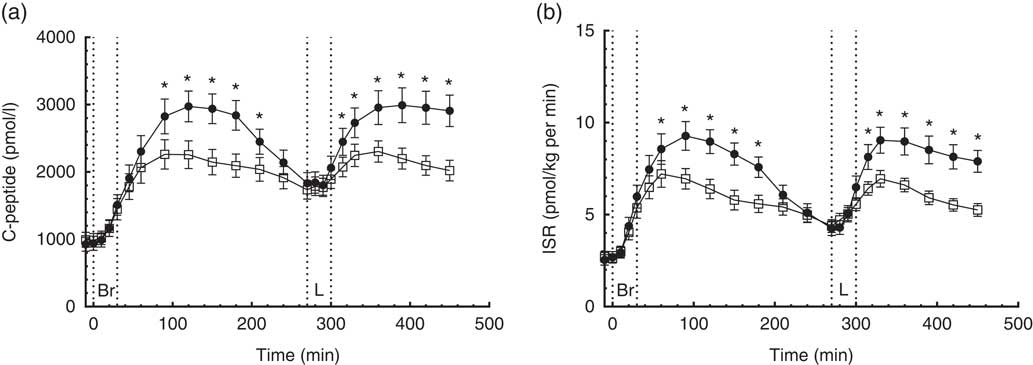
Fig. 2 7·5-h concentrations of C-peptide (a) and insulin secretion rate (ISR) (b) in sixteen subjects with type 2 diabetes mellitus after intake of a carbohydrate-reduced high-protein (CRHP, ![]() ) or conventional diabetes (CD,
) or conventional diabetes (CD, ![]() ) breakfast and lunch, respectively (mean of 2 consecutive days on each diet). Values are means with their standard errors. * Significant difference (P<0·05) between CD and CRHP diets.
) breakfast and lunch, respectively (mean of 2 consecutive days on each diet). Values are means with their standard errors. * Significant difference (P<0·05) between CD and CRHP diets.
Compared with the CD diet, the CRHP diet reduced total C-peptide AUC by 19 % (215 (sem 34) nmol/l×min, P<0·0001) and net C-peptide AUC by 34 % (240 (sem 28) nmol/l×min, P<0·0001).
Insulin secretion rate and β-cell glucose sensitivity
A time×treatment interaction was found in the repeated measures of ISR in accordance with the findings of C-peptide concentrations. Peak ISR on the CD diet were reached 90 min after ingestion of breakfast and 60 min after lunch compared with 60 min after ingestion of the CRHP diet breakfast and lunch (Fig. 2(b)). Compared with the CD diet, the CRHP diet reduced peak ISR by 23 % (2·3 (sem 0·5) pmol/kg per min, P<0·001) and 26 % (2·6 (sem 0·6) pmol/kg per min, P<0·001) after ingestion of breakfast and lunch, respectively.
Compared with the CD diet, the CRHP diet reduced total ISR AUC by 21 % (706 (sem 112) pmol/kg, P<0·0001) and net ISR AUC by 35 % (733 (sem 90) pmol/kg, P<0·0001).
Initial β-GS was significantly increased after CRHP compared with CD breakfast (2·9 (IQR 1·8–5·8) v. 1·8 (IQR 1·5–2·4) pmol/kg per min per mm, P=0·005) and lunch (2·5 (IQR 1·5–4·9) v. 1·7 (IQR 1·3–2·6) pmol/kg per min per mm, P=0·013), respectively.
Gut hormones and glucagon
Total glucagon-like peptide-1
A time×treatment interaction, but no overall difference between diets, was found in the repeated measures of GLP-1. At individual times of measurement, a 25 % lower (P=0·007) and a 35 % higher (P<0·0001) concentration of GLP-1 was found at 30 and 120 min, respectively, when comparing the CRHP diet with the CD diet (Fig. 3(a)). There was no significant difference in GLP-1 total or net AUC between the two diets.
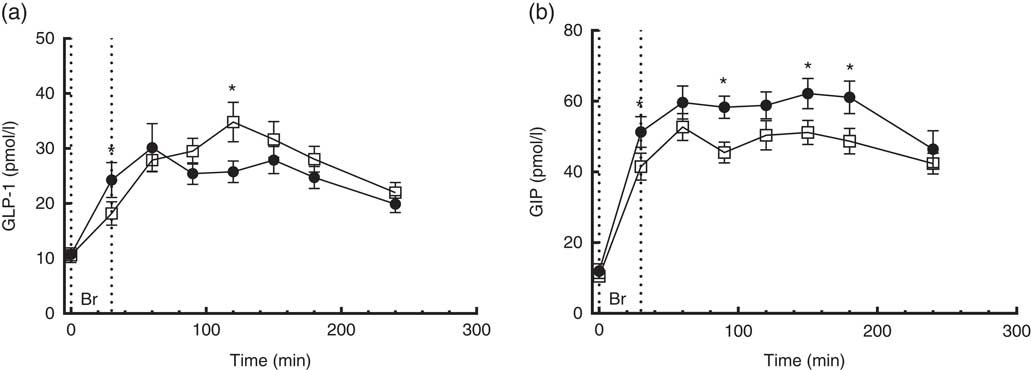
Fig. 3 4·5-h concentrations of glucagon-like peptide-1 (GLP-1) (a) and gastric inhibitory polypeptide (GIP) (b) in sixteen subjects with type 2 diabetes mellitus after intake of a carbohydrate-reduced high-protein (CRHP, ![]() ) or conventional diabetes (CD,
) or conventional diabetes (CD, ![]() ) breakfast (mean of 2 consecutive days on each diet). Values are means with their standard errors. * Significant difference (P<0·05) between CD and CRHP diets.
) breakfast (mean of 2 consecutive days on each diet). Values are means with their standard errors. * Significant difference (P<0·05) between CD and CRHP diets.
Total glucose-dependent insulinotropic polypeptide
No time×treatment interaction was found in the repeated measures of GIP. At individual times of measurement, GIP concentrations were significantly lower after intake of the CRHP compared with the CD breakfast at all time points except for the 60-, 120- and 240-min marks where only a tendency was found (Fig. 3(b)).
Compared with the CD diet, the CRHP diet reduced total GIP AUC by 17 % (2·2 (sem 0·3) nmol/l×min, P<0·0001) and net GIP AUC by 18 % (1·8 (sem 0·4) nmol/l×min, P<0·001). No correlation was found between GIP and insulin secretion.
Glucagon
A time×treatment interaction was found in the repeated measures of glucagon. Glucagon concentrations were 27 to 76 % higher 60 min post intake of the CRHP compared with the CD breakfast (P<0·0001) (Fig. 4(a)). Glucagon excursions were not correlated with glucose excursions.
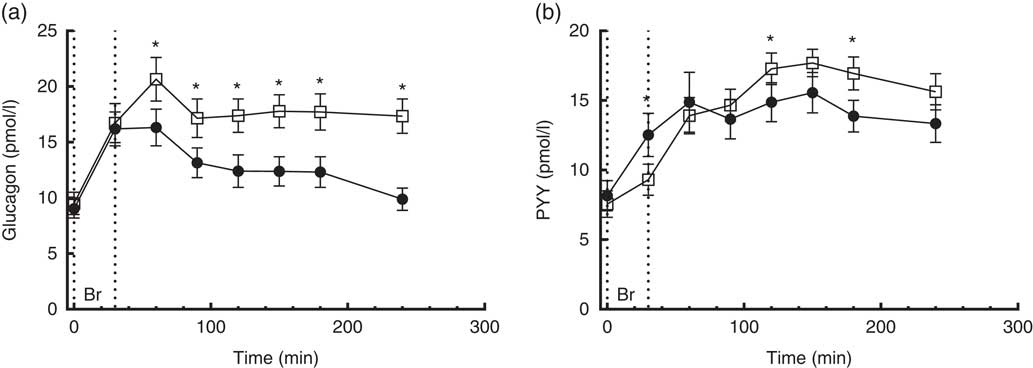
Fig. 4 4·5-h concentrations of glucagon (a) and polypeptide YY (PYY) (b) in sixteen subjects with type 2 diabetes mellitus after intake of a carbohydrate-reduced high-protein (CRHP, ![]() ) or conventional diabetes (CD,
) or conventional diabetes (CD, ![]() ) breakfast (mean of 2 consecutive days on each diet). Values are means with their standard errors. * Significant difference (P<0·05) between CD and CRHP diets.
) breakfast (mean of 2 consecutive days on each diet). Values are means with their standard errors. * Significant difference (P<0·05) between CD and CRHP diets.
Compared with the CD diet, the CRHP diet increased total glucagon AUC by 33 % (1·0 (sem 0·1) nmol/l×min, P<0·0001) and net glucagon AUC by 100 % (0·9 (sem 0·1) nmol/l×min, P=0·001).
Peptide YY
A time×treatment interaction, but no overall difference between diets, was found in the repeated measures of PYY. At individual times of measurement, a 26 % lower (P=0·002), 16 % higher (P=0·042) and 22 % higher (P=0·004) concentration of PYY was found at 30, 120 and 180 min, respectively, when comparing the CRHP diet with the CD diet (Fig. 4(b)). There was no significant difference in PYY total or net AUC between the two diets.
Cholecystokinin
No time×treatment interaction was found in the repeated measures of CCK. Compared with the CD diet, the CRHP diet increased CCK AUC by 24 % (180 (sem 53) pmol/l×min, P<0·004) and net CCK AUC by 25 % (128 (sem 48) pmol/l×min, P=0·018) (Fig. 5(a)).
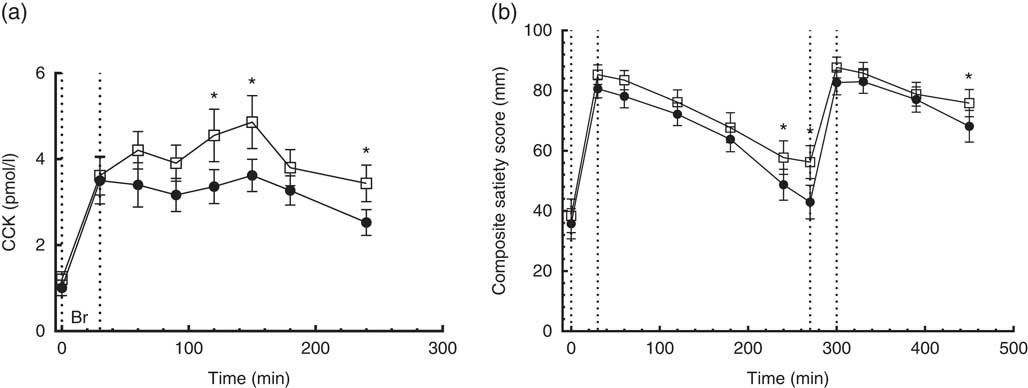
Fig. 5 4·5-h concentrations of cholecystokinin (CCK) (a) in sixteen subjects with type 2 diabetes mellitus after intake of a carbohydrate-reduced high-protein (CRHP, ![]() ) or conventional diabetes (CD,
) or conventional diabetes (CD, ![]() ) breakfast and 7·5-h composite satiety score on a 100-mm visual analogue scale scale (b) after intake of a CRHP or CD breakfast and lunch, respectively (mean of 2 consecutive days on each diet). Values are means with their standard errors. * Significant difference (P<0·05) between CD and CRHP diets.
) breakfast and 7·5-h composite satiety score on a 100-mm visual analogue scale scale (b) after intake of a CRHP or CD breakfast and lunch, respectively (mean of 2 consecutive days on each diet). Values are means with their standard errors. * Significant difference (P<0·05) between CD and CRHP diets.
Visual analogue scales
Satiety
No time×treatment interaction was found in the repeated measures of CSS on a 100-mm VAS. At 240 and 270 min post breakfast and 180 min post lunch, CSS was significantly higher (P<0·05) after intake of the CRHP compared with the CD diet at these individual times of measurement (Fig. 5(b)).
Compared with the CD diet, the CRHP diet increased CSS AUC by 7 % (2·3 (sem 1·0) m×min, P=0·035).
CSS AUC at breakfast was best correlated with PYY AUC (Pearson’s r 0·53, P=0·002), to a lesser degree with GIP AUC (Pearson’s r 0·38, P=0·034) and borderline with GLP-1 AUC (Pearson’s r 0·35, P=0·052). Furthermore, PYY AUC was strongly correlated with GLP-1 AUC (Pearson’s r 0·58, P=0·001).
Palatability
No differences in general palatability scores on a 100-mm VAS between diets or between meals were found. Mean palatability of the four different meals ranged from 70 (sem 5·7) to 77 (sem 4·6).
Discussion
The present study showed that reducing dietary carbohydrate energy content from 55 to 30 %, while iso-energetically increasing fat and protein contents, significantly reduced postprandial glucose excursion. Insulin secretion was also reduced. It also showed a tendency to reduce incretin hormone concentrations in the first 30–60 min after the CRHP breakfast, as well as increasing satiety measured by VAS and the satiety hormone CCK. These findings show that even without decreasing total energy intake the reduced carbohydrate intake exerts a marked beneficial effect on glucose control. This effect could possibly be minutely enhanced by higher Ca content and attenuated by lower fibre content in the CRHP diet compared with the CD diet, respectively( Reference Gonzalez and Stevenson 28 , Reference Chandalia, Garg and Lutjohann 29 ). Moreover, the increased satiety scores in concert with stimulations of the satiety hormones GLP-1 and PYY makes it likely that further achievements in relation to weight loss can be made during ad libitum intakes of the diet.
Hyperglycaemia and/or hyperinsulinaemia have been associated with insulin resistance and loss of pancreatic β-cell function( Reference Koopmans, Ohman and Haywood 30 – Reference Del Prato, Leonetti and Simonson 34 ). Reducing the glucose excursions may reduce HbA1c and prevent the progression of T2DM and late diabetic complications( Reference Guillausseau, Meas and Virally 35 ).
As hyperinsulinaemia may induce insulin resistance( Reference Del Prato, Leonetti and Simonson 34 ), the data from the present study were encouraging as a highly significant reduction in insulin secretion was found. It has previously been shown that a postprandial reduction in insulin can be preserved over time during a 6-week transition to a reduced carbohydrate diet( Reference Gannon and Nuttall 9 ). Furthermore, β-GS was improved on the CRHP diet. As preserved β-GS was related to remission of T2DM in a recent weight loss trial( Reference Steven, Hollingsworth and Al-Mrabeh 36 ), it was reassuring that β-GS was not attenuated by the CRHP diet. Notably, the improved β-GS is not explained by the incretin hormones as the secretion of GLP-1 and GIP did not differ or was reduced on the CRHP diet, but may partly be explained by the higher protein content of the CRHP and glucagon response( Reference Frid, Nilsson and Holst 37 ) and partly by the contribution of MUFA by olive oil in the CRHP diet.( Reference Lopez, Bermudez and Pacheco 38 )
In previous studies on incretins in subjects with T2DM, an impairment of incretin effect( Reference Madsbad 12 ) and in some cases incretin responses( Reference Holst, Knop and Vilsboll 39 ) were found. Although a dose–response relationship between protein load and GLP-1 response in healthy individuals has been shown( Reference Belza, Ritz and Sorensen 18 , Reference Lejeune, Westerterp and Adam 40 ), this relationship was not reproduced in the present study. The present study may suggest that protein-induced GLP-1 response is impaired in subjects with well-controlled T2DM. The GIP secretion induced by the carbohydrate load was as expected in the present study as the CD diet elicited a greater GIP response compared with the CRHP diet in agreement with previous studies in subjects with T2DM( Reference Park, Heden and Liu 41 ) and healthy individuals( Reference Belza, Ritz and Sorensen 18 ). Release of CCK has been found to be stimulated largely by dietary fat intake and to some extent protein intake, in agreement with the present findings( Reference Gibbons, Finlayson and Caudwell 42 ). In healthy subjects with normal glucose tolerance, supraphysiological levels of CCK by exogenous administration have been shown to correlate well with subjective satiety measures and prospective food intake, but endogenous physiological levels do not exhibit the same correlation( Reference Gibbons, Finlayson and Caudwell 42 , Reference Nolan, Guss and Liddle 43 ). In this study, we found a higher CCK response to a CRHP diet compared with a CD diet, supporting the observation that subjective satiety scores were also increased in T2DM patients during the ingestion of a CRHP diet compared with a CD diet. A dose–response relationship between intake of protein and glucagon excursions has previously been established in healthy subjects( Reference Belza, Ritz and Sorensen 18 ). The current findings confirm that this relationship also exists in subjects with well-controlled T2DM. Glucagon levels, however, were not correlated with glucose excursions in the present study. Reassuringly, although the CRHP diet resulted in significantly increased glucagon responses, this did not lead to an amplified glucose response; indeed, the opposite was observed. This could be due to a reduction in the direct inhibitory effect of insulin secretion on the α-cells( Reference Maruyama, Hisatomi and Orci 44 ) as the CD diet elicited a higher insulin response compared with the CRHP diet.
Postprandial satiety is conveyed by a complex interplay of gut hormones and neural modulators within the gut–brain axis, in which PYY has been shown to be play an important role as a potent anorexigenic hormone( Reference Delzenne, Blundell and Brouns 45 ). Low-carbohydrate diets either high in protein or fat increase postprandial PYY secretion in healthy and obese subjects( Reference Belza, Ritz and Sorensen 18 , Reference Essah, Levy and Sistrun 46 ). In addition, in this study there were increased late PYY responses to the CRHP diet although the early responses were slightly lower. This could partly be explained by a reduced gastric emptying in response to protein and fat compared with carbohydrates. We also found a strong correlation between subjective satiety scoring and the PYY levels, which supports our hypothesis that the CRHP diet may contribute to longer-term satiety. This important relationship should be the object of future investigations, as PYY together with CCK and ghrelin have been linked to prospective food intake( Reference Belza, Ritz and Sorensen 18 ).
In conclusion, a shift in macronutrient composition, which moderately reduced carbohydrate and increased fat and protein in the diet, markedly reduced glucose excursions in the face of a reduced insulin response and an increased glucagon response in patients with well-controlled T2DM. Satiety scoring by the patient in this setting was reflected in the postprandial secretion of the satiety hormones PYY and CCK. These results encourage the non-pharmacological approach to treat postprandial hyperglycaemia in T2DM. Studies are needed to evaluate these effects in subjects with more advanced glucose impairment, long-term effects and to further elucidate the physiological drivers of these effects.
Acknowledgements
This study was made possible with the support of the participants and the help of the kitchen staff at Copenhagen University Hospital Bispebjerg.
The study was made possible by a grant from the Danish Dairy Research Foundation. The Danish Dairy Research Foundation had no role in the design, analysis or writing of this article.
The authors’ responsibilities were as follows: A. S., M. J. S., S. K., A. A., C. F. D., J. J. H., S. M., S. B. H. and T. K. designed the research; A. S., M. J. S., D. K., C. F. D., J. J. H. and J. F. R. conducted the research; A. S. and M. J. S. analysed the data and wrote the manuscript; D. K., A. A., C. F. D., J. J. H., S. M., J. F. R., S. B. H. and T. K. coedited the manuscript; A. S. had primary responsibility for final content of the manuscript; and all authors read and approved the final manuscript.
The authors declare that there are no conflicts of interest.


