


There is general agreement that the current obesity epidemic and diet-related non-communicable diseases (NCD) are largely associated with an environment that promotes excessive food intake and discourages physical activity in multiple ways( Reference Malik, Willett and Hu 1 , Reference Ng, Fleming and Robinson 2 ). Globally, the consumption of healthy foods has increased modestly during the past two decades. In contrast, the intake of unhealthy foods has increased to a greater extent( Reference Imamura, Micha and Khatibzadeh 3 ). Although environmental factors have an important role in the development of obesity, genetic factors also make a significant contribution in determining an individual’s susceptibility to obesity( Reference Herrera and Lindgren 4 ) through a full series of potential mechanisms governing pathways and regulatory systems at different levels, including intake and energy expenditure( Reference Doo and Kim 5 ).
Studies of candidate genes for obesity susceptibility have allowed the identification of important genes and SNP involved in the mechanisms of dietary consumption, such as energy intake, food preferences and satiety responsiveness( Reference Tanaka 6 – Reference Mariman, Bouwman and Aller 8 ). The rs9939609 SNP of the fat mass and obesity-associated (FTO) gene, along with the rs7799039 SNP of the leptin (LEP) gene and the rs1137101 SNP of the leptin receptor (LEPR) gene, has been associated with total energy intake( Reference Sonestedt, Roos and Gullberg 9 , Reference Boumaiza, Omezzine and Rejeb 10 ). Further, the rs17782313 SNP of the melanocortin-4 receptor (MC4R) gene has been associated with food intake and eating behaviour patterns( Reference Stutzmann, Cauchi and Durand 11 , Reference Cecil, Dalton and Finlayson 12 ).
Whereas total energy intake is a vital aspect of food intake, the macronutrient composition of food or dietary patterns may be equally important as factors underlying the development of obesity( Reference Bauer, Elbers and Adan 13 ). Consumption of ultra-processed foods has become a common practice worldwide( 14 , Reference Martínez Steele, Popkin and Swinburn 15 ). Ultra-processed foods are defined as industrial formulations, typically with five or more ingredients that, besides salt, sugar, oils and fats, include additives that are used to give the products desirable sensory properties( 16 , Reference Monteiro, Cannon and Levy 17 ). This type of food is associated with less healthy diets and strongly implicated in over-consumption, weight gain, obesity and chronic health problems( 14 ).
Nutritional demands increase during pregnancy owing to the metabolic and physiological changes( Reference Plećaš, Plešinac and Kontić-Vučinić 18 ), but the polymorphism may also be associated with dietary preferences over time affecting food intake and, consequently, weight gain. Maternal obesity and excessive gestational weight gain are major risk factors for gestational diabetes, pre-eclampsia and fetal adiposity( Reference Ovesen, Rasmussen and Kesmodel 19 , Reference Marchi, Berg and Dencker 20 ). Consequently, obesity in pregnancy is placing a considerable burden on healthcare services and resources( Reference Morgan, Rahman and Macey 21 ). To the best of our knowledge, there are no studies in the literature that have evaluated the association between these SNP (FTO, MC4R, LEP and LEPR) and dietary intake during pregnancy.
Given the potential importance of weight management interventions in pregnancy and owing to the association between dietary intake and weight gain and regulation, this study may help shed light on this important topic and provide insights to guide the advances of maternal nutrition during pregnancy. In this way, the aims of this study were: (1) to investigate whether obesity candidate gene (FTO-rs9939609; MC4R-rs17782313; LEP-rs7799039 and LEPR-rs1137101) polymorphisms are associated with daily total energy intake and percentage of energy from macronutrients and ultra-processed foods in both time points (pre-pregnancy and pregnancy), and (2) to test whether these genes are associated with dietary intake changes from pre-pregnancy to pregnancy. We hypothesised that variation in FTO, MC4R, LEP and LEPR gene SNP may be associated with an increased total energy intake, as well as increased energy from carbohydrates, fats and ultra-processed foods, and with decreased energy from proteins before and during pregnancy.
Methods
Study design and subjects
This study comprised a prospective cohort of pregnant women attending a prenatal care service offered by a public health centre in Rio de Janeiro, Brazil. The enrolment of women occurred from November 2009 to October 2011, and the follow-up lasted until July 2012. The Rio de Janeiro Municipal Health Secretary Research Ethics Committee approved the study procedures (reference no. 0139.0.314.000–09). All participants signed a term of consent freely and spontaneously, detailing all procedures to be carried out, according to Brazilian Resolution 466/2012.
Women who met the following eligibility criteria were invited to participate in the study: had <13 weeks of gestation at baseline, were 20–40 years of age, had no history of infectious diseases or NCD (except obesity) and intended to attend prenatal care in the selected health centre. The follow-up times occurred between 5 and 13 (baseline), 20 and 26 and 30 and 36 gestational weeks (GW).
A total of 322 pregnant women were invited, and 299 (92·7 %) agreed to participate in the study. After recruitment, seventy-nine women were excluded. After exclusions, the baseline total sample comprised 220 pregnant women. From the baseline to the third visit (30–36 GW), nine follow-up losses occurred. Furthermore, we excluded women who did not have blood samples for genotyping (n 62). The final sample of this study was composed of 149 women with genotyping (FTO, n 146; MC4R, n 145; LEP, n 147 and LEPR, n 147) (Fig. 1).
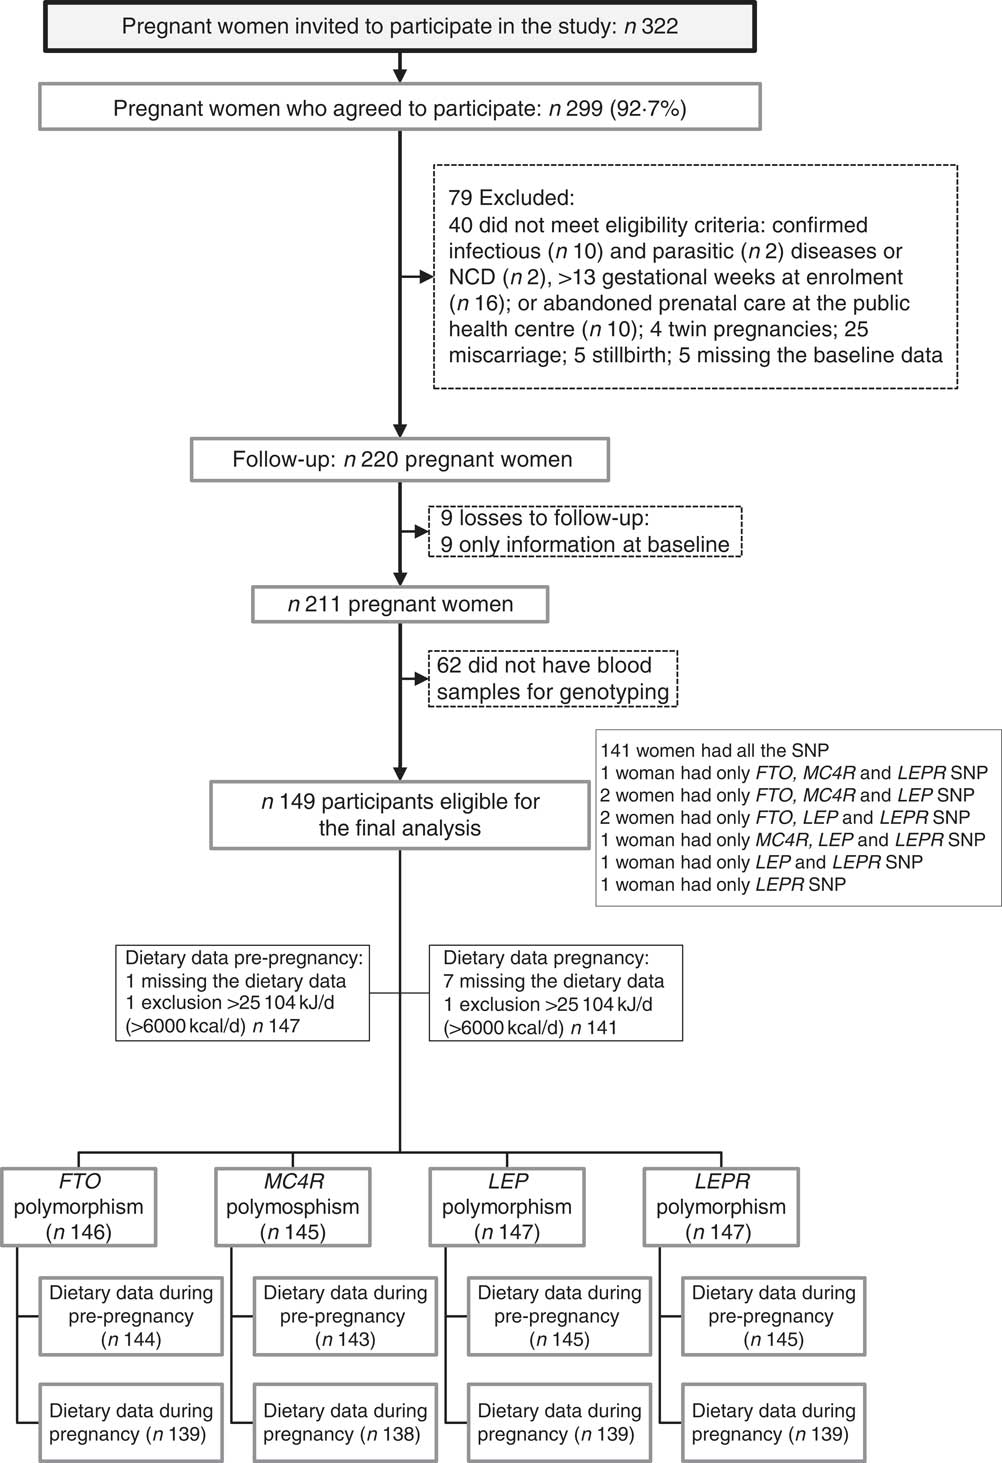
Fig. 1 Flow chart illustrating the recruitment and selection of the study sample. NCD, non-communicable diseases; FTO, fat mass and obesity-associated gene; MC4R, melanocortin-4 receptor gene; LEP, leptin; LEPR, leptin receptor.
Dietary intake assessments
The dietary intake was evaluated using a semi-quantitative FFQ based on a version originally developed and validated for the adult population of Rio de Janeiro( Reference Sichieri and Everhart 22 ). The participants were asked to report the frequency of consumption of the food items contained in the FFQ over the 6 months before the interview. The dietary intake data collected at 5–13 GW covered the pre-pregnancy period and the data collected at 30–36 GW refer to dietary intake of women during pregnancy. To capture any other relevant food, we included a question at the end of the FFQ: ‘Do you regularly eat other foods that have not been asked?’ Very few women reported eating other food items not included on the FFQ, and this information was not included in the analysis. The FFQ was composed of eighty-two food items with eight frequency options that were transformed into daily frequency, as follows: >3 times/d=4, 2–3 times/d=2·5, 1 time/d=1, 5–6 times/week=0·79, 2–4 times/week=0·43, 1 time/week=0·14, 1–3 times/month=0·07 and never or hardly ever=0. Portion sizes were converted into grams or millilitres, based on the Brazilian household measures table( Reference Pinheiro, Lacerda, de and Benzecry 23 ). The daily nutrient amount for a given food was calculated by multiplying the usual portion size per daily frequency and its nutrient content based on data from the Brazilian Table of Food Composition( 24 ), and we added food items from the US Department of Agriculture National Nutrient Database for Standard( 25 ).
Macronutrients and alcohol consumptions (g/d) were calculated by summing the data for the respective macronutrient/alcohol across all food items. These values were then converted into energy by multiplying the total grams of the macronutrient/alcohol by the number of energy content per gram.
Ultra-processed foods were classified in accordance with the official Brazilian national food and nutrition guideline( 16 ) and with the new food classification system (NOVA)( Reference Monteiro, Cannon and Levy 17 ), which considers the extent and the purpose of industrial food processing. Ultra-processed foods were represented as follows: breads; cakes, cookies/crackers or stuffed cookies and sweet or savoury packaged snacks; dairy products (cheese and yogurt); margarine and mayonnaise; pasta and noodles; processed meats (burgers, sausages/frankfurters, cold cuts: bologna, ham, salami); candies (ice cream, candies/caramels, chocolate powder, chocolate bars/bonbons, sweet dairy); French fries, chips or shoestring potatoes, fried/baked salted pastries and pizza dishes; and soft drinks and alcoholic beverages (vodka).
DNA isolation and SNP genotyping
Non-fasting venous blood samples (5 ml) were collected at the baseline, processed and stored at −80°C until polymorphism analyses. DNA was isolated from whole blood samples by the proteinase K and phenol–chloroform technique. Genotyping was performed using real-time PCR amplification method (StepOnePlus; Life Technologies) with an allelic discrimination assay (TaqMan® Genotyping Master Mix assay; Life Technologies). The accuracy of genotyping was evaluated by performing a duplicate analysis of 10 % of the sample with ≥99 % agreement rates.
Covariate assessment
A standardised questionnaire was administered at baseline (5–13 GW) to obtain the following maternal variables: age (years), education (years of schooling), per-capita family income (Real-R$), leisure-time physical activity practice before pregnancy (yes/no), smoking habits (non-smoking, former smoker and current smoker), alcohol consumption (no/yes), parity (number of deliveries) and self-reported skin colour (white/black/mixed).
Pre-pregnancy BMI was calculated using the self-reported pre-pregnancy weight at baseline and height was measured with a portable stadiometer (Seca Ltd) until 13 weeks of gestation according to standardised procedures( Reference Lohman, Roche and Martorell 26 ).
The gestational age was estimated based on the first ultrasound performed before 24 weeks of gestation( Reference Butt, Lim and Bly 27 ); however, the reported date of the last menstrual period was used if the ultrasound data were not available (n 2).
Statistical analyses
The maternal characteristics were described as a numbers and percentages or medians and interquartile ranges (IQR, 25th–75th percentiles) and mean values and 95 % CI. The normality of distributions was tested using the Shapiro–Wilk test. Data that were not normally distributed (energy intake and percentage of energy from protein) were transformed to the natural logarithmic (ln) scale (ln (x)=log e (x)). After log-transformation, the QQ plots and Shapiro–Wilk test did not provide evidence that the data did not follow a normal distribution. Log-transformed values were used before data analysis, but estimates provided in the results section were back-transformed using the inverse of the logarithmic function (e ln(x)=x), and data are presented as geometric means and 95 % CI. Comparisons between genotypes and outcomes were performed using Student’s t test. Because the number of minor allele homozygotes for all SNP was small in our sample, only the dominant genetic model was tested instead of the additive and recessive genetic models.
Adjusted linear regression models were performed to assess cross‐sectional associations between SNP and the outcomes. Characteristics related to the mother and (log) total energy intake with P<0·20 in univariate analysis were included in the adjusted models. The following variables reached this condition and were included in the adjusted models: maternal age, self-reported skin colour, parity, gestational age and per-capita income. Analyses of the percentage of energy from macronutrients and ultra-processed foods were also adjusted for total energy intake. The results for log-transformed variables (total energy intake and percentage of energy from protein) were presented in % change with 95 % CI to make interpretation more straightforward. The assumption of normal distribution of the residuals was examined using QQ plots.
ANCOVA models were fitted to explore the associations between SNP and dietary intake changes during pregnancy. In these analyses, the dietary intake value during pregnancy was entered as the dependent variable. We contrasted two groups under the dominant genetic model. Group 1 comprised homozygotes for the minor allele and heterozygotes carrying the same allele. This latter group was then contrasted to the wild-type group (homozygote major allele). The variable coded according to the previous definition was entered as an explanatory factor in the ANCOVA model. Its effect was adjusted for the remaining covariates, such as maternal age at baseline, self-reported skin colour, parity, gestational age at baseline and respective dietary intake value at baseline (pre-pregnancy). Correlations between outcomes during pregnancy and possible covariates were analysed using Pearson’s correlation test. The assumption that covariates were independent of genotypes was tested using Student’s t test. Homogeneity of genotypic effects according to pre-pregnancy dietary intake was tested using an interaction term between the genotype groups and pre-pregnancy dietary intake in the corresponding ANCOVA model. When there was no interaction, a full factorial model was chosen. The model fit was assessed graphically using residual plots. The results are presented as adjusted means and 95 % CI.
We estimated the needed sample size for the following Cohen’s effects sizes: small (0·2), medium (0·5) and large (0·8), based on a power of 80 % and a CI level of 5 % (considering t tests of means). The effect size was considered as the standardised difference between the two groups of risk allele carriers and non-risk allele homozygotes in pre-pregnancy measurements. The mean differences between the groups of the A-carriers and G homozygote of the polymorphism LEP-rs7799039 would be 678 kJ/d (162 kcal/d) (small effect), 1694·5 kJ/d (405 kcal/d) (medium effect) and 2707 kJ/d (647 kcal/d) (large effect) for pre-pregnancy total energy (kJ/d) (kcal/d). It resulted in total sample sizes of 794 (small effect), 130 (medium effect) and 52 (large effect) pregnant women (taking into account a group ratio of 1:2 as in polymorphism LEP-rs7799039). These analyses were developed using the ‘pwr’ package of the R-project statistical software (version 1.0.143)( 28 ) and G*Power software (version 3.1.9.2)( Reference Faul, Erdfelder and Buchner 29 ). We calculated the power implied by our sample size when comparing each outcome and polymorphism. Power calculations were performed using the ‘GeneticsDesign’ package of R-project statistical software (version 1.0.143)( 28 ) under the dominant model – that is, contrasting the homozygote minor allele+heterozygotes carriers to the wild-type group (homozygote major allele). Our choice of the remaining input parameters in this function preserved the same logic. More specifically, options ‘delta’ (difference in means of dietary intake at baseline relative to the two groups being compared) and ‘freq’ (allele frequency of ‘disease’ allele in our sample) reflect the same coding of the main analysis. In this exercise, α was set to 0·05 and the standard deviations estimated from the target outcome at baseline (online Supplementary Table S4).
All of the statistical analyses were conducted using STATA (version 12.0; StataCorp) software, and the significance level was defined as 5 %. Corrections for multiple testing were not performed because they may not be necessarily required in exploratory studies, such as the present one. Considering that the likelihood of type II errors is increased by corrections for multiple testing, such as Bonferroni adjustments, and considering that truly important differences may not be deemed significant( Reference Perneger 30 ), such adjustments were not performed in the present study.
Results
Characteristics of the study sample
The average age of the 149 women was 27 years old (IQR=22–31), and they had completed 9·0 (IQR=7–11) years of education. The frequency of women with a pre-pregnancy BMI ≥25 kg/m2 was 34·9 % (Table 1). The difference in total energy intake (geometric mean) before and during pregnancy was not significant (P=0·86) (data not shown).
Table 1 Maternal characteristics at the baseline and pre-pregnancy and pregnancy dietary intake (Medians and interquartile ranges (IQR); numbers and percentages; geometric means and 95 % confidence intervals)
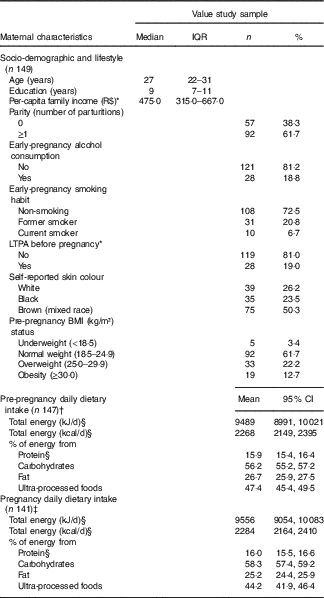
R$, real; LTPA, leisure-time physical activity.
* Variables with missing information: three missing values for per-capita family income and two missing values for LTPA.
† One missing value for FFQ and one exclusion because implausible total energy intake (>25 104 kJ/d (>6000 kcal/d)).
‡ Seven missing values for FFQ and one exclusion because implausible total energy intake ((>25 104 kJ/d (>6000 kcal/d)).
§ Natural logarithms values were used for variables without normal distribution, but estimates provided in the table were back-transformed.
Genotype frequencies
The minor allele frequencies of FTO-rs9939609, MC4R-rs17782313, LEP-rs7799039 and LEPR-rs1137101 were 42·0 % (A-allele), 19·0 % (C-allele), 31·0 % (A-allele) and 50·0 % (G-allele), respectively. The genotype distributions were in accordance with the Hardy–Weinberg equilibrium (P>0·05) (online Supplementary Table S1).
Daily total energy intake
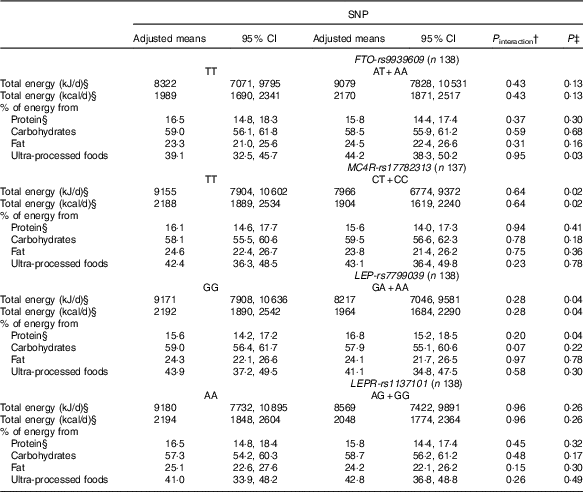
Carriers of the A-allele of FTO-rs9939609 gene presented a higher geometric mean of total energy intake compared with non-carriers during pregnancy (online Supplementary Table S2). These results were confirmed, even after adjustments in the multiple linear regression model (Table 2). Women without the risk allele of FTO-rs9939609 presented negative and significant differences in the total energy intake between pregnancy and pre-pregnancy, but not women with the risk allele (online Supplementary Table S3). These results were not confirmed in the ANCOVA results (Table 3).
Table 2 Linear regression models between gene polymorphisms and pre-pregnancy and pregnancy daily dietary intake and differences between values during pregnancy and pre-pregnancy, according to dominant inheritance models (Percentage change, linear regression coefficients (β) and 95 % confidence intervals)
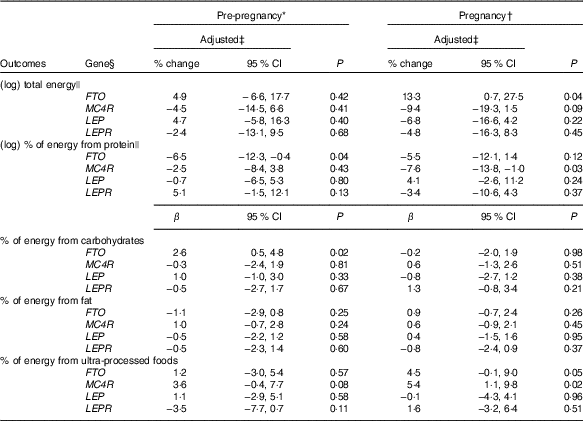
FTO, fat mass and obesity-associated gene; MC4R, melanocortin-4 receptor gene; LEP, leptin; LEPR, leptin receptor.
* Total number of observations pre-pregnancy: FTO-rs9939609, n 141; MC4R-rs17782313, n 140; LEP-rs7799039, n 142 and LEPR-rs1137101, n 142.
† Total number of observations pregnancy: FTO-rs9939609, n 137; MC4R-rs17782313, n 136; LEP-rs7799039, n 137 and LEPR-rs1137101, n 137.
‡ All analyses were adjusted for maternal age, self-reported skin colour, parity, gestational age (week) and per-capita income; analyses of percentage of energy from macronutrients and ultra-processed foods were also adjusted for total energy intake.
§ Dominant genetic model for all genes (FTO=AT+AA v. TT; MC4R=CT+CC v. TT; LEP=GA+AA v. GG; LEPR=AG+GG v. AA).
|| Natural logarithms values were used in pre-pregnancy and pregnancy, and results were presented in % change and 95 % CI to make interpretation more straightforward.
Table 3 Changes in dietary intake from pre-pregnancy to pregnancy, according to FTO-rs9939609, MC4R-rs17782313, LEP-rs7799039 and LEPR-rs1137101 polymorphismsFootnote * (Mean values and 95 % confidence intervals)
FTO, fat mass and obesity-associated gene; MC4R, melanocortin-4 receptor gene; LEP, leptin; LEPR, leptin receptor.
* All analyses were adjusted for pre-pregnancy dietary intake (continuous variables), maternal age, self-reported skin colour, parity and gestational age (week) at baseline.
† P value for interaction SNP×pre-pregnancy dietary intake.
‡ P value obtained from ANCOVA for the effect of FTO, MC4R, LEP and LEPR polymorphisms on the change of each variable.
§ Natural logarithms values were used for analyses, but estimates provided in the table were back-transformed to make interpretation more straightforward.
We observed that women with risk allele carriers of the MC4R-rs17782313 and of the LEP-rs7799039 genes presented lower adjusted mean of total energy intake changes from pre-pregnancy to pregnancy when compared with those without the risk alleles (Table 3).
Percentage of energy from protein
The A-allele of the FTO-rs9939609 and the C-allele of the MC4R-rs17782313 genes were associated with a decrease in the percentage of energy from protein before pregnancy and during pregnancy, respectively, in the multiple linear regression model (Table 2). This association was not significant for MC4R-rs17782313 based on the ANCOVA results (P=0·41) (Table 3).
Women who carried the A-allele of LEP-rs7799039 tended to present a higher geometric mean of the percentage of energy from protein during pregnancy (P=0·05) (online Supplementary Table S2) and presented a positive difference between pregnancy and pre-pregnancy (online Supplementary Table S3). The ANCOVA also indicated a significant change for percentage of energy from protein from pre-pregnancy to pregnancy, with A-allele carriers presenting a higher adjusted mean when compared with those homozygous for the G-allele (P=0·04) (Table 3).
Percentage of energy from carbohydrates
Women with the A-allele of the FTO-rs9939609 gene presented a higher mean of the percentage of energy from carbohydrates before pregnancy compared with the TT genotype (online Supplementary Table S2). These results were confirmed even after adjustment for confounders in the multiple linear regression (Table 2).
Non-carriers of risk alleles of the FTO-rs9939609 and LEP-rs7799039 genes and carriers of risk alleles of the LEPR-rs1137101 and MC4R-rs17782313 genes presented positive and significant differences in the percentage of energy from carbohydrates between pregnancy and pre-pregnancy (online Supplementary Table S3). These differences were not significant in the multiple linear regression models (Table 2), nor in the ANCOVA (Table 3).
Percentage of energy from fat
The percentage of energy from fat from pre-pregnancy to pregnancy reduced in the non-carriers of the risk alleles of the FTO-rs9939609 and LEP-rs7799039 genes and in the carriers of the risk alleles of MC4R-rs17782313 and LEPR-rs1137101 genes (online Supplementary Table S3). These results were not significant in the multiple linear regression model (Table 2), nor in the ANCOVA (Table 3).
Percentage of energy from ultra-processed foods
Women who carried the A-allele of the FTO-rs9939609 gene presented a higher percentage of energy from ultra-processed foods during pregnancy when compared with those without the risk alleles (online Supplementary Table S2). These results presented borderline significance (P=0·05) after adjustment for confounders in the multiple linear regression model (Table 2). The ANCOVA indicated a significant change for percentage of energy from ultra-processed foods from pre-pregnancy to pregnancy, with A-allele carriers presenting a higher adjusted mean when compared with those homozygous for the T-allele (P=0·03), after adjusting for the covariate effect (energy from ultra-processed at pre-pregnancy) (Table 3).
The C-allele of MC4R-rs17782313 was positively associated with the percentage of energy from ultra-processed foods during pregnancy compared with the TT genotype (Table 2). This association was not significant based on the ANCOVA results (P=0·78) (Table 3).
The percentage of energy from ultra-processed foods from pre-pregnancy to pregnancy reduced in the non-carriers of the risk alleles of the LEPR-rs1137101 gene and in the carriers of the risk alleles of MC4R-rs17782313 and of the LEP-rs7799039 genes (online Supplementary Table S3). These results were not significant in the ANCOVA adjusted for potential confounders (Table 3).
Discussion
This study has several main findings. The A-allele of FTO-rs9939609 was associated with a decrease in the percentage of energy from protein and positively associated with the percentage of energy from carbohydrates before pregnancy and positively associated with change in the percentage of energy from ultra-processed foods from pre-pregnancy to pregnancy. C-allele of MC4R-rs17782313 was associated with change in the total energy intake from pre-pregnancy to pregnancy, with C-allele carriers presenting a lower adjusted mean when compared with non-carriers. A-allele of LEP-rs7799039 was associated with dietary intake change from pre-pregnancy to pregnancy, with carriers presenting lower total energy intake adjusted mean and higher adjusted mean in the percentage of energy from protein when compared with non-carriers.
The minor frequency alleles (MAF) observed in this study were quite similar to the range of reported values in other published studies with a Brazilian population for FTO-rs9939609 (0·40/0·45) and MC4R-rs17782313 (0·15/0·23)( Reference Da Cunha, de Carlos Back and Sereia 31 ) and for LEP-rs7799039 (0·27/0·30)( Reference Duarte, Francischetti and Genelhu 32 ). The MAF for LEPR-rs1137101 in this study was higher than that reported in a study of multi-ethnic subjects in the same city as our study (0·39/0·43)( Reference Duarte, Francischetti and Genelhu 32 ) but similar to 0·45 – the mean rate (ranged from 0·32 to 0·58) that was observed in different Caucasian populations and in those of Western European descent (0·47)( Reference den Hoed, Westerterp-Plantenga and Bouwman 33 , Reference Paracchini, Pedotti and Taioli 34 ). In this study, the MAF of the A-allele at the rs9939609 variant is also comparable to that in Pakistani (0·40) and Italian (0·43) studies( Reference Fawwad, Siddiqui and Basit 35 , Reference Bordoni, Marchegiani and Piangerelli 36 ) but higher than that reported in a sample of the Chinese population (0·12)( Reference Li, Wu and Loos 37 ). The MAF of the C-allele at the rs17782313 variant is lower than that reported in Italian (0·28) and Korean (0·26) populations( Reference Bordoni, Marchegiani and Piangerelli 36 , Reference Park, Daily and Zhang 38 ).
Recent gene identification efforts have provided a more comprehensive picture of the biological mechanisms involved in the development of obesity. Many of the obesity-susceptibility genes are highly expressed in the hypothalamus, a crucial neural centre for energy balance and regulation of food intake( Reference Hofker and Wijmenga 39 ). Overweight and obesity are the results of a complex interplay between genetic determinants and conditions associated with lifestyle and the environment that have additive and interactive effects. It is worth noting that this is the first study, to the best of our knowledge, that has examined the association between FTO-rs9939609, MC4R-rs17782313, LEP-rs7799039 and LEPR-rs1137101 polymorphisms and dietary intake during pregnancy, proving it difficult to compare our data.
The physiologic pathway by which variation in the FTO gene influences the risk of developing obesity largely remains to be established. A study showed that subjects homozygous for FTO-rs9939609 appear to determine neural responses to circulating concentrations of the hunger hormone ghrelin( Reference Karra, O’Daly and Choudhury 40 ), which may lead to increased energy intake in those carrying the risk allele. The role of FTO in the pathogenesis of obesity has additionally been demonstrated in a rodent model, which indicated that increased expression of FTO leads to increased fat mass and obesity via hyperphagia( Reference Church, Moir and McMurray 41 ).
Research involving humans has suggested that the risk allele of the FTO-rs9939609 gene may influence food consumption parameters including total energy intake( Reference Cecil, Tavendale and Watt 42 , Reference Qi, Downer and Kilpeläinen 43 ), food preferences( Reference Brunkwall, Ericson and Hellstrand 44 , Reference Cecil, Tavendale and Watt 42 ) and appetite regulation( Reference Dougkas, Yaqoob and Givens 7 , Reference den Hoed, Westerterp-Plantenga and Bouwman 33 ), suggesting that diet may mediate the effect of FTO on obesity. However, these associations have not been replicated in other studies( Reference Liu, Zhu and Lagou 45 , Reference Hasselbalch, Ängquist and Christiansen 46 ). We observed that this variant was associated with a decrease in the percentage of energy from protein and positively associated with the percentage of energy from carbohydrates before pregnancy and also associated with change in the percentage of energy from ultra-processed foods from pre-pregnancy to pregnancy. Protein is considered the most satiating macronutrient( Reference Morell and Fiszman 47 ); thus, it is plausible that the A-allele of FTO was related to modifications of food cravings and appetite with increased energy intake from carbohydrates and ultra-processed foods.
The MC4R gene is the most common cause of severe early monogenic obesity( Reference Farooqi, Keogh and Yeo 48 ) and an important contributor to polygenic obesity in humans( Reference Cecil, Dalton and Finlayson 12 ). However, its expression is variable, its penetrance is incomplete and both its expression and penetrance are age-dependent( Reference Stutzmann, Tan and Vatin 49 ). In addition, the incomplete penetrance and the variable expression of MC4R mutations suggest an important environmental influence. The phenotypic features of MC4R deficiency include hyperphagia( Reference Cecil, Dalton and Finlayson 12 , Reference Farooqi, Keogh and Yeo 48 ) through the leptin–melanocortin signalling system( Reference Girardet and Butler 50 ); the severity of hyperphagia may decline with age and it was greater in homozygous compared with heterozygous cases( Reference Farooqi, Keogh and Yeo 48 , Reference Stutzmann, Tan and Vatin 49 ). In our study, the majority of the pregnant women were heterozygous, with only four homozygous subjects with the minor allele. Therefore, we were unable to test this possibility.
The MC4R-rs17782313 C-allele has been associated with high snack consumption( Reference Stutzmann, Cauchi and Durand 11 ) and with high intakes of total energy and dietary fat in women of European ancestry( Reference Qi, Kraft and Hunter 51 ). We observed that MC4R-rs17782313 genotypes were not associated with daily energy intake before pregnancy. This is consistent with the results of studies in Dutch( Reference Bauer, Elbers and Adan 13 ) and Danish( Reference Hasselbalch, Ängquist and Christiansen 46 ) women. We also found that the MC4R-rs17782313 gene was significantly associated with changes in total energy intake from pre-pregnancy to pregnancy, independently of pre-pregnancy energy intake. However, C-allele carriers did not present higher energy intake adjusted means.
In the current study, the association of the MC4R-rs17782313 and the percentage of energy from ultra-processed foods from pre-pregnancy to pregnancy lost significance when the results were adjusted for pre-pregnancy dietary intake. In contrast, a study in the Korean population reported that the MC4R-rs17782313 C-allele displayed a positive association with ramen (Japanese dish consisting of wheat noodle mixed with flavoured broth and a number of different toppings) and processed foods including canned tuna, fish cake, ham and cheese( Reference Park, Daily and Zhang 38 ).
There are limited studies evaluating the association of LEP-rs7799039 and its receptor (LEPR-rs1137101) with food intake in the adult population. The LEPR-rs1137101 SNP resulting in amino acid substitution Gln223Arg was earlier hypothesised to affect the functionality of the LEPR, with the G allele resulting in reduced LEP sensitivity( Reference Yiannakouris, Yannakoulia and Melistas 52 ). Resistance to leptin is known to increase food intake. Research conducted in Brazil on children (4 years of age) found that G-allele carriers of LEPR-rs1137101, but not LEP-rs7799039, had a higher total energy intake( Reference Zandoná, Rodrigues and Albiero 53 ). In Tunisian adults, subjects with the AA genotype for LEP-rs7799039 and GG genotype for LEPR-rs1137101 genes had a significantly higher daily energy intake( Reference Boumaiza, Omezzine and Rejeb 10 ). We did not find an association between LEPR-rs1137101 SNP and dietary intake in pregnant women, but found that A-allele of LEP-rs7799039 was associated with dietary intake change from pre-pregnancy to pregnancy, with carriers presenting lower total energy intake adjusted mean and higher adjusted mean of the percentage of energy from protein when compared with non-carriers.
There is evidence to conclude that obesity candidate gene SNP may be associated with dietary intake parameters, and their identification may allow the development of tailored interventions to prevent future health problems. However, phenotype intensity is potentially modulated by environmental and individual characteristics( Reference Cecil, Dalton and Finlayson 12 ), and the genetic contribution to population phenotypic differentiation is driven by differences in causal allele frequencies, effect sizes and genetic architecture( Reference Brown, Ye and Price 54 ).
Our study presents limitations and strengths that need to be highlighted. One of the limitations of the present study is the limited sample size and lack of formal power calculation, as this study was designed to be exploratory and hypothesis-generating in nature and not confirmatory. Therefore, the results should be taken with caution because our study is underpowered and other studied associations could have been missed in the statistical analysis. Corrections for multiple testing were not performed in the present study. The statistical significant results could therefore include false positives. However, it provides important information that may be useful in future studies to consolidate whether genes susceptible to obesity are associated with dietary intake in pregnant women, which should be confirmed in larger cohorts of pregnant women. An additional limitation is that the FFQ previously validated for adults( Reference Sichieri and Everhart 22 ) was not developed specifically for pregnancy, but represent the usual dietary intake of the population who lives in Rio de Janeiro. Epidemiological studies have shown that an FFQ can be used to measure nutritional dietary intake during pregnancy with acceptable reproducibility and represents a useful tool for categorising pregnant women according to their dietary intake( Reference Vioque, Navarrete-Muñoz and Gimenez-Monzó 55 ), including in Brazil( Reference Barbieri, Nishimura and Crivellenti 56 ). Moreover, there was no validated FFQ for pregnant women in Brazil when this cohort study began.
In conclusion, the A-allele carriers of FTO-rs9939609 were positively associated with the percentage of energy from carbohydrates and with a decrease in the percentage of energy from protein before pregnancy and with change in the percentage of energy from ultra-processed foods from pre-pregnancy to pregnancy compared with those with the TT-genotype. The C-allele of MC4R-rs17782313 was associated with change in the total energy intake from pre-pregnancy to pregnancy, with C-allele carriers presenting a lower adjusted mean than non-carriers. There was a significant association between A-allele of LEP-rs7799039 and change in dietary intake from pre-pregnancy to pregnancy, with carriers presenting lower total energy intake adjusted mean and higher adjusted mean of percentage of energy from protein when compared with non-carriers, but there was no association of LEPR-rs1137101 with total energy intake and percentage of energy from macronutrients or ultra-processed foods.
Genes might interact with each other or with environmental factors such as food nutrients to play a role in the development of adiposity. Further research using high-quality dietary data is required to consolidate whether obesity-susceptible genes are associated with dietary intake to allow the application of tailored interventions to prevent obesity in genetically predisposed individuals.
Acknowledgements
The authors would like to acknowledge Professor Rosane Silva for her technical support in the genotyping analysis and for allowing us to conduct DNA extraction in the Laboratory of Macromolecular Metabolism Firmino Torres de Castro, Biophysics Institute, Rio de Janeiro Federal University (UFRJ). The authors also thank Professor Maria das Graças Tavares do Carmo for allowing us to work at the Laboratory of Nutritional Biochemistry of the Nutrition Institute, UFRJ.
This study was supported by the Carlos Chagas Filho Research Foundation from the State of Rio de Janeiro (FAPERJ) (grant nos E-26/111·400/2010, E-26/110·681/2012; E-26/112·181/2012; E-26/111·698/2013). The funders had no role in the design, analysis or writing of this article.
The authors’ contributions are as follows: M. C. M. performed statistical analysis, and participated in the interpretation of results and writing of the manuscript. J. T. participated in statistical analysis and contributed to the discussion and data interpretation. A. A. F.-V. and D. R. F. participated in the data collection and contributed to the discussion and data interpretation. E. L. R. and C. J. S. contributed to the discussion and data interpretation. G. K. participated in the designing the work, contributed to the discussion and data interpretation and reviewed the manuscript.
The authors declare that there are no conflicts of interest.
Supplementary material
For supplementary material/s referred to in this article, please visit https://doi.org/10.1017/S0007114518001423


