


Knowing the quantitative accuracy of dietary assessment tools bolsters the validity of diet–disease findings, informs the design of appropriate research questions and allows for calibration of risk estimates correcting for known error(Reference Willett1). FFQ are the most commonly used assessment tool in large epidemiological studies. Validity of data from FFQ can be assessed utilising a variety of study designs. Most often, a subset of the study population is selected to complete multiple food records or 24 h dietary recalls over a period of weeks or months as a reference for comparison with FFQ data. However, such reference measures are imperfect, given correlated errors between the FFQ and either diet recalls or records(Reference Prentice2–Reference Kipnis, Carroll and Freedman4). Opportunities for validation via dietary biomarkers are limited for most nutrients and/or food items and, in some cases, require special sample preparation(Reference Potischman5, Reference Arab6). Despite being objective (as opposed to self-reported), biomarkers themselves are imperfect markers; thus, non-dietary factors that affect circulating concentrations often need to be considered in the interpretation. Consequently, some large epidemiological studies(Reference Willett, Stampfer and Chu7–Reference Rock, Flatt and Thomson9) have taken advantage of the well-known associations of dietary carbohydrate and fat with plasma lipids (namely, TAG and HDL-cholesterol)(Reference Mensink and Katan10–Reference Parks and Hellerstein12).
The Multi-Ethnic Study of Atherosclerosis (MESA) is a cohort study including men and women from four different race/ethnic groups. The FFQ used in the MESA was based on an FFQ originally designed for the Insulin Resistance and Atherosclerosis Study (IRAS), the validity of which was previously studied in a sample of non-Hispanic whites, African-Americans and Hispanics(Reference Block, Woods and Potosky13, Reference Mayer-Davis, Vitolins and Carmichael14). Because Chinese-Americans were also included in the MESA study, modifications were made to the FFQ to accommodate their unique cuisine. Although the MESA FFQ, as changed from the IRAS FFQ, has not been formally validated through comparison with diet records, it performs well insofar as significant associations between various aspects of diet and disease risk factors(Reference Nettleton, Steffen and Palmas15–Reference Jiang, Jacobs and Mayer-Davis20) as well as incident type 2 diabetes(Reference Nettleton, Steffen and Ni21) and CVD(Reference Nettleton, Burke and Polak22) have been reported in the MESA cohort. Since no single method of validation is capable of characterising the accuracy of all dietary constructs measured by FFQ, the utility of any FFQ must be evaluated on the basis of multiple complementary tests of its validity. In the context of predictive validity suggested by the published studies(Reference Nettleton, Steffen and Palmas15–Reference Nettleton, Burke and Polak22), further characterisation of the overall performance of the dietary data collected in the MESA in terms of known relationships of food and nutrients to biomarkers provides another lens through which to understand the performance of the FFQ. Furthermore, the MESA offers the opportunity to assess the race/ethnic-specific performance of dietary assessment by FFQ. Such data are valuable in terms of the long-standing concern regarding the reliability and accuracy of various diet assessment instruments in race/ethnic minorities, such as African-Americans(Reference Lui23–Reference Coates and Monteilh25).
Therefore, we evaluated the cross-sectional associations between reported macronutrient intakes and fasting plasma TAG and HDL in the full MESA cohort and in each race/ethnic group represented. Our hypotheses were as follows: (1) the percentage of total energy intake from dietary carbohydrate would be inversely associated with HDL but positively associated with TAG; (2) the percentage of total energy intake from fat would be positively associated with HDL but inversely associated with TAG; (3) the macronutrient–plasma lipid associations would be consistent across race/ethnic groups.
Methods
Participants
The MESA is a population-based study of 6814 non-Hispanic white, African-American, Hispanic and Asian-American (of Chinese descent) men and women, aged 45–84 years from six field centres in the USA: Baltimore City and County, MD; Chicago, IL; Forsyth County, NC; New York, NY; Los Angeles County, CA; St Paul, MN(Reference Bild, Bluemke and Burke26). The present study was conducted according to the guidelines laid down in the Declaration of Helsinki and all procedures involving human subjects and patients were approved by the affiliated institutional review boards affiliated with each of the participating academic centres. Written informed consent was obtained from all participants. The present cross-sectional investigation includes data from 4510 MESA participants (1868 non-Hispanic whites; 1111 African-Americans; 952 Hispanics; 579 Chinese-Americans), after excluding individuals who were missing fasting TAG or HDL measurements, who had TAG concentrations>3990 mg/l, who provided insufficient or implausible dietary information (defined previously)(Reference Nettleton, Steffen and Mayer-Davis17), plus those with diabetes or who were taking cholesterol-lowering medications, since either of these conditions are likely to lead to dietary changes or otherwise alter diet–lipid relationships.
Diet assessment
At the baseline examination, usual dietary intake over the previous year was assessed with a modified Block-style 120-item FFQ(Reference Block, Woods and Potosky13, Reference Mayer-Davis, Vitolins and Carmichael14). Consumption frequency and serving size of each food or beverage were assessed. Characteristic of the Block FFQ design, serving sizes were quantified as small, medium or large, with corresponding weights (g) imputed according to National Health and Nutrition Examination Survey (NHANES) data(Reference Block, Woods and Potosky13). Nutrients were calculated for each FFQ line item according to a weighted recipe using the Nutrition Data System for Research (NDS-R database; Nutrition Coordinating Center, Minneapolis, MN, USA). Additional input specified the type of milk on cold cereals, defined cold cereal as whole or refined, specified the type of fat used in refried beans, and incorporated information from responses to questions regarding low-fat food choices. To create the final MESA FFQ, several questions were added to the FFQ used in IRAS to help increase its validity with the range of ethnic groups. Specifically, to accommodate the unique cuisine of Chinese-Americans, the following questions were included: stir-fried vegetables; stir-fried vegetables with tofu; stir-fried vegetables with beef, chicken or pork; stir-fried vegetables with shrimp; fried rice; Chinese dumplings, spring rolls or dim sum; chow mein; oriental noodles with meat; desserts made with tofu; soya milk; miso soup. Although these questions were added to more accurately assess eating habits of the Chinese participants, others also consumed these items (mean servings/d of the sum of these items: non-Hispanic whites, 0·30 (sd 1·0); African-Americans, 0·38 (sd 0·93); Hispanics, 0·35 (sd 0·55); Chinese, 2·0 (sd 1·6)).
LDL, HDL and TAG measurements
Plasma HDL and TAG concentrations were measured directly with reagents from Roche Diagnostics (Indianapolis, IN, USA) (analytical CV were 2·9 and 4·0 %, respectively). LDL was calculated with the Friedewald equation for specimens having TAG concentrations < 4000 mg/l (4·52 mmol/l)(Reference Friedewald, Levy and Fredrickson27). All analytes were analysed at the Collaborative Studies Clinical Laboratory (Fairview-University Medical Center, Minneapolis, MN, USA).
Other measures
Information on demographics, education, medication use and smoking history was collected at baseline with a combination of self-administered and interviewer-administered questionnaires. BMI (kg/m2) was calculated from measured weight and height. The frequency and time spent in various physical activities during a typical week in the previous month were assessed using the MESA Typical Week Physical Activity Survey, adapted from the Cross-Cultural Activity Participation Study(Reference Ainsworth, Irwin and Addy28).
Statistical analysis
Linear regression was used to examine baseline demographic, lifestyle, clinical and dietary characteristics of the study sample stratified by race/ethnic group. Comparisons among race/ethnic strata were tested by F test (continuous variables) or χ2 (categorical variables). Relationships between macronutrient intakes and HDL and TAG (dependent variables) were expressed as β regression coefficients per 5 percentage points change in energy for carbohydrate and total fat or per 2 percentage points change in energy from each SFA, PUFA and MUFA. Nutrient–lipid associations were also depicted using a categorical nutrient variable (categories based on previous studies(Reference Willett, Stampfer and Chu7). or distribution within the MESA dataset; see Tables 4 and 5), with P trends calculated by modelling the categorical variable continuously.
Two multivariable models were used for these analyses. Model 1 adjusted for field centre, sex, age, energy intake, plus race/ethnicity in analyses of the race/ethnic pooled sample. Model 2 included the variables listed in model 1, plus physical activity level (two variables: active leisure included walking, sport and conditioning activities in metabolic equivalent-min/week; inactive leisure included television, reading and light sitting activities in metabolic equivalent-min/week), alcohol intake (drinks/week), smoking status, cigarette pack years and BMI. Results with additional adjustment for percentage energy from protein, dietary fibre or homeostasis model assessment of insulin resistance (HOMA-IR) did not differ from those of model 2 and, therefore, are not presented. Results are presented for the race/ethnic pooled sample and for each race/ethnic group separately. Interactions in prediction of the dependent variables between macronutrient intake and race/ethnicity, sex, BMI class ( < 25 kg/m2v. ≥ 25 kg/m2) and fasting glucose ( < 1000 mg/l v. 1000–1250 mg/l (1000 mg/l glucose = 5·55 mmol/l glucose)) were tested by addition of a corresponding cross-product term to model 2.
All analyses were performed with SAS (version 9.1; SAS Institute, Inc., Cary, NC, USA). Due to skewed distribution, C-reactive protein was analysed on the log scale. After excluding participants with fasting TAG ≥ 4000 mg/l, TAG concentrations were close to being normally distributed and, thus, analysed without transformation. Plasma lipids were analysed in mg/l. To convert LDL from mg/l to mmol/l, multiply by 0·00259; to convert HDL from mg/l to mmol/l, multiply by 0·00259; to convert TAG from mg/l to mmol/l, multiply by 0·00113.
Results
Participant characteristics, macronutrient intakes and plasma lipid concentrations
Race/ethnic-specific demographic and lifestyle characteristics, intakes of dietary macronutrients and concentrations of plasma lipids are shown in Table 1. The highest prevalence of smoking was found in non-Hispanic whites. African-Americans reported the highest amount of leisure time spent in active pursuits (i.e. walking, conditioning and other sports activities) but also had the highest mean BMI among race/ethnic groups. BMI was lowest among the Chinese-Americans. Energy intake was highest in the Hispanic participants and lowest in Chinese-Americans. The energy contribution from macronutrients and crude plasma lipid concentrations also differed by race/ethnicity (P < 0·01 for all; Table 1). For example, the Chinese-Americans had the highest protein and total fat, MUFA and PUFA intake, but the lowest SFA intake. The highest LDL and lowest HDL concentrations were observed in Hispanics; the highest C-reactive protein was observed in African-Americans; the highest TAG concentrations were observed in Chinese-Americans.
Table 1 Daily energy and macronutrient intakes and plasma lipids of 4510 non-Hispanic white, African-American, Hispanic and Chinese-American men and women from the Multi-Ethnic Study of Atherosclerosis*
(Mean values with their standard errors or percentages)
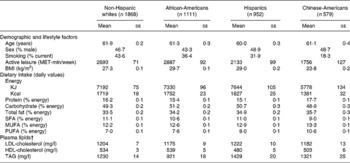
MET, metabolic equivalents.
* P < 0·01 for all, with the exception of sex (significance for difference among race groups: P>0·05).
† To convert LDL-cholesterol from mg/l to mmol/l, multiply by 0·00259; to convert HDL-cholesterol from mg/l to mmol/l, multiply by 0·00259; to convert TAG from mg/l to mmol/l, multiply by 0·00113.
Associations between macronutrients and plasma HDL and TAG in all participants
In the pooled sample of all participants (men and women in all race/ethnic groups), statistically significant associations between macronutrients (as a percentage of total energy intake) and plasma concentrations of HDL and TAG were evident after adjustment for demographic characteristics and lifestyle factors, including physical activity and BMI (Table 2). Each 5-unit increase in the percentage of energy intake contributed by dietary carbohydrate corresponded to a statistically significant 5 mg/l lower HDL concentration and 15 mg/l greater TAG concentration (β = − 5 (se 1) mg/l (P < 0·001) for HDL; β = 15 (se 6) mg/l (P = 0·008) for TAG). Analogously, a 5-unit increase in the percentage of energy intake contributed by dietary fat corresponded to a statistically significant 3·7 mg/l greater HDL concentration and 19 mg/l lower TAG concentration (β = 3·7 (se 2) mg/l (P = 0·01) for HDL; β = 19 (se 7) mg/l (P = 0·004) for TAG). Similar associations with HDL and TAG were noted for SFA, PUFA and MUFA, although regression coefficients varied in magnitude and were not always statistically significant (Table 2).
Table 2 Regression coefficients reflecting expected change in plasma HDL-cholesterol or TAG concentration (mg/l) per 5-unit change in percentage of energy from dietary carbohydrate or total dietary fat and per 2-unit change in percentage energy from dietary saturated (SFA), monounsaturated (MUFA) or polyunsaturated fat (PUFA) in 4510 non-Hispanic white, African-American, Hispanic and Chinese-American men and women from the Multi-Ethnic Study of Atherosclerosis
(β Coefficients with their standard errors)
*P < 0·05, **P < 0·01.
† To convert HDL-cholesterol from mg/l to mmol/l, multiply by 0·00259; to convert TAG from mg/l to mmol/l, multiply by 0·00113.
‡ Adjusted for model 1 covariates: study centre, sex, race/ethnicity, age and energy intake.
§ Adjusted for model 2 covariates: above+education level, physical activity, smoking status, smoking pack years, alcoholic drinks per week and BMI.
Race/ethnic-specific associations between dietary macronutrients and plasma HDL and TAG
Although the magnitude and, in some instances, direction of macronutrient–plasma lipid associations did differ among race/ethnic groups, statistically significant interactions were observed only with dietary carbohydrate and with dietary SFA in prediction of HDL concentrations (Table 3). There were no statistically significant interactions between race/ethnicity and dietary macronutrient intake in prediction of TAG concentrations. In non-Hispanic whites, dietary carbohydrate, total fat, SFA and MUFA were significantly associated with plasma HDL concentrations, in directions consistent with those observed in the full sample. In Chinese-Americans, dietary carbohydrate, total fat and SFA were also significantly associated with plasma HDL concentrations, and regression coefficients representing these associations in the Chinese-Americans were very similar to those observed in the white participants. In contrast, the magnitudes of these associations were much smaller in the African-American and Hispanic participants and not statistically significant. Regression coefficients representing the associations between macronutrient intakes and plasma TAG were more comparable across race/ethnic groups, although they were larger in magnitude and formally significant only in the Chinese-American participants.
Table 3 Race/ethnic-specific regression coefficients reflecting expected change in plasma HDL-cholesterol or TAG concentrations (mg/l) per 5-unit change in percentage of energy from dietary carbohydrate or total dietary fat and per 2-unit change in percentage energy from dietary saturated (SFA), monounsaturated (MUFA) or polyunsaturated fat (PUFA) in 4510 non-Hispanic white, African-American, Hispanic and Chinese-American men and women from the Multi-Ethnic Study of Atherosclerosis
(β Coefficients with their standard errors)
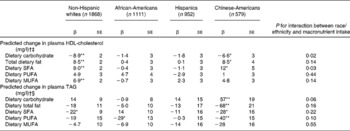
*P < 0·05, **P < 0·01.
† Adjusted for model 2 covariates: study centre, sex, race/ethnicity, age, energy intake, education level, physical activity, smoking status, smoking pack years, alcoholic drinks per week and BMI.
‡ To convert HDL-cholesterol from mg/l to mmol/l, multiply by 0·00259.
§ To convert TAG from mg/l to mmol/l, multiply by 0·00113.
There were no interactions between macronutrient intake and sex or fasting glucose status ( < 1000 v. ≥ 1000 mg/l) in prediction of HDL or TAG concentrations (data not shown). When analyses were stratified by BMI class, the associations between percentage of energy intake from carbohydrate and HDL (inverse) and TAG (positive) were stronger in those participants with a BMI < 25 kg/m2v. those with a BMI ≥ 25 kg/m2 (for HDL, β = − 1·5 (se 0·5) mg/l (P < 0·01) v. − 0·6 (se 0·3) mg/l (P = 0·02) (P interaction = 0·009); for TAG, β = 4·8 (se 2) mg/l (P < 0·01) v. 1·9 (se 0·1) mg/l (P = 0·18) (P interaction = 0·01)).
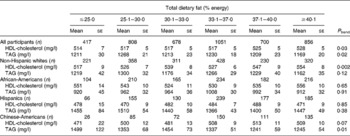
An alternative representation of these results with the percentage energy intake from carbohydrate and percentage energy intake from total dietary fat modelled categorically is given in Tables 4 and 5. These results mirrored those described above with dietary macronutrients modelled continuously.
Table 4 HDL-cholesterol and TAG concentrations across categories of dietary carbohydrate intake in 4510 men and women from the Multi-Ethnic Study of Atherosclerosis*†
(Mean values with their standard errors)

* Adjusted for model 2 covariates: study centre, age, sex, race/ethnicity, total energy intake, education level, smoking status, smoking pack years, physical activity, alcoholic drinks per week and BMI.
† To convert HDL-cholesterol from mg/l to mmol/l, multiply by 0·00259; to convert TAG from mg/l to mmol/l, multiply by 0·00113.
Table 5 HDL-cholesterol and TAG concentrations across categories of dietary total fat intake in 4510 men and women from the Multi-Ethnic Study of Atherosclerosis*†
(Mean values with their standard errors)
* Adjusted for model 2 covariates: study centre, age, sex, race/ethnicity, total energy intake, education level, smoking status, smoking pack years, physical activity, alcoholic drinks per week and BMI.
† To convert HDL-cholesterol from mg/l to mmol/l, multiply by 0·00259; to convert TAG from mg/l to mmol/l, multiply by 0·00113.
Discussion
This aim of the present cross-sectional study was to quantify the concordance of the MESA FFQ with known relationships between macronutrient intake and plasma lipid concentrations. Overall, the present results support our hypotheses, with positive associations between dietary fat and HDL and between dietary carbohydrate and TAG and negative associations between dietary fat and TAG and between dietary carbohydrate and HDL. Although there were possibly some differences among race/ethnic groups, race/ethnic interaction was at most marginally statistically significant and there could be metabolic differences among the race/ethnic groups.
Associations between macronutrient intakes and plasma lipid concentrations were statistically significant; however, the magnitudes of the predicted plasma lipid changes in association with macronutrient intake were small, clinically speaking(29), which is an important distinction between the present study and those aimed at quantifying disease risk incurred by dietary macronutrient intake(Reference Hu, Stampfer and Manson30). The purpose of our exercise was not to determine how macronutrient intake might influence disease risk via lipid risk factors, but rather to test the criterion validity of the MESA FFQ, the validity of which otherwise rests on its affinity to the validated IRAS questionnaire and its predictive and correlational associations with risk factors and disease incidence. The use of plasma lipids as biomarkers for carbohydrate and fat intakes has precedent in other large epidemiological cohorts(Reference Willett, Stampfer and Chu7–Reference Rock, Flatt and Thomson9) and boasts the advantage of minimal participant burden, study expense, and uncorrelated error structure (unlike 24 h recalls or dietary records commonly used to calibrate FFQ(Reference Prentice2–Reference Kipnis, Carroll and Freedman4)). Although plasma lipid concentrations are sensitive to macronutrient intake (particularly the relative contributions of total fat and carbohydrate(Reference Mensink and Katan10, Reference Mensink, Zock and Kester11)), concentrations are not specific to macronutrient intake. Other factors such as demographic characteristics, genetics, behavioural choices and adiposity also influence plasma lipid levels, most of which were included as covariates in our analyses.
Before inclusion of Chinese food items and administration at the MESA baseline examination, the validity of the parent FFQ was evaluated in a sample of non-Hispanic whites, African-Americans and Hispanics(Reference Block, Woods and Potosky13, Reference Mayer-Davis, Vitolins and Carmichael14). Given that Chinese-Americans were not included in that study and that subsequent FFQ modifications were specific to their cuisine, the associations between macronutrient intake and plasma HDL and TAG concentrations add to the evidence that the MESA FFQ is meaningful in the Chinese-American subgroup. The weaker associations of carbohydrate and fat in African-Americans and Hispanics could suggest lower validity in these two groups than in other race/ethnicities. For several reasons we do not weigh this finding heavily. Although race/ethnic interactions for associations of HDL with carbohydrate and total fat did have P values of 0·02 and 0·03, the interactions were not hypothesised and would not be judged to be statistically significant in the context of multiple testing. The possible race/ethnic interactions for TAG differed from those for HDL, with coefficients for African-Americans or Hispanics, in some cases, second largest, rather than smallest, as in the case of HDL. The observed differences among race/ethnic groups could be the result of residual confounding, for example, due to imperfectly measured or unmeasured demographic, genetic and lifestyle confounders. For example, differences in genotype frequencies for polymorphisms known to affect HDL and TAG metabolism(Reference Miljkovic-Gacic, Bunker and Ferrell31–Reference Carr, Brunzell and Deeb34) may have contributed to the inconsistencies in macronutrient–lipid associations among race/ethnic groups that we observed, especially if such genetic variation also translates into differences in the nature of macronutrient × genotype interactions(Reference Nettleton, Steffen and Ballantyne35). Furthermore, the dietary patterns in each race/ethnic group (described previously)(Reference Nettleton, Steffen and Mayer-Davis17) were as expected based on external information. Other risk factor and longitudinal relationships with dietary patterns in the MESA cohort have not found weaker associations in African-American and Hispanic participants(Reference Nettleton, Steffen and Palmas15, Reference Nettleton, Steffen and Mayer-Davis17, Reference Nettleton, Steffen and Ni21, Reference Nettleton, Steffen and Schulze36). Considering the full context of work in the MESA, the findings of the present investigation, together with the results of previous MESA diet investigations, demonstrate that the performance of the MESA FFQ is comparable with that of FFQ utilised by other large epidemiological studies that do not face the challenge of accommodating an ethnically diverse population with correspondingly diverse dietary habits.
We observed significant interactions between BMI and percentage of energy intake from carbohydrate for both HDL and TAG, where stronger associations were noted in those with healthy BMI compared with those who were overweight or obese. Results from a similar analysis in the Health Professionals Follow-Up Study cohort suggested that macronutrient–plasma lipid associations were stronger in the overweight and obese men compared with the healthy-weight men, although the interaction was not statistically significant(Reference Willett, Stampfer and Chu7). While biological differences may be responsible for the results in the Willett et al. (Reference Willett, Stampfer and Chu7) study (for example, metabolic differences in glucose handling), it may be that measurement error unique to the overweight/obese strata (particularly, under-reporting bias)(Reference Lissner, Troiano and Midthune37) explains the weaker associations observed in the overweight/obese strata in the present study. However, it is important to note that despite the presence of statistical interaction due to differences in the magnitude of the relationships between percentage energy intake from carbohydrate and HDL and TAG concentrations, regression coefficients were statistically significant in each BMI strata and thus less likely to result in significant systematic bias.
Other limitations to our analysis deserve mention. Single plasma lipid measurements do not account for the intra-individual variation that is probably present. We did not adjust our regression estimates for measure of carbohydrate type or quality, such as glycaemic index or load(Reference Liu, Manson and Stampfer8). However, we did adjust for fibre and found no material changes in regression coefficients, consistent with data from other epidemiological studies(Reference Rock, Flatt and Thomson9) and from controlled feeding studies utilising whole, high-fibre foods(Reference Parks, Krauss and Christiansen38).
Associations of macronutrient intakes with HDL and TAG concentrations were statistically significant and in directions consistent with previous studies(Reference Willett, Stampfer and Chu7, Reference Rock, Flatt and Thomson9–Reference Mensink, Zock and Kester11). While in some instances the expected diet–lipid relationships were less consistent in MESA African-Americans and Hispanics, the race/ethnic interactions were not formally significant. Collectively, these data, together with previous MESA investigations showing that other dietary factors are associated with CVD risk factors(Reference Nettleton, Steffen and Palmas15–Reference Nettleton, Steffen and Mayer-Davis17, Reference Jiang, Jacobs and Mayer-Davis20) as well as predict incident diabetes(Reference Nettleton, Steffen and Ni21) and clinical CVD events(Reference Nettleton, Burke and Polak22) consistently in all race/ethnic groups, bolster our confidence in the accuracy of the dietary assessment tool used in the MESA. Ascertaining what individuals habitually eat is among the most difficult of epidemiological tasks. While no standard of perfection exists, the MESA FFQ appears to meet the needs of epidemiologists seeking to understand how diet influences multiple health outcomes in a multi-ethnic population.
Acknowledgements
This research was supported by contracts N01-HC-95159 through N01-HC-95166 from the National Heart, Lung, and Blood Institute, and General Clinical Research Center Grant M01-RR00645 from the National Center for Research Resources.
J. A. N. was responsible for analytical design, data analysis and interpretation, and manuscript preparation. C. L. R. and Y. W. were involved in data interpretation and manuscript review. N. S. J. was involved in sample analysis and manuscript review. D. R. J. was involved in data acquisition and manuscript review.
The authors thank the other investigators, the staff and the participants of the MESA study for their valuable contributions. A full list of participating MESA investigators and institutions can be found at http://www.mesa-nhlbi.org
The authors have no conflicts of interest to disclose.


