


South Asians, one of the fastest growing immigrant groups in the USA(1), remain understudied and underrepresented in large epidemiological studies(Reference Ardeshna, Bob-Manuel and Nanda2). Consequently, dietary and clinical guidelines for this population are not distinct, despite the disproportionately higher prevalence of non-communicable disease burden, particularly atherosclerotic CVD, among South Asians in the USA(Reference Ardeshna, Bob-Manuel and Nanda2,Reference Volgman, Palaniappan and Aggarwal3) . South Asians are described as experiencing the ‘Asian paradox,’ defined as high incidence and prevalence of non-communicable disease despite BMI in the normal range(Reference Tunstall-Pedoe, Starkey and Mathews4). BMI continues to be the most widely used measure to screen for weight category and risk for overweight and obesity(Reference Gutin5), despite a growing body of research that advocates for the implementation of complementary body measures that would more accurately approximate central body fatness(6), rather than reliance on a height:weight ratio. Central obesity is characterised by visceral fat mass, the type of fat that surrounds abdominal organs and impairs their function, commonly associated with non-communicable disease(Reference Matsuzawa, Shimomura and Nakamura7). Moreover, South Asians tend to have higher intermuscular fat area(Reference Shah, Kandula and Lin8), a type of ectopic fat that is implicated in metabolic dysfunction and insulin resistance(Reference Addison, Marcus and Lastayo9). Recent evidence suggests that waist circumference, hip girth and waist:hip ratio (WHR) serve as better indicators of central obesity(Reference Lee, Huxley and Wildman10), specifically in South Asians(Reference Araneta, Kanaya and Hsu11,Reference Flowers, Lin and Kandula12) . Therefore, clear definitions of central obesity measures are needed to better identify early disease risk.
Dietary intake has a modifiable influence on body composition. Published evidence documents that South Asian immigrants, regardless of region of origin, experience dietary acculturation in their new country(Reference Khan, Jackson and Momen13), with a particular shift towards increased dairy product consumption(Reference Holmboe-Ottesen and Wandel14). Research has also found that dairy product is a central component among South Asians who are vegetarian(Reference Jaacks, Kapoor and Singh15). Previous research on dairy product intake and body composition is inconsistent, with six systematic reviews noting conflicting findings(Reference Abargouei, Janghorbani and Salehi-Marzijarani16–Reference Geng, Qi and Huang21), underscoring the need for additional research in order to generate robust evidence examining this relationship. Moreover, the majority of studies relied on one or two anthropometric measures of body composition. Thus, the relationship between dairy product intake and comprehensive measures of body composition that comprise of both anthropometric measurements and computed tomography (CT) body mass imaging has not been examined together, and it needs further investigation.
Using data from the Mediators of Atherosclerosis in South Asians Living in America (MASALA) study(Reference Kanaya, Kandula and Herrington22), the present analysis addresses two key gaps in the literature: to examine the relationship between dairy product consumption and (1) body adiposity and (2) multidimensional measures of body composition in a cohort of middle- to older-aged South Asian adults in the USA. The study utilises CT imaging, an advanced technology that more accurately distinguishes body composition fat type (subcutaneous, visceral and intermuscular) contributing to central adiposity among participants. We hypothesise that a higher intake of dairy products is associated with a lower waist circumference and visceral fat mass.
Materials and methods
Study population
We cross-sectionally examined baseline data from the MASALA study, a community-based cohort study. A detailed description of the study rationale, design and methods has been described elsewhere(Reference Kanaya, Kandula and Herrington22). Briefly, the community-based sample was recruited between 2010 and 2013 in the greater Chicago area near Northwestern University (NWU) and the San Francisco Bay area at University of California, San Francisco (UCSF) using telephone-based methods, with targeted census tracts from commercial mailing list companies and recruiters bilingual in English and Hindi or Urdu to facilitate communication with limited-English-proficiency participants(Reference Kanaya, Kandula and Herrington22). Adults who self-identified as South Asians with three grandparents or more born in Bangladesh, India, Nepal, Pakistan or Sri Lanka and who were free of CVD were eligible to participate. A total of 3053 individuals were reached, of which 906 participants were enrolled. Participants were middle- to older-aged adults (average 55·3 ± 9·4 years), 47·1 % female and 98 % immigrants to the USA. The protocol was approved by both the NWU and UCSF Institutional Review Boards(Reference Kanaya, Kandula and Herrington22), and the present analyses were approved by the New York University Institutional Review Board.
Data collection
Dietary data
Dietary intake data were collected at baseline between 2010 and 2013 by MASALA study staff using the Study of Health Assessment and Risk in Ethnic (SHARE) groups FFQ, an interviewer-administered 163-item tool validated for use to study the habitual dietary intake of South Asians in North America(Reference Kelemen, Anand and Vuksan23). Total consumption of foods was computed by validated measures from the SHARE research group by assessing frequency of consumption (intake of items per d, per week, per month or per year) and average serving size (cups, tablespoons and ounces) to determine average daily quantity with total energy intake (kJ/d) calculated based on FFQ report by SHARE validated measures(Reference Kelemen, Anand and Vuksan23). A participant was classified as vegetarian if they reported no consumption of meat, poultry or fish on the FFQ in the previous 12-month period. The FFQ queried sources of dairy products, including milk, yogurt, raita (yogurt dip), paneer (cottage cheese) and cheese (Western varieties), which were used to compute a summary variable of total dairy product intake(Reference Kelemen, Anand and Vuksan23).
Body composition measures
The MASALA study personnel measured participant weight using a digital scale and height measured using a stadiometer(Reference Kanaya, Kandula and Herrington22). Waist and hip circumference were measured by study personnel using a flexible tape measure, using standard clinical methods(Reference Kanaya, Kandula and Herrington22). BMI was calculated by dividing weight in kg by height in metres squared. WHR was calculated dividing the waist circumference by the hip circumference.
CT scans of the abdomen were used to calculate abdominal skeletal muscle (abdominal lean mass area) and abdominal subcutaneous, visceral and intermuscular fat areas (Philips Medical Systems; Toshiba Medical Systems; Siemens Medical Solution)(Reference Kanaya, Kandula and Herrington22). A CT technician obtained an image of the abdomen positioned between the L4 and L5 vertebrae. Medical Image Processing, Analysis and Visualization (MIPAV) software(Reference McAuliffe24) was used to measure the fat area at the University of California, San Diego, body composition reading centre. Abdominal subcutaneous fat was defined as tissue outside the visceral cavity and inside the body contour. Four abdominal and back muscle groups (the psoas, paraspinous, oblique and rectus muscles) were summed together to measure intermuscular fat.
Other covariates
Sociodemographic information, including age, sex, percentage of life lived in the USA, educational attainment, annual family income, smoking status and physical activity levels, were assessed by structured interview questions and study questionnaires conducted at the MASALA baseline examination(Reference Kanaya, Kandula and Herrington22). Percentage of life lived in the USA was based on years lived in the USA divided by the participant’s age. The Typical Week’s Physical Activity Questionnaire was used to assess exercise including walking, dance, activities and other sports, calculating total metabolic equivalent min per week and divided based on validated tool measures into ordered categories of low (600 to less than 4000 metabolic equivalent min per week), moderate (4000 to less than 8000 metabolic equivalent min per week) and high (greater than 8000 metabolic equivalent min per week)(Reference Ainsworth, Haskell and Whitt25).
Analytical sample
A total of 906 South Asian adults participated in the MASALA community-based cohort. We excluded participants with missing dietary intake data and those not reporting dairy product intake (n 9) and twelve additional participants who did not meet criteria for daily energy ranges of 3347–10 042 kJ/d for men and 2092–14 644 kJ/d for women(Reference Gadgil, Anderson and Kandula26). A total of 885 participants were included in the dataset for the present analyses (Fig. 1).
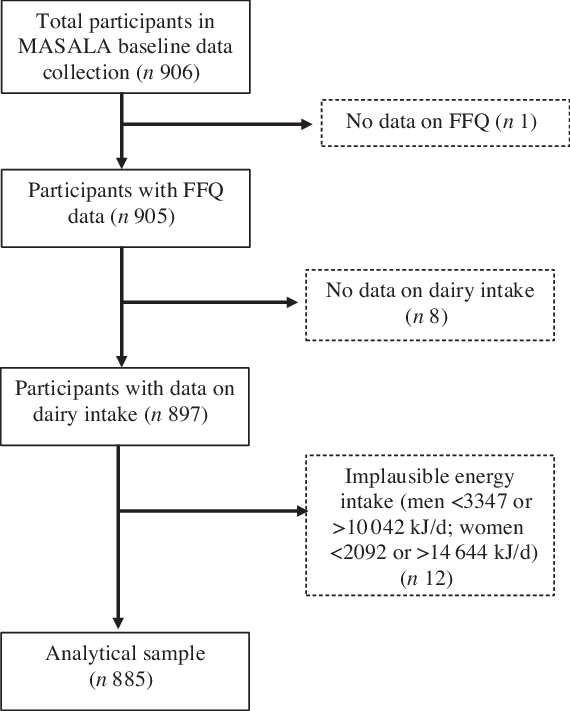
Fig. 1. Creation of the analytical sample using Mediators of Atherosclerosis in South Asians Living in America (MASALA) baseline data, 2010–2020.
Variable definitions
Exposure variables
Using the composite dairy product intake servings per d provided from the FFQ, we categorised daily dairy product consumption into tertiles of intake, using the lowest tertile as the referent group. We additionally analysed dairy food intake from the FFQ responses, computing average servings of milk, yogurt/raita and cheese/paneer based on the respondents reported frequency of consumption (per d, week, month or year/never) and multiplied by average serving in ounces. Items reported as ‘less than average’ were weighted by 0·5, and items reported as ‘more than average’ were weighted by 1·5. Furthermore, the associations of high-fat and low-fat dairy foods and body composition measures were examined in exploratory analyses. Whole-fat and low-fat dairy products were analysed based on median intake. For the purpose of these analyses, the authors did not consider dessert items that may contain dairy products.
Outcome variables
Waist circumference was dichotomised by sex based on cut-off points (<102 cm v. ≥102 cm in men; <88 cm v. ≥88 cm in women), established by the WHO(6). We also dichotomised the waist circumference for men and women based on the International Diabetes Federation criteria for South Asians (<90 cm v. ≥90 cm in men; <80 cm v. ≥80 cm in women). We additionally dichotomised WHR based on the WHO cut-off points for risk of metabolic complications for men and women, separately (<0·9 v. ≥0·9 in men; <0·85 v. ≥0·85 cm in women)(6). BMI, waist circumference, hip girth, WHR, abdominal skeletal mass area, and subcutaneous, visceral, and intermuscular fat areas were assessed as continuous outcomes.
Other covariates
Educational attainment was dichotomised as bachelor’s degree or higher and less than bachelor’s degree. Annual family income was collected categorically as less than $40 000 per year, $40 000–$75 000 per year, $75 000–$100 000 per year and greater than $100 000 per year. Smoking status was assessed as never, former or current smoker. Alcohol intake was categorised based on average consumption per week, including no consumption, one to seven drinks per week and greater than seven drinks per week.
Statistical analyses
Descriptive statistics (means, standard deviations for continuous variables and percentages for discrete variables) for demographic and clinical characteristics of the sample were computed for the whole population by dairy product intake. Trends were reported for body composition measurements, with additional reporting separately for men and women, where appropriate, based on established sex differences in waist circumference and WHR(6). For continuous outcomes, variables were not normally distributed and test of linear trends across tertiles was assessed using ANOVA. For categorical variables, between-group differences were evaluated using Pearson’s χ 2.
We evaluated the associations of dairy product intake and CT skeletal mass and fat area using linear regression, including age-adjusted multiple linear regression models and multivariable models that adjusted for age, sex, education attainment, smoking status, physical activity and vegetarian diet. We similarly evaluated associations of dairy product intake and anthropometric measures, both for linear regression for continuous variables and logistic regression, as appropriate in the whole population and by sex. Models include age-adjusted and multivariable-adjusted. We adjusted the full model for kJ/d using the standard multivariable model for energy adjustment(Reference Hu, Stampfer and Rimm27), which did not change the final model associations. Daily energy intakes were highly correlated (P < 0·05) with dairy product intake and were not included in the final multivariable model. Dietary covariates including animal protein intake, fat intake, egg intake and green leafy vegetable servings per d were tested in the model but not retained during the model selection process.
Finally, we evaluated the associations of dairy product intake (i.e. milk, yogurt and cheese) and body composition measurements with linear regression, age-adjusted models and multivariable-adjusted models. Tests for trends were performed based on the continuous dairy products variable. Variables were singly added and retained in the multivariable model if they changed the relationship between dairy product intake and the body composition outcome by more than 10 %. We used multiple linear regression to generate the β-coefficient, standard error and 95 % CI to examine the relationship between tertiles of dairy product intake and fat measurements performed by CT imaging (visceral, subcutaneous and intermuscular fat measurements). We used logistic regression to generate OR and 95 % CI to examine the association between tertiles of dairy product intake and body composition anthropometric measures(6). We tested for interactions for the relationship between dairy product intake and sex, age group divided at median age (<55 years and ≥55 years), and smoking status with a priori significance set at P < 0·1. There were no significant interactions at each level of dairy product intake. However, we stratified analyses by sex due to consistently documented biological differences of body composition between men and women, based on available international sex-based waist circumference and WHR thresholds(6). Analyses were performed using the statistical software package STATA version 16.1, and all statistical tests were two-sided with significance level set at P < 0·05(28).
Results
Characteristics of study population
Sociodemographic characteristics by tertile of dairy product intake are reported in Table 1. The average age of participants was 55 years (±9·4 years) with approximately 47 % women. The majority of participants held a bachelor’s degree or higher (87·7 %) and had an annual household income greater than $100 000 per year (63·7 %). On average, participants had lived in the USA for about half their lives. Notably, percentage of life lived in the USA was inversely related to tertile of dairy products consumption (P < 0·05). Total dairy product intake ranged from 0·005 to 10·25 servings per d with average intake of 1·67 servings per d. Approximately 38 % of participants were vegetarians, though being vegetarian was not associated with dairy product consumption (P = 0·334).
Table 1. Participant characteristics by tertiles of dairy product consumption, among South Asian adults aged 40–83 years in the Mediators of Atherosclerosis in South Asians Living in America study, 2010–2013 (n 885)
(Mean values and standard deviations)
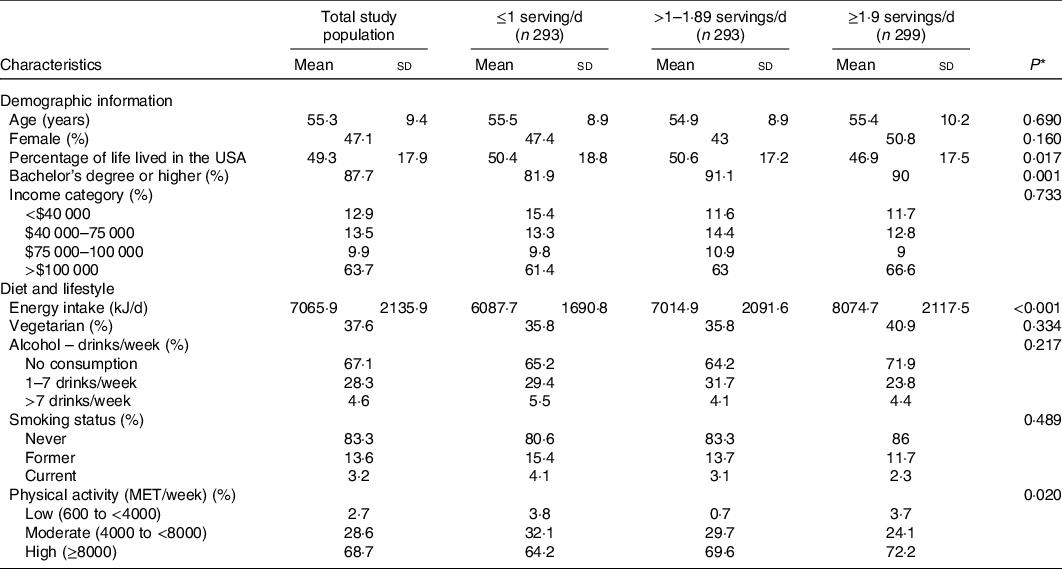
* P values were estimated by ANOVA for continuous variables and Pearson’s χ 2 for categorical variables.
Characteristics of body composition measurements
We examined the associations between tertile of average servings per d of dairy product intake and anthropometric measures reported both as a continuous outcome and categorically stratified by sex-based thresholds (Table 2). While WHR was associated with dairy product intake as a continuous variable (P < 0·05) for the overall cohort, the association disappeared when dichotomised by sex. There was no significant difference in BMI among participants across tertiles of dairy product intake (P = 0·488), nor was there a significant relationship between dairy product intake and overall waist circumference (P = 0·101), hip girth (P = 0·897), subcutaneous fat area (P = 0·760), visceral fat area (P = 0·527) and intermuscular fat area (P = 0·848).
Table 2. Descriptive body composition distribution by tertiles of dairy product consumption, among South Asian adults aged 40–83 years in the Mediators of Atherosclerosis in South Asians Living in America study, 2010–2013 (n 885)
(Mean values and standard deviations)
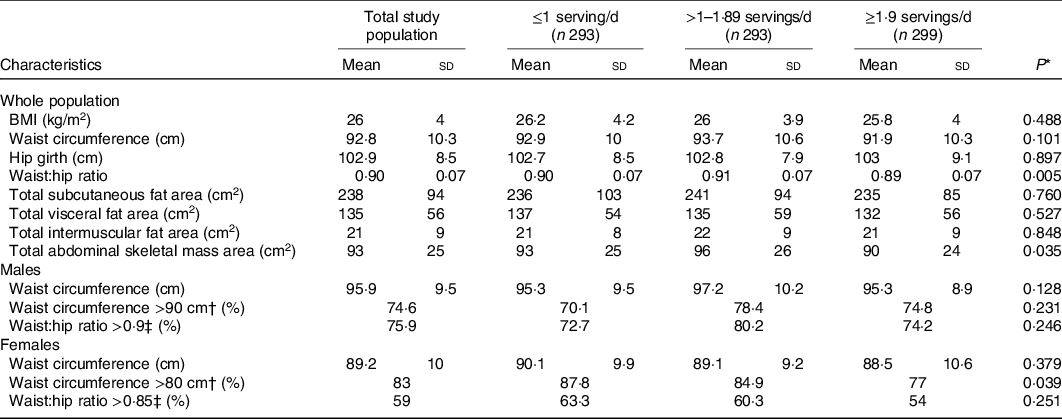
* P values were estimated by ANOVA for continuous variables and Pearson’s χ 2 for categorical variables.
† International Diabetes Federation criteria for South Asian values for waist circumference.
‡ WHO cut-off points and risk of metabolic complications.
Association between dairy product intake and waist circumference
Given biological differences for body fat distribution by sex(6), associations for waist circumference and WHR were examined by total population and subgroups of sex in Table 3. Men had an average intake of 1·6 servings of dairy products per d (±1·2) and women had an average intake of 1·7 servings of dairy products per d (±1·3). There was not a significant difference in average daily intake of dairy products between men and women (P = 0·210). There was no association between total dairy product intake and waist circumference cut-off threshold (P = 0·370) or WHR cut-off threshold (P = 0·126) in the whole population. Among men, there was a significant association between dairy product intake and both waist circumference and WHR, but the overall relationship was not significant (P for trend = 0·451 and P for trend = 0·674, respectively). For women, we observed a protective relationship between the highest tertile of dairy product intake and waist circumference (95 % CI 0·25, 0·89, P for trend < 0·05). Compared with those who consumed less than one serving of dairy products per d, women who consumed greater than 1·9 servings of dairy products per d had a 53 % lower odds of having a waist circumference greater than 80 cm, after controlling for age, percentage of life lived in the USA, educational attainment, smoking status, physical activity and vegetarian diet.
Table 3. Age-adjusted and multivariable-adjusted analyses of the association between tertiles of dietary intake (servings/d) and indicators of body composition by whole population and by sex, among South Asian adults aged 40–83 years in the Mediators of Atherosclerosis in South Asians Living in America study, 2010–2013 (n 885)
(Odds ratios and 95 % confidence intervals)
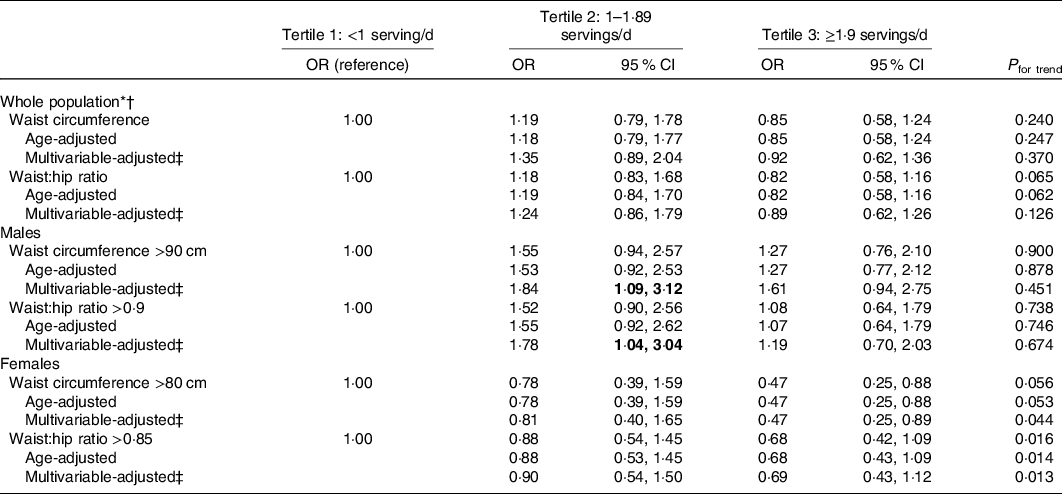
* Waist circumference greater than recommended threshold as per International Diabetes Federation criteria for South Asian values (>90 cm for men, >80 cm for women).
† Waist:hip ratio greater than recommended threshold as per WHO cut-off points and risk of metabolic complications (>0·9 for men, >0·85 for women).
‡ Adjusted for age (years), percentage of life lived in the USA, educational attainment (less than bachelor’s degree, bachelor’s degree or higher), smoking status (never, former and current), physical activity (low, medium and high) and vegetarian diet (lacto-ovo vegetarian, yes/no).
Dairy products and anthropometric measures
As presented in Table 4, greater than one serving per d of yogurt or raita was associated with a 0·01 unit lower WHR when compared with participants who reported three or fewer servings per week (P for trend < 0·05) after controlling for age, sex, percentage of life lived in the USA, educational attainment, smoking status, physical activity and vegetarian diet. No associations were observed for yogurt or raita intake and other body composition measurements. No associations were found between milk product consumption and body composition measurements, nor between cheese consumption and body composition measurements. Similarly, no associations were found when assessing fat content of milk and cheese products (whole fat and low fat) and BMI, waist circumference, hip girth, WHR, and abdominal skeletal mass area, subcutaneous, visceral, and intermuscular fat area (Supplementary Table 1).
Table 4. Multivariable analyses of the association between type of dairy product intake (servings/d) and anthropometric measurements among South Asian adults aged 40–83 years in the Mediators of Atherosclerosis in South Asians Living in America study, 2010–2013*
(β Coefficients, standard errors and 95 % confidence intervals)
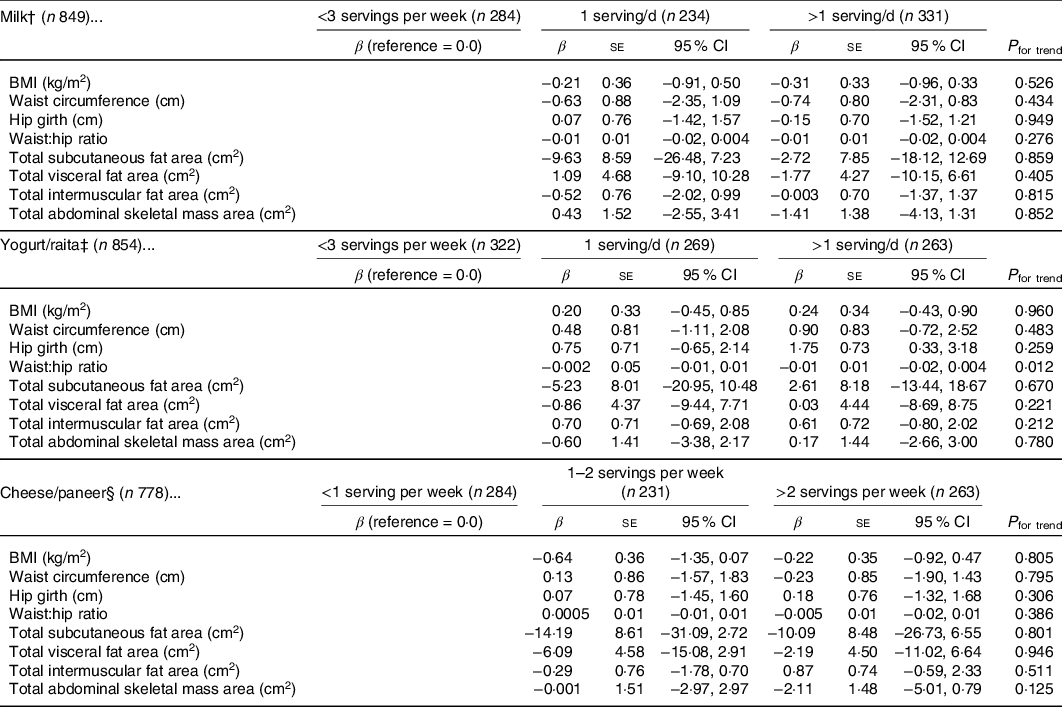
* Adjusted for age (years), percentage of life lived in the USA, educational attainment (less than bachelor’s degree, bachelor’s degree or higher), smoking status (never, former and current), physical activity (low, medium and high) and vegetarian diet (lacto-ovo vegetarian, yes/no).
† One serving of milk is equal to eight ounces of whole-fat, low-fat or non-fat milk.
‡ One serving of yogurt is equal to eight ounces of a yogurt drink, six ounces of full-fat, low-fat, or fruit-flavoured yogurt, or four ounces of raita.
§ One serving of cheese is equal to a one ounce slice of full-fat or low-fat cheese or four ounces of paneer or ricotta.
Greater than three servings per week of low-fat yogurt was associated with a 9·9 cm2 reduction in visceral fat area (95 % CI −19·07, 10·72, P < 0·05) and a 2·3 cm2 reduction in intermuscular fat area (95 % CI −3·76, −0·79, P < 0·05) compared with those consuming three or fewer servings of low-fat yogurt per week, after controlling for age, sex, percentage of life lived in the USA, educational attainment, smoking status, physical activity and vegetarian diet. There were no associations between whole-fat yogurt and visceral fat area (P = 0·448) or intermuscular fat area (P = 0·461).
Discussion
In this cohort of middle- to older-aged South Asians living in the USA, greater than 1·9 servings of dairy products per d was associated with waist circumference of 80 cm or less among women. We also observed that intakes of greater than three servings of low-fat yogurt per week were associated with lower visceral and intermuscular fat area. Associations were not observed for the dairy products combined (milk, yogurt and cheese), whole-fat yogurt, or for whole- or low-fat milk and cheese and body composition.
The results of the present study are consistent with two previous meta-analyses(Reference Schwingshackl, Hoffmann and Schwedhelm20,Reference Geng, Qi and Huang21) . A meta-analysis of twenty-two cohort studies examining dairy product consumption and anthropometric measures of body adiposity found that the highest dairy product intake category was associated with a reduced risk of abdominal obesity(Reference Schwingshackl, Hoffmann and Schwedhelm20). Similarly, a meta-analysis of thirty-seven randomised control trials studying the effect of dairy product intake on body weight and composition found that increased dairy product consumption was associated with decreases in body weight, body fat and waist circumference(Reference Geng, Qi and Huang21). Furthermore, a cross-sectional study of Korean adults (n 13 692) found that higher intake of dairy products was associated with reduced prevalence of obesity (defined by BMI) among women, but not in men(Reference Lee and Cho29). A previous longitudinal study observed that males with high dairy product intake were at lower risk for central obesity at the end of a 12-year follow-up period(Reference Holmberg and Thelin30). A review of prospective cohort studies also noted similar findings among men(Reference Louie, Flood and Hector17). This previous research supports our finding of sex-specific differences in body composition outcomes.
Our findings may be explained by multiple possible mechanisms that underpin the dairy products and body composition connection. Dairy products are considered a rich source of protein, which helps promote lean body mass(Reference Trichia, Imamura and Brage31); low-fat and full-fat dairy products contain dietary fat, which can increase satiety(Reference Hirahatake, Astrup and Hill32) to help mitigate energy over-consumption(Reference Abargouei, Janghorbani and Salehi-Marzijarani16) and supports the absorption of fat-soluble essential vitamins(Reference Dawson-Hughes, Harris and Lichtenstein33); and the carbohydrate from dairy products provide a modest amount of natural sugar that cells metabolise(Reference Grom, Rocha and Balthazar34) and is hypothesised to support the fermentation process for healthy gut microbiota(Reference Ohlsson, Johansson and Hansson35). To this end, a recent longitudinal study found that fermented dairy products help to reduce central weight gain(Reference Trichia, Luben and Khaw36), which is further supported by a randomised controlled trial finding probiotic yogurt decreased body fat percentage in overweight and obese adults(Reference Zarrati, Salehi and Nourijelyani37), possibly explained through reduced energy effects from macronutrients and influence of gastrointestinal hormones(Reference Borgeraas, Johnson and Skattebu38). Moreover, fermented or cultured dairy products, such as yogurt, contain probiotic bacterial cultures(Reference Aryana and Olson39) that are hypothesised to lower the production of trimethylamine-N-oxide(Reference Burton, Kruger and Scherz40), a metabolite that is an early predictor of the metabolic syndrome, implicated as a cause of atherosclerosis and CVD(Reference Barrea, Annunziata and Muscogiuri41). The healthier waist circumference observed in older women is supported by previous research that documents how middle- to older-aged women derive greater benefit from dairy product intake that may help to mitigate muscle wasting and weight redistribution related to changes in hormones(Reference Ilich, Kelly and Liu42). Previous research has hypothesised the role of Ca in body composition and insulin resistance(Reference Shalileh, Shidfar and Haghani43). However, there may be several other mechanisms contributing to sex differences that are not fully understood(Reference Chan, Chooi and Ding44).
The results of the study must be interpreted in light of some limitations. One limitation is that the data are susceptible to information bias as dietary intake is self-reported and participants may over- or under-report dietary habits due to informed interest to include more or less of certain food groups, which is a known limitation of FFQ in general(Reference Subar, Kushi and Lerman45,Reference Kirkpatrick, Baranowski and Subar46) . Further, the FFQ did not query processing level of dairy products or proportion of added sugar, which are established risks for increased obesity and CVD(Reference Srour, Fezeu and Kesse-Guyot47). Additionally, only participants weighing less than 300 pounds were included in the study cohort due to weight restrictions of the CT machine(Reference Kanaya, Kandula and Herrington22). However, this was not a significant limitation as the data captured a range of BMI from 15·9 (underweight) to 47·7 (class III obesity). Both limitations risk biasing the results towards the null. Another limitation of the present analyses is the cross-sectional nature of the baseline data used. It is well recognised that body composition changes with age due to loss of muscle mass and increased fat mass(Reference Al-Sofiani, Ganji and Kalyani48). Therefore, planned follow-up waves of data collection that are currently underway in the MASALA study sample(Reference Kanaya, Kandula and Herrington22,Reference Kanaya, Chang and Schembri49) will facilitate longitudinal analyses and allow use to decipher possible age-related body composition changes. The MASALA cohort is comprised of middle- to older-aged adult participants with high educational attainment and income levels that may limit the generalisability to South Asians who have less educational attainment, have lower income or are younger(50).
The MASALA study has several strengths. It is the first multi-centre community cohort to study South Asians living in the USA, incorporating culturally competent practices in their recruitment and data collection(Reference Kanaya, Kandula and Herrington22,Reference Kanaya, Chang and Schembri49) . South Asians remain underrepresented in large epidemiological studies(Reference Ardeshna, Bob-Manuel and Nanda2) and are often inappropriately aggregated in heterogeneous subgroups, a key factor identified in the misrepresentation of South Asian disease risk profile, as acknowledged by the American Heart Association(Reference Volgman, Palaniappan and Aggarwal3). The data were collected by trained personnel through in-person interviews during the study visits. The data are unique in their inclusion of CT imaging, a nuanced measure of body adiposity that enhances data accuracy and minimises measurement error, providing specific information on fat area distribution that are associated with disease risks(Reference Matsuzawa, Shimomura and Nakamura7,Reference Mongraw-Chaffin, Kanaya and Kandula51) . Moreover, the FFQ, validated against a 7-d food record, was specifically developed for South Asian adults living in North America, which allowed us to perform nuanced analyses of dairy product intake(Reference Kelemen, Anand and Vuksan23). The FFQ additionally queried various yogurt products, which enabled us to indirectly assess fermented dairy food intake, which is hypothesised to play a role in body composition(Reference Trichia, Luben and Khaw36,Reference Borgeraas, Johnson and Skattebu38) .
The present study has important practice and public health implications. Our findings that daily servings of dairy product intake are associated with body composition measures are consistent with reduced disease risk. This aligns with the position of the Academy of Nutrition and Dietetics that recommends inclusion of dairy products in dietary pattern-based changes for control of excess adiposity(Reference Raynor and Champagne52). Furthermore, the US 2015–2020 dietary guidelines recommend incorporation of moderate quantities of dairy products as part of a healthy diet(53).
Our study has important clinical and public health implications. Researchers should continue to study alternative measures of body composition to assess central obesity, rather than exclusively rely on BMI(Reference Araneta, Kanaya and Hsu11). Currently, waist circumference is seldom examined and not utilised appropriately in clinical settings for assessing disease risk(Reference Gaynor, Habermann and Wright54), despite the validation of waist circumference as a reliable measure of obesity and better indicator of disease risk than BMI(Reference Schulze, Heidemann and Schienkiewitz55). Our findings suggest the re-assessment of currently used anthropometric measures in a clinical setting, which would better identify individuals experiencing the Asian Paradox. Similarly, the present analyses utilise CT imaging that are typically not feasible to use in large cohort studies. This imaging provides more reliable estimates quantifying the associations of dairy product intake and body composition. Finally, South Asians remain underrepresented in large research studies(Reference Ardeshna, Bob-Manuel and Nanda2). Clinicians are increasingly seeking evidence-based clinical guidelines that are culturally competent for population subgroups in the USA(Reference McCabe, O’Brien-Combs and Anderson56), and South Asians are specifically noted by the American Heart Association as one such subgroup suffering from unique disease risk factors, warranting tailored research efforts(Reference Volgman, Palaniappan and Aggarwal3). The MASALA study provides for this growing demand in research, with planned longitudinal study that will enable investigation of the temporal associations between dairy product intake and multidimensional measures of body composition, which are warranted in an ageing population to confirm these findings.
Conclusion
The present analysis suggests that, among South Asians in the USA, higher consumption of low-fat yogurt is associated with lower visceral and intermuscular fat area for the whole study population, and women with higher dairy product intake had lower waist circumference. The present study uniquely provides evidence about the growing South Asian population in the USA and adds to the accrual of research that supports the establishment of comprehensive body composition measures that are better able to identify individuals at risk for non-communicable disease.
Acknowledgements
The MASALA cohort study project described was supported by Grant Number R01HL093009 from the National Heart, Lung, and Blood Institute and the National Center for Research Resources and the National Center for Advancing Translational Sciences, National Institutes of Health, through UCSF-CTSI Grant Number UL1 RR024131. Body composition measures in MASALA were supported by grant K24 HL112827. The content is solely the responsibility of the authors and does not necessarily represent the official views of the National Heart, Lung, and Blood Institute or the National Institutes of Health. The authors thank the other investigators, the staff and the participants of the MASALA study for their valuable contributions.
There was no financial support for this secondary data analysis.
B. M. conceptualised the statistical analyses within the existing data set, performed the statistical analyses, and took the lead in writing the manuscript. S. A. T. and J. O. provided substantial intellectual contributions to the manuscript content. N. R. K. and A. M. K. designed the survey and data collection strategy and have oversight of the MASALA study. M. A. A. supervised the collection of the body composition data from the computed tomography scans in the collection of the data and assisted in outcome variable selection and interpretation. N. P. supervised the manuscript and analysis development.
The authors have no conflicts of interest to declare.


