


The number of older adults has increased substantially in recent years in most countries, and this growth is projected to accelerate in the coming decades: by 2050, the world’s population aged 60 years and older is expected to total 2 billion, up from 900 million in 2015(1,2) . The WHO defines healthy ageing as the process of developing and maintaining the functional ability that enables well-being in older age(2). Lifestyle behaviours have been shown to prevent functional decline in old age(2–Reference Tak, Kuiper and Chorus4). Specifically, the Mediterranean diet and other healthy dietary patterns, with high intake of vegetables, fruits and nuts, and low intake of red and processed meats, have been linked to lower functional impairment in the older general population(Reference Arias-Fernández, Machado-Fragua and Graciani5–Reference Struijk, Guallar-Castillon and Rodriguez-Artalejo8). Moreover, an adequate intake of protein and vitamins seems to be essential for delaying the age-associated decline in physical function(Reference Sandoval-Insausti, Perez-Tasigchana and Lopez-Garcia9–Reference Balboa-Castillo, Struijk and Lopez-Garcia11).
Legumes are rich in protein and fibre, low in saturated fat and Na, and are part of the traditional Mediterranean diet. However, their role on unhealthy ageing is still uncertain. Legumes could contribute to reducing functional decline by delaying the onset and severity of several diseases(Reference Polak, Phillips and Campbell12), in particular, type 2 diabetes(Reference Becerra-Tomas, Diaz-López and Rosique-Esteban13) and cancer mortality(Reference Papandreou, Becerra-Tomas and Bullo14) in older adults. However, in one of these studies(Reference Papandreou, Becerra-Tomas and Bullo14), dry beans were also linked to a higher risk of cardiovascular death. Moreover, traditional legume recipes include stews with substantial amounts of processed meat, salt and potatoes (e.g. ‘chickpea-based stew’, ‘beans with sausage’ and ‘lentils with sausage’) (Fig. 1), which could counteract the potential benefits of legumes. Finally, it is unclear whether different types of legumes (e.g. beans, lentils and chickpeas) might have different health effects. Accordingly, this study assessed the longitudinal association of consumption of different types of legumes, and traditional legume-based recipes, with unhealthy ageing in older adults.

Fig. 1. Pictures of some traditional legume-based recipes. From the left to the right: chickpea-based stew, beans with sausage and lentils with sausage.
Experimental methods
Study design
Data were taken from the Seniors-ENRICA study, a prospective cohort of individuals aged 60 years or older at baseline, whose methods have been reported elsewhere(Reference León-Muñoz, Garcia-Esquinas and Lopez-Garcia15,Reference Rodriguez-Artalejo, Graciani and Guallar-Castillon16) . Study participants were recruited during the period 2008–2010, and the information was collected in three stages: first, by telephone interview on lifestyles, health status, diagnosed morbidity and health services use; second, by a household visit to obtain blood and urine samples and to perform a physical examination; and third, by a subsequent household visit to collect a computerised diet history and other questionnaire data. Three waves of data collection have been conducted in 2013, 2015 and 2017 to update the information of the cohort. The response rate at baseline was 51·0 %(Reference Rodriguez-Artalejo, Graciani and Guallar-Castillon16), while response rates at follow-up waves were 76·6 % in 2013, 72·2 % in 2015 and 62·1 % in 2017. Study participants gave their written informed consent. The Clinical Research Ethics Committee of ‘La Paz’ University Hospital in Madrid approved the study protocol.
Study variables
A validated computerised face-to-face diet history was used to obtain food consumption. This instrument, DH-ENRICA, was developed from the diet history used in the EPIC cohort in Spain(Reference Guallar-Castillon, Sagardui-Villamor and Balboa-Castillo17). Study participants reported their habitual consumption of foods and traditional legume-based recipes (e.g. chickpea-based stew, lentils with sausage and beans with sausage) during a typical week of the previous year (those consumed at least once every 15 d were recorded) (Fig. 1). Specifically, the DH-ENRICA collects standardised information on 861 foods cooked in twenty-nine different ways, using 122 household measures, and incorporates 127 sets of photographs to assess portion size. A total of twenty-two types of legume were categorised in four groups: (1) fresh legumes, including frozen peas, canned peas, boiled peas and lima beans; (2) dry legumes, including navy beans, canned navy beans, black beans, chickpeas, canned chickpeas, fava beans, lentils, canned lentils, soya beans, kidney beans, canned kidney beans, canned fabada stew, lupin beans and toasted chickpeas; (3) soya-based products, including soya shake, tofu, soya milk and soya bean flour and (4) not specified legumes. Total protein intake (including animal and vegetable protein) was also estimated for each participant using standard food composition tables.
The validity of the DH-ENRICA has been assessed against seven 24-h recalls over 1 year. Energy-adjusted Pearson’s correlation coefficients ranged between 0·27 and 0·71 across food groups and nutrients; a moderate correlation was found for legume intake (r 0·35), which is in line with most of the instruments for measuring self-reported diet in population studies(Reference Yuan, Spiegelman and Rimm18). Regarding the reliability of this diet history, the intraclass correlation coefficient between two DH-ENRICA assessments was >0·40 for most foods and nutrients(Reference Guallar-Castillon, Sagardui-Villamor and Balboa-Castillo17).
Unhealthy ageing was assessed with a health deficit accumulation index (DAI) that includes fifty-two items representing deficits in the following four domains: physical and cognitive function (twenty-two items), self-reported health and vitality (seven items), mental health (six items) and morbidities and use of health services (seventeen items). Most deficits in the DAI were assessed dichotomously (0 points for no deficit and 1 point for any degree of the deficit), except for cognitive function, self-rated health, vitality, mental health, BMI and use of outpatient health care, which were scored according to severity (0 points for no deficit, 0·25 to 0·75 points for mild-to-moderate deficit and 1 point for severe deficit). The overall DAI score was calculated as the total sum of points assigned to each health deficit divided by the number of deficits considered, and further multiplied by 100 to obtain a range from 0 to 100; a higher score indicates worse health. A detailed description of this index has been reported previously(Reference Rodríguez-Sánchez, García-Esquinas and Mesas19,Reference García-Esquinas, Ortolá and Prina20) .
Other variables were measured and considered as potential confounders. Specifically, participants reported their sex, age, highest level of education achieved (primary education or less, secondary school and university), population centre size (categorised as <10 000; 10 000–100 000; 100 000–500 000; >500 000 inhabitants, according to the size of the population centre where they live), smoking status (current smoker, never smoker and former smoker) and alcohol drinking (g/d). The fourteen-item Mediterranean Diet Adherence Screener was used to assess adherence to the Mediterranean diet. This tool comprises twelve questions on food consumption frequency and two additional questions on food intake habits characteristic of the Mediterranean diet(Reference Martinez-Gonzalez, Corella and Salas-Salvadó21,Reference Schröder, Fitó and Estruch22) . The item on consumption of legumes was excluded from the Mediterranean Diet Adherence Screener calculation, so that the score ranged between 0 and 13, with higher scores indicating higher adherence to the Mediterranean diet. Sedentary behaviour was estimated by the reported time (h/week) spent watching television, which has been shown to be a good proxy for sedentarism(Reference Hsieh, Hilgenkamp and Murthy23). Weight and height were measured in standardised conditions, and the BMI was calculated as weight (kg) divided by squared height (m).
Statistical analysis
At baseline, a total of 11 991 subjects comprised a representative sample of the non-institutionalised Spanish population aged 18 years and older(Reference Rodriguez-Artalejo, Graciani and Guallar-Castillon16). Then the Seniors-ENRICA cohort, composed by those older than 60 years (n 3518), was followed up in subsequent waves. Participants with energy intake values outside the range of 3347–20 920 kJ/d for men (n 103) and 2092–16 736 kJ/d for women (n 122), as well as those without data on legumes consumption (n 8), were excluded from the analysis. From these 3285 subjects older than 60 years which were interviewed at baseline, a total of 2505 participated in some of the follow-up waves and comprised the sample considered for analysis in the present research. For the regression models described below and considering different lengths of follow-up, the number of participants varied, depending on the participation in the ENRICA phases conducted in 2013, 2015 and 2017. Thus, the number of participants considered in the follow-up periods was 2435 in the 3-year follow-up period, 1775 in the 5-year follow-up period and 1105 in the largest follow-up period, corresponding to 7 years.
We assessed differences in socio-demographic variables between the 780 subjects who participated only at baseline and those 2505 participating in at least one of the follow-up waves; mean age was higher in those interviewed only at baseline (70·4 v. 68·7 years; P < 0·001) and educational level was lower (33·1 v. 45·5 % had at least secondary education; P < 0·001). No significant differences were observed by sex or population centre size.
Legume consumption was described, providing mean and median values in each item. All the types of legume assessed are included in Table 1, showing also total consumption on legumes and legume subgroups. Characteristics of participants at baseline were examined according to tertiles of legume consumption, and differences were tested with an ANOVA or the χ 2 test, using these tests for continuous and categorical variables, respectively.
Table 1. Baseline consumption of legumes (g/d) among the study participants (n 2505)
(Mean values and standard deviations; minimum (Min) and maximum (Max) values; median values and first and third quartiles (Q) of distribution; percentages)

* Mean values refer to the full sample considered in this study for analysis (n 2505). Soya bean flour consumption was not reported by any participant of the sample interviewed and was not included in the table.
The total consumption of legumes (g/d) was transformed into a three-category variable reflecting the tertiles of the distribution, trying to identify a high, middle and low legume intake. The association between tertiles of total consumption of legumes and unhealthy ageing was assessed by means of multivariable-adjusted linear regression models, which considered different lengths of follow-up (3-year, 5-year and 7-year periods). The DAI at the end of the follow-up period was the dependent variable, and models were always adjusted for the DAI score at baseline. Analyses also sequentially adjusted for potential confounders. Model 1 was adjusted for age, sex, level of education and population centre size; model 2 additionally adjusted for health behaviours, including tobacco, alcohol intake, Mediterranean Diet Adherence Screener score, energy intake, time watching television and BMI; and model 3 further adjusted for the consumption of processed meat (g/d). An additional analysis was conducted considering the average of the consumption of legumes in 2010 and 2013 (cumulative consumption) as independent variable and the unhealthy ageing score in 2015 and 2017 as dependent variable in both cases, adjusting for all covariates abovementioned.
The study associations were summarised with non-standardised β-coefficients and their 95 % CI; also, the dose–response relationship was tested with a P value for linear trend, obtained by modelling the different legume intake categories as a continuous variable. Sex and age interaction terms were used, for each follow-up period considered, to test whether the study association varied between men and women, or with age, since the process of ageing is different in each sex, and because men and the younger participants showed higher legume consumption.
To test if legume consumption could be more beneficial in those with a low protein intake, analyses were also stratified by protein intake using the median as cut-off point. Protein intake was energy-adjusted by the residual method(Reference Willet24). This analysis was conducted using protein intake given in g/d, but an additional sensitivity analysis was conducted using the percentage of protein intake over the total energy intake and stratifying by the median value of this percentage.
Finally, several analyses were run for different types of legumes (beans, chickpeas and lentils) and for traditional legume-based recipes (chickpea-based stew, lentils with sausage and beans with sausage). Beans included the following types of beans: navy beans, canned navy beans, black beans, kidney beans, canned kidney beans and canned fabada stew; chickpeas included also canned chickpeas and toasted chickpeas, while lentils included also canned lentils. Given the small amount consumed of some specific legumes and recipes, dichotomous variables were used for these analyses (consumption v. no consumption).
Multivariable-adjusted linear regression models described above employed the ordinary least squares estimation, which is robust to deviations from normality in large samples(Reference Lumley, Diehr and Emerson25). Heteroscedasticity was assessed by means of the Breusch-Pagan/Cook-Weisberg test, using the correction for dropping the normality assumption(Reference Breusch and Pagan26,Reference Cook and Weisberg27) . The presence of multicollinearity in the models was assessed by means of the variance inflation factor, with values below 10 being considered adequate according to the literature(Reference Hair, Anderson and Tatham28). In general terms, the Breusch-Pagan/Cook-Weisberg test suggested that the error terms associated with the models considered were homoscedastic, while the highest mean variance inflation factor value found was 1·56.
Statistical analyses were conducted using Stata 15(29).
Results
The mean age of the participants in the study was 68·7 years, with a standard deviation of 6·4. 53·1 % of them were women, and 45·5 % of the participants had secondary education or a higher educational level. Table 1 shows the consumption of legumes at baseline. Only 21·6 % of participants did not consume dry legumes. The mean total consumption of legumes was 57·9 (sd 63·2) g/d in the full sample comprising 2505 participants, and the highest intake was reported for lentils, with a mean of 16·9 (sd18·4) g/d. Other dry legumes highly reported were chickpeas, with a mean consumption of 8·5 (sd16·6) g/d, and navy beans, with a mean consumption of 7·2 (sd14·8) g/d. Median values in the distribution for lentils and total consumption of legumes were 18·9 and 41·0 g/d, respectively.
Consumption of legumes was higher in men (P < 0·001), younger participants (P = 0·027) and current or former smokers (P = 0·002), while living in big cities was associated with a lower intake (P = 0·002) (Table 2). Significant differences in the Mediterranean Diet Adherence Screener score were not found across tertiles of legume consumption (P = 0·68). Also, legume consumption was associated with higher energy and protein intake (P < 0·001).
Table 2. Baseline characteristics of study participants according to tertiles of legume consumption (n 2505)
(Mean values and standard deviations; numbers and percentages)
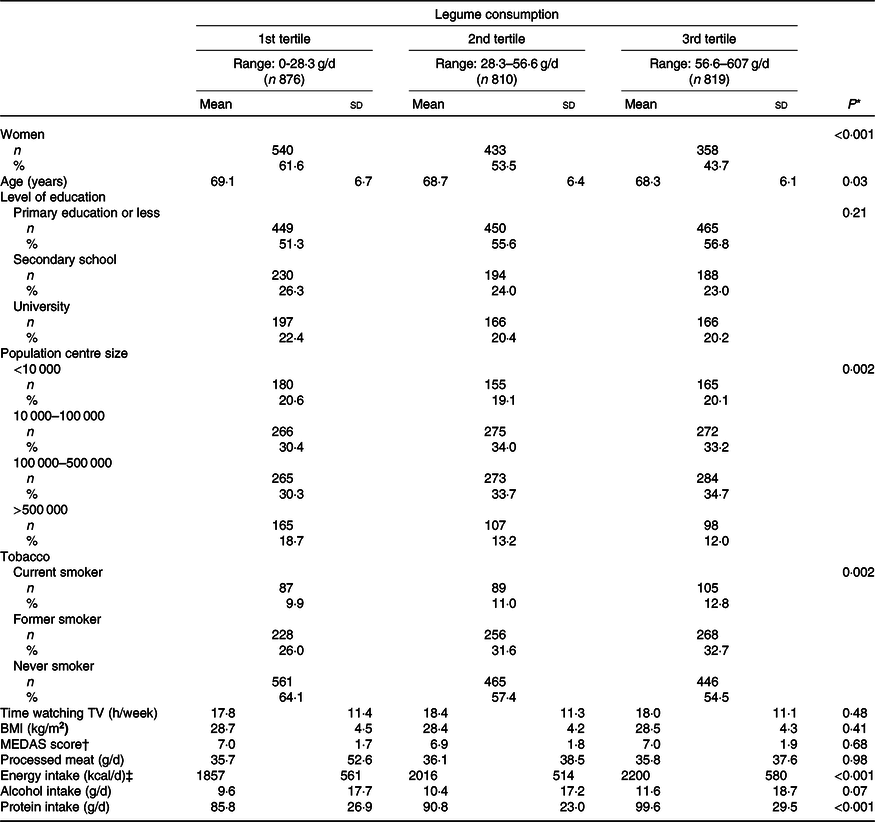
TV, television; MEDAS, Mediterranean Diet Adherence Screener.
* P values were obtained from ANOVA for continuous variables and the χ 2 test for categorical ones.
† MEDAS score, ranging between 0 and 13, was calculated excluding the item on legume consumption.
‡ To convert kcal to kJ, multiply by 4·184.
No association was found between total consumption of legumes and the DAI score (Table 3). Specifically, in the fully adjusted analyses and compared with those in the lowest tertile of legume intake, the non-standardised coefficients associated with the second and highest tertile of legume consumption in the 7-year follow-up were 0·94 (95 % CI −0·30, 2·17) and 0·18 (95 % CI −1·07, 1·43), respectively. When modelling the three-category variable as a continuous one, a similar non-significant trend was observed in the 7-year follow-up period (non-standardised coefficient = 0·11 (95 % CI, −0·53, 0·76); P trend = 0·73). Similar non-significant results were observed for the 3-year and 5-year follow-up periods. Results did not vary by sex or age (P values for interaction >0·05 in both cases).
Table 3. Multivariable-adjusted linear regression assessing the association between legume consumption and the score on the deficit accumulation index (DAI)*
(Non-standardised coefficients and 95 % confidence intervals)
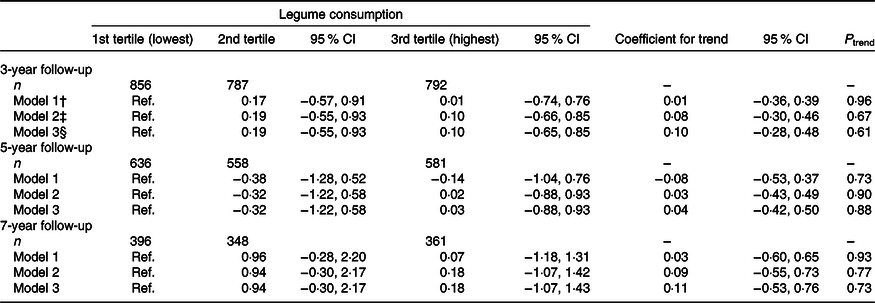
Ref., reference; MEDAS, Mediterranean Diet Adherence Screener.
* Coefficients for trend and P trend associated were calculated after considering the three-category variable for legume consumption as a continuous one in the model.
† Model 1 was adjusted for age, sex, level of education (primary education or less, secondary school and university), population centre size (<10 000; 10 000–100 000; 100 000–500 000; >500 000 inhabitants in the population centre where the participant lives) and DAI at baseline, with DAI scores ranging from 0 (best) to 100.
‡ Model 2 was adjusted also for tobacco consumption (current smoker, never smoker and former smoker), time watching television (continuous h/week), BMI (continuous kg/m2), MEDAS score (without the legume consumption item), energy (kcal/d) and alcohol intake (g/d) at baseline.
§ Model 3 was adjusted also for processed meat consumption (g/d). In the MEDAS score used in this model, the item about red and processed meat consumption was also excluded from the overall score.
When using cumulative consumption of legumes in 2010 and 2013 waves, the results found were similar (online Supplementary Table S1). The non-standardised coefficients associated with the second and highest tertiles were 0·88 (95 % CI −0·37, 2·12) and 0·33 (95 % CI −0·99, 1·65), respectively, when comparing with the lowest one (reference category) in the final adjusted model for the 7-year follow-up period.
The median value for the total protein intake at baseline was found to be 88·9 g/d. Table 4 shows analyses stratified by keeping below/above this value. With the exception of a slightly higher DAI among those in the second tertile of legume consumption and above the median protein intake during a 7-year follow-up (non-standardised coefficient = 1·77 (95 % CI 0·02, 3·52); P = 0·047), no association was found between legume consumption and the DAI score. When considering the percentage of protein intake over the total energy intake and stratifying by the median value (18·2 %), we obtained similar results. The associations of specific types of legumes and traditional legume-based recipes with the DAI were also assessed. Of note is that, at baseline, 31·1 % of participants habitually consumed lentils with sausage, 23·7 % chickpea-based stew and 13·4 % beans with sausage. For a 7-year follow-up, β-coefficients for the studied associations were usually very small and not statistically significant (Table 5).
Table 4. Multivariable-adjusted linear regression assessing the association between legume consumption and score on the deficit accumulation index (DAI), by total protein intake†
(Non-standardised coefficients and 95 % confidence intervals)
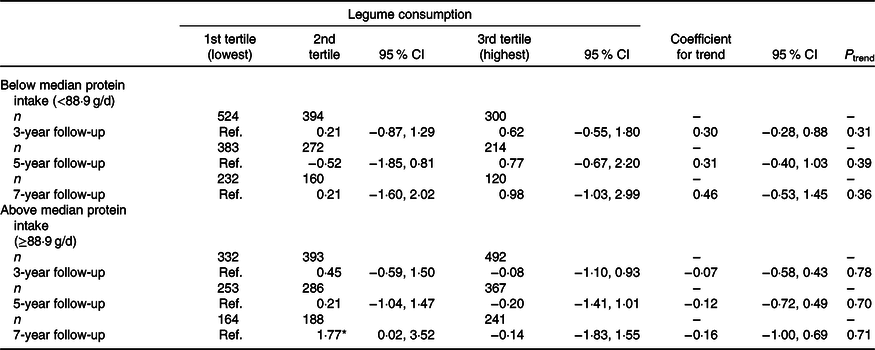
Ref., reference; MEDAS, Mediterranean Diet Adherence Screener.
* P < 0·05; coefficients for trend and P trend associated were calculated after considering the three-category variable for legume consumption as a continuous one in the model.
† Linear regression models in each group based on the protein intake were adjusted for age, sex, level of education (primary education or less, secondary school and university), population centre size (<10 000; 10 000–100 000; 100 000–500 000; >500 000 inhabitants in the population centre where the participant lives), tobacco consumption (current smoker, never smoker and former smoker), time watching television (continuous h/week), BMI (continuous kg/m2), MEDAS score (without the legume consumption item), energy (kcal/d), alcohol intake (g/d), processed meat consumption (g/d) and DAI at baseline, with DAI scores ranging from 0 (best) to 100.
Table 5. Multivariable-adjusted linear regression assessing the association between consumption of different types of legumes and traditional legume-based recipes and score on the deficit accumulation index (DAI)*
(Non-standardised coefficients and 95 % confidence intervals)
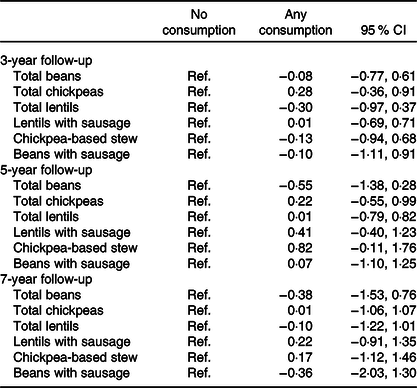
Ref., reference; MEDAS, Mediterranean Diet Adherence Screener.
* All models were adjusted for age, sex, level of education (primary education or less, secondary school and university), population centre size (<10 000; 10 000–100 000; 100 000–500 000; >500 000 inhabitants in the population centre where the participant lives), tobacco consumption (current smoker, never smoker and former smoker), time watching television (continuous h/week), BMI (continuous kg/m2), MEDAS score (without the legume consumption item), energy (kcal/d), alcohol intake (g/d), processed meat consumption (g/d) and DAI at baseline, with DAI scores ranging from 0 (best) to 100. Models for consumption of one of the three types of legumes in this table were also adjusted for the consumption of the remaining two types (e.g. the model for consumption of beans was also adjusted for the consumption of chickpeas and lentils). All independent variables were measured at baseline.
Discussion
In this study, we did not find any detrimental association between legume consumption and the DAI score. Different models were considered in terms of years of follow-up, and analyses were adjusted for a wide range of covariates. Moreover, results did not vary with age, sex or the type of legumes consumed. The results also suggest that legumes, when consumed in traditional recipes, are not associated with unhealthy ageing. It should be mentioned that traditional recipes can include processed meat, potatoes and other additional ingredients such as salt, which is often added to meals during cooking and can be responsible for potential harmful effects.
Two meta-analyses of the literature have summarised the association between legume consumption and health-related outcomes(Reference Afshin, Micha and Khatibzadeh30,Reference Schwingshackl, Schwedhelm and Hoffmann31) . The first one showed that consuming four 100 g servings in a week was associated with a 14 % lower risk of ischaemic heart disease, but no significant associations with stroke or type 2 diabetes were found(Reference Afshin, Micha and Khatibzadeh30). The second one observed a lower mortality for the highest v. the lowest legume intake categories; however, a significant association was not found for each additional daily 50 g serving(Reference Schwingshackl, Schwedhelm and Hoffmann31). Moreover, in a large American cohort study(Reference Bernstein, Pan and Rexrode32), consumption of red meat was related to higher risk of stroke but the association disappeared when replacing red meat consumption by legumes or eggs. Based on this evidence, consumption of 50 g/d of dry beans, lentils and peas has recently been recommended as part of a healthy diet (based on 10 460 kJ/d of energy intake)(Reference Willett, Rockstrom and Loken33). However, the role of legume consumption on specific endpoints related to unhealthy ageing is still uncertain, since there is a lack of studies in this area.
Several biological mechanisms could suggest a potential beneficial effect of legumes on healthy ageing. Legumes are rich in lectin proteins(Reference Sharon and Lis34,Reference Loris, Hamelryck and Bouckaert35) . Adequate protein intake has been related to many health benefits(Reference Wu36,Reference Mustafa, Ellison and Singer37) , including reduced frailty risk in older adults(Reference Coelho-Júnior, Rodrigues and Uchida38). Also, substituting vegetable for animal protein has been associated with lower mortality(Reference Song, Fung and Hu39). In addition, a previous study found a significant direct association between protein intake and a greater muscle strength in older adults, but their results did not show an association with 3-year physical function decline(Reference Farsijani, Payette and Morais40). By contrast, lectins found in legumes could reduce nutrient absorption and impact health in a detrimental way(Reference Cordain, Toohey and Smith41–Reference Freed43), which is especially relevant for people with malnutrition, such as frail older adults. In addition, legumes are difficult to digest due to the high-fibre content and their content in trypsin inhibitors and tannins(Reference Dallas, Sanctuary and Qu44,Reference Marinangeli, Curran and Barr45) . This adds to the fact that legumes are consumed in recipes that include processed meat, salt and potatoes. Therefore, the net impact of this consumption on ageing can be different from the expected based on the beneficial effects of vegetable protein on chronic diseases.
In this study, the mean total consumption was 57·9 g/d (about 400 g/week), which is an adequate amount according to several dietary guidelines(Reference Aranceta, Arija and Maíz46,47) , and can contribute to improve the nutrient density of diet(Reference Marinangeli, Curran and Barr45). The mean consumption in our study was higher than what has been reported in the general Spanish population(Reference Varela-Moreiras, Avila and Cuadrado48), since our cohort only includes old people with a high consumption of legume-based recipes, compared with their younger counterparts(49). Legume consumption in our study was also much higher than in the US population, whose average intake is 16·6 g/d in men and 13·4 g/d in women(Reference Bernstein, Pan and Rexrode32). In a similar trend, we have observed also a highest legume intake in men in our research.
Our results showed also that lentils were the type of legume most highly consumed in the Spanish older sample interviewed, followed by chickpeas and beans. A previous study showed results going in a similar direction(Reference Schneider50), highlighting also that the most popular use of legumes in Spain was for the traditional legume-based recipes assessed in the present research. On the other hand, and according to the results obtained, there was not enough evidence for suggesting a differential effect on the relationship between legume consumption and unhealthy ageing when stratifying by protein intake, after observing the similar non-significant trends in the different follow-up periods considered.
A main strength of this study was the use of a validated diet history, which allowed for a detailed assessment of the consumption of legumes, portion sizes and legume-based recipes(Reference Struijk, Banegas and Rodriguez-Artalejo7,Reference Guallar-Castillon, Sagardui-Villamor and Balboa-Castillo17) . Another strength was that the analyses were adjusted for many potential confounders, including socio-demographics, healthy behaviours, energy intake and dietary variables, which were introduced in progressive steps into the regression models. In addition, the measure of unhealthy ageing used is based on several health domains that are combined to produce a global health score. This is consistent with the WHO’s conceptualisation of health for purposes of measurement(Reference Salomon, Mathers, Chatterji, Murray and Evans51). Measures of healthy (or unhealthy) ageing built under this approach have previously shown a good reliability and performed well when predicting mortality(Reference Caballero, Soulis and Engchuan52,Reference De la Fuente, Caballero and Sánchez-Niubó53) . Among the potential limitations, diet was self-reported, so certain misclassification and social desirability bias may have occurred. It should be noted, however, that the information from this validated diet history has been used previously to assess the impact of dietary variables on frailty and functional status in older adults(Reference Arias-Fernández, Machado-Fragua and Graciani5,Reference León-Muñoz, Garcia-Esquinas and Lopez-Garcia15,Reference Garcia-Esquinas, Rahi and Peres54–Reference Lopez-Garcia, Hagan and Fung57) . Also, results were similar when using the cumulative consumption of legumes in 2010 and 2013 as the independent variable. As another potential limitation of the study, it could be mentioned the moderate or relatively small sample size in some analyses, specifically in the stratified analyses conducted. In that case, potential insufficient statistical power might be also responsible for non-significant associations; nevertheless, linear regression models are an appropriate approach to keep the statistical power as high as possible, and a certain consistency has been found throughout the results shown. Despite the longitudinal design, reverse causality cannot be ruled out; however, the fact that results were similar when using several periods of follow-up, one of them over 7 years, makes it unlikely that reverse causation entirely explains the results. Lastly, although a 7-year follow-up might be insufficient to detect a potentially significant association between legumes and DAI, we have previously found that the DAI decreases an average of 0·74 annually in our cohort(Reference García-Esquinas, Ortolá and Prina58), so this period should be enough to detect a significant change in this index.
In conclusion, our results show that legume and legume-based recipes consumption is not associated with increased accumulation of health deficits over time in older people. This finding indicates that legumes can be part of a healthy diet in this population, even when eaten in traditional stews. Our results may serve to address dietary advice focused on the specific necessities of the older population.
Acknowledgements
This work was supported by FIS grants 16/609, 16/1512 and 18/0028 (Instituto de Salud Carlos III, State Secretary of R + D + I, and FEDER/FSE); the Ageing Trajectories of Health: Longitudinal Opportunities and Synergies (ATHLOS) project (EU Horizon 2020 – Grant agreement no. 635316); the ‘Cátedra UAM Epidemiología y control del riesgo cardiovascular’ (no. 820024) and the Joint Programming Initiative - A Healthy Diet for a Healthy Life (SALAMANDER project). The funding agencies had no role in study design, data analysis, interpretation of results, manuscript preparation or in the decision to submit this manuscript for publication.
The authors’ responsibilities were as follows: E. L.-G. and F. R.-A. created the study concept and design; F. F. C. provided statistical expertise and drafted the manuscript; E. L.-G. supervised the work; E. L.-G. and F. R.-A. obtained funding; J. M. B., E. G.-E., E. A. S. and R. O. provided input and critical feedback after reviewing the first draft. All authors read and approved the manuscript as submitted and are prepared to take public responsibility for the work.
The authors declare that there is no conflict of interest regarding the publication of this article.
Supplementary material
For supplementary material referred to in this article, please visit https://doi.org/10.1017/S0007114520001907


