Insulin resistance has a principal importance for the development and progression of diabetes as well as the metabolic syndrome, obesity, hypertension and CVD(Reference Kohli and Greenland1, Reference Cortez-Dias, Martins and Fiuza2). Cr is considered an essential factor for optimal insulin activity and normal carbohydrate/lipid mechanism(Reference Anderson, Cheng and Bryden3). Biotin is an essential cofactor for a number of carboxylases that are important in carbohydrate and lipid metabolism, including acetyl-CoA carboxylase and methylcrotonyl-CoA carboxylase. Biotin stimulates the activity of glucokinase in the liver and improves pancreatic β islet cell function to enhance insulin regulation(Reference Fernandez-Mejia4).
In vitro data have suggested that the combination of 10 ng/ml chromium picolinate (CrPic) with 50 mg/kg biotin greatly enhances glucose uptake and glycogen production in a human skeletal muscle culture(Reference Wang, Zhang and Baldor5). It was reported that CrPic, and the combination of CrPic and biotin, are capable of enhancing glucose disposal, lowering total cholesterol (TC) levels and increasing HDL-cholesterol levels in people with type 2 diabetes(Reference Komorowski, Greenberg and Maki6). The combination of CrPic and biotin has also been reported to improve glycaemic control in overweight uncontrolled type 2 diabetes(Reference Albarracin, Fuqua and Evans7–Reference Juturu, Ruelle and Hudson9). In human studies, CrPic and biotin reduced cholesterol levels(Reference Albarracin, Fuqua and Evans7) and atherogenic index in plasma(Reference Geohas, Daly and Juturu10). The mechanism by which Cr and biotin exert their anti-diabetic effects has not been studied in detail. PPAR-γ and insulin receptor substrate 1 (IRS-1) are important biomarkers involved in insulin signalling and resistance as well as in inflammation(Reference Hallakou, Doaré and Foufelle11, Reference Saad, Araki and Miralpeix12). NF-κB is another biomarker involved in cellular responses to stimuli such as stress and free radicals(Reference Gilmore, King and Harris13). Hua et al. (Reference Hua, Clark and Ren14) stated that Cr down-regulates proteins such as IRS-1 involved in insulin resistance. Similarly, Sharma et al. (Reference Sharma, Bharti and Ojha15) found that improved glycaemic control is associated with increased PPAR-γ and decreased NF-κB protein expression in high-fat diet (HFD)-streptozotocin (STZ)-induced type 2 diabetic rats. Therefore, the aim of the present study was to evaluate the anti-diabetic properties of CrPic and biotin and their action of mechanism by looking at the changes in biomarkers such as PPAR-γ, IRS-1 and NF-κB proteins, antioxidant status measured as malondialdehyde (MDA), metabolic parameters, as well as tissue histopathological changes in STZ-induced type 2 diabetic rats fed a HFD.
Experimental methods
Animals and diets
Male Sprague–Dawley rats were purchased from the Firat University Laboratory Animal Research Center (Elazig, Turkey). The animals were reared at the temperature of 22 ± 2°C, humidity of 55 ± 5 % and with a 12 h light–12 h dark cycle. All animal procedures were approved by the Animal Experimentation Ethics Committee of Firat University (Elazig, Turkey). All procedures involving rats were conducted in strict compliance with the relevant laws, the Animal Welfare Act, Public Health Services Policy and guidelines established by the Institutional Animal Care and Use Committee of the Institute. Prior to the starting of the experiment, animals were assigned to either a regular diet (control; 12 % of energy from fat) or a HFD (42 % of energy from fat). The control diet and HFD were composed, according to the American Institute of Nutrition (AIN)-93(Reference Reeves, Nielsen and Fahey16) recommendations, of casein (20 %), soyabean oil (7 %), wheat starch (53·2 %), sucrose (10 %), potato starch (5 %), l-cysteine (0·3 %), vitamin mix AIN-93M (1 %) and mineral mix AIN-93M (3·5 %). The HFD (42 % energy from fat) was obtained from the basal AIN-93 diet, by replacement of wheat starch with fat (tallow 15 % and soyabean oil 10 %). The chemical composition of experimental diets is shown in Table 1. For induction of type 2 diabetes (insulin resistance) and dyslipidaemia, the rats were fed the HFD for 2 weeks, fasted overnight at the last day and received a single injection of STZ (Sigma Chemical Company) intraperitoneal at the end of the 14 d. STZ was dissolved in citrate buffer (pH 4·5) and injected at 40 mg/kg body weight (BW). A control group was given citrate buffer via intraperitoneal injection. The development of hyperglycaemia in rats was confirmed by measuring fasting serum glucose at 72 h after STZ injection. Rats with a fasting serum glucose level above 1400 mg/l were considered diabetic and were recruited to the study.
Table 1 Macronutrient composition of the control and high-fat diet (HFD) fed to rats
Experimental design
The rats weighing 200–220 g (8 weeks old, n 75) were divided according to BW, which were similar, into five equal groups containing fifteen rats each. The groups were as follows: group 1: normoglycaemic rats, fed a regular diet (normal control) and injected with buffer solution as placebo; group 2: diabetic rats, fed a HFD without any supplementation (diabetic control); group 3: diabetic rats, fed a HFD supplemented with CrPic (80 μg/kg BW per d); group 4: diabetic rats, fed a HFD supplemented with biotin (300 μg/kg BW per d); group 5: diabetic rats, fed a HFD supplemented with both CrPic (80 μg/kg BW per d) and biotin (300 μg/kg BW per d). The CrPic and biotin supplements were dissolved in drinking-water and offered to rats. CrPic was supplemented to provide 8 μg Cr/d, which is an equivalent dose of 560 μg Cr for a 70 kg adult human. Chromium picolinate and biotin were supplied by Nutrition 21, Inc. The study was carried out for 10 weeks. At the end of the experiment, all rats were killed by cervical dislocation. Blood samples were taken from rats in the morning, after overnight fasting, and the tissues from the pancreas, liver, kidney and muscles from the hind limb, including biceps femoris, gastrocnemius and soleus, were removed and processed for biochemical, Western blot and histopathological examination. Fat was trimmed off from the muscles. Feed intake and BW were measured twice weekly.
Laboratory analyses
Blood samples were centrifuged at 3000 g for 10 min and analysed for TC, TAG, insulin, cortisol, urea, creatinine and MDA. Estimation of insulin sensitivity from an oral glucose tolerance test, blood glucose and plasma insulin profiles were performed using the composite insulin sensitivity index (CISI) proposed by Matsuda & De Fronzo(Reference Matsuda and De Fronzo17). Calculation of the index was made according the following equation:
 $$\begin{eqnarray} \end{eqnarray}$$
where FPG and FPI are fasting plasma glucose and insulin concentrations, respectively, and MG and MI are the mean glucose and insulin concentrations, respectively, over the course of the oral glucose tolerance test.
At 1 week before surgical preparation, an oral glucose tolerance test was performed after 12–14 h of fasting on all animals. Blood glucose was measured in triplicate before (baseline) and 5, 15, 30, 45, 60, 90 and 120 min after the administration of 20 % (w/v) d-glucose solution (1 g/kg BW) by oral administration. Blood was obtained from the tail vein and glucose was assessed using a glucometer (Accu-Chek Active; Roche Diagnostics).
A computer-solved model called the homeostasis model assessment-estimated insulin resistance (HOMA-IR) was calculated, as proposed by Muniyappa et al. (Reference Muniyappa, Chen and Muzumdar18), using the following equation:
 $$\begin{eqnarray} \end{eqnarray}$$
Serum glucose concentrations were measured by using ACCU-Chek Active (Roche Diagnostics). Serum insulin levels were measured using the Rat Insulin Kit (Linco Research, Inc.) by ELISA (Elx-800; Bio-Tek Instruments, Inc.). Cortisol concentration was determined by ELISA using a commercially available kit, according to the manufacturer's protocol (Cortisol ELISA Kit no. 402710, assay range 0·05–5·0 ng/ml; Neogen Corporation). Serum concentrations of TC and TAG were measured using the diagnostic kits (Sigma Diagnostics, Inc.). NEFA levels were measured by a diagnostic kit (Boehringer Mannheim, GmbH). Serum urea and creatinine concentrations and aspartate aminotransferase and alanine aminotransferase activities were measured using a biochemical analyser (Olympus AU-660, Olympus).
Lipid peroxidation was measured in terms of MDA formation, which is the major product of membrane lipid peroxidation, using a previously described method(Reference Karatepe19) with slight modification. MDA concentration of kidney tissue was measured by HPLC (Shimadzu) using a Shimadzu UV-vis SPD-10 AVP detector and a C18-ODS-3, 5 μm, 4·6 × 250 mm column. The mobile phase was 30 mm-KH2PO4–methanol (82·5:17·5, v/v, pH 3·6) and the flow rate was 1·2 ml/min. Chromatograms were monitored at 250 nm and the injection volume was 20 μl.
Western blot
Protein extraction was performed by homogenising the rat adipose, liver and kidney tissues in 1 ml ice-cold hypotonic buffer A containing 10 mm-HEPES (pH 7·8), 10 mm-KCl, 2 mm-MgCl2, 1 mm-dithiothreitol (DTT), 0·1 mm-EDTA and 0·1 mm-phenylmethylsulfonyl fluoride. To the homogenate, 80 μl of 10 % Nonidet P-40 solution were added and the mixture was centrifuged for 2 min at 14 000 g. The precipitates, containing nuclei, were washed once with 500 μl of buffer A plus 40 μl of 10 % Nonidet P-40, centrifuged, resuspended in 200 μl of buffer C (50 mm-HEPES (pH 7·8), 50 mm-KCl, 300 mm-NaCl, 0·1 mm-EDTA, 1 mm-DTT, 0·1 mm-phenylmethylsulfonyl fluoride and 20 % glycerol) and centrifuged for 5 min at 14 800 g. The supernatant proteins were collected for PPAR-γ, IRS-1 and NF-κB. Equal amounts of protein (50 μg) were electrophoresed and subsequently transferred to nitrocellulose membrane (Schleicher and Schuell, Inc.). The antibody against PPARγ phosphorylated tyrosine 612 IRS1 (Tyr162) and NF-κB were purchased from Santa Cruz Biotechnology, Inc. Primary antibody was diluted (1:1000) in the same buffer containing 0·05 % Tween-20. Protein loading was controlled using a monoclonal mouse antibody against β-actin antibody (A5316; Sigma). Bands were analysed densitometrically using an image analysis system (Image J; National Institutes of Health).
Histopathological examination
Following laparotomy, the tissues (liver, kidney and pancreas) of each rat were first examined grossly. The tissues were then removed for histological examination. Formaldehyde (10 %)-fixed pancreas, liver and kidney tissues were embedded in paraffin and serial sections (3 mm) were cut using a microtome. Each section was stained with haematoxylin and eosin for histological examination according to a standard procedure(Reference Ross, Reith and Romrell20). The histological analyses were performed by the same person who was blinded to the group that each sample came from.
Statistical analysis
Sample size was calculated based on a power of 85 % and a P value of 0·05. On the basis of this assumption, a sample size of fifteen per treatment was used. The data were analysed using the general linear model procedure of SAS (SAS Institute Inc.). Differences between groups were analysed using Fisher's multiple comparison test followed by Fisher's post hoc test for all groups.
Results
Effects of chromium picolinate and biotin on glucose, insulin, lipid profile and serotonergic properties
Feed intake and final BW were greater in diabetic rats fed either feeds supplemented with CrPic or biotin alone or as a combination (P< 0·05). The effects of CrPic and biotin supplementations alone or in a combination on the serum glucose, insulin, cortisol and lipid profile of diabetic rats are presented in Table 2. After 10 weeks of feeding the HFD along with intraperitoneal injection of STZ, serum glucose, cortisol, TC, TAG and NEFA levels were elevated by 4·6-, 1·6-, 2·6-, 2·9- and 2·4-fold, respectively, in diabetic control rats, compared with the normal controls (P= 0·0001). However, serum insulin and CISI values were reduced by 2·1- and 3·2-fold in diabetic control rats, compared with rats fed a regular diet (P= 0·0001). Diabetic rats fed a diet supplemented with CrPic or biotin had greater CISI, but lower HOMA-IR (P< 0·05). Either in combination or alone, CrPic and biotin decreased blood glucose, serum cortisol, TC, TAG and NEFA concentrations (P= 0·0001), but increased serum insulin and CISI concentrations in diabetic rats (P= 0·0001). The effect of combination of CrPic and biotin was more pronounced on these parameters. In addition, except total TC concentration, CrPic was more effective compared with biotin on these parameters.
Table 2 Effects of chromium picolinate (CrPic) and biotin supplementation on glucose, insulin and lipid profile in diabetic rats (Mean values with their standard errors of fifteen rats from each group)

HFD, high-fat diet; STZ, streptozotocin; CISI, composite of insulin sensitivity index; HOMA-IR, homeostasis model assessment-estimated insulin resistance; TC, total cholesterol.
a,b,c,d,eMean values within a row with unlike superscript letters were significantly different (P< 0·05).
Diabetic rats had increased levels of alanine aminotransferase and aspartate aminotransferase and also urea and creatinine, compared with normal (non-diabetic) rats (Table 3). We found a 1·9-fold increase in serum urea, a 1·7-fold increase in creatinine, a 2·1-fold increase in alanine aminotransferase and a 1·9-fold increase in aspartate aminotransferase in HFD–STZ-treated diabetic control rats, compared with normal controls (P= 0·0001). CrPic and biotin supplementations, alone or in combination, decreased serum urea, creatinine, aspartate aminotransferase and alanine aminotransferase levels in diabetic rats. The effect of the combination of CrPic and biotin was more pronounced on these parameters. Although not significant, CrPic was more effective on these parameters compared with biotin.
Table 3 Effects of chromium picolinate (CrPic) and biotin supplementation on urea, creatinine, aspartate aminotransferase (AST) and alanine aminotransferase (ALT) levels in diabetic rats (Mean values with their standard errors of fifteen rats from each group)
HFD, high-fat diet; STZ, streptozotocin.
a,b,c,dMean values within a row with unlike superscript letters were significantly different (P< 0·05).
Serum, liver and kidney MDA levels were increased upon feeding the HFD in diabetic rats (P= 0·0001; Table 4). The effect of the combination of CrPic and biotin was more pronounced on these parameters. In addition, except for liver MDA levels, CrPic was more effective compared with biotin on these parameters.
Table 4 Effects of chromium picolinate (CrPic) and biotin supplementation on serum, liver and kidney malondialdehyde (MDA) concentrations in diabetic rats (Mean values with their standard errors of fifteen rats from each group)
HFD, high-fat diet; STZ, streptozotocin.
a,b,c,d,eMean values within a row with unlike superscript letters were significantly different (P< 0·05).
Effects of chromium picolinate and biotin on protein expression of PPAR-γ, insulin receptor substrate 1 and NF-κB in tissues of diabetic rats
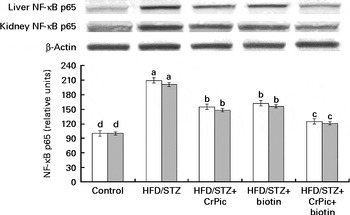
As shown in Fig. 1, feeding a HFD to rats decreased PPAR-γ expression in adipose tissue, while CrPic or biotin, each alone or their combination, increased (P< 0·001) PPAR-γ expression in this tissue. The level of phosphorylated IRS-1 (p-IRS-1) (Tyr162) in liver, kidney and muscle tissues of diabetic control rats was reduced to 52·33 % of that in normal control rats (P< 0·05) (Fig. 2). CrPic or biotin alone similarly increased the p-IRS-1 expression, but the magnitude of the increase was more in case of the combination of supplements. Expression of NF-κB in the liver and kidney tissues was greater in rats fed a HFD, as compared with rats fed a regular diet (P< 0·01) (Fig. 3). Supplementing CrPic or biotin, or a combination of them, resulted in a decrease in expression of NF-κB in diabetic rats (P< 0·05).

Fig. 1 Effects of diabetes and chromium picolinate (CrPic) and biotin supplementation on PPARγ expression in adipose tissue. Data are expressed as a ratio of the normal control value (set to 100 %). Blots were repeated at least three times (n 3) and a representative blot is shown. Actin was included to ensure equal protein loading. Values are means, with their standard errors represented by vertical bars. a,b,c,d,eMean values with unlike letters were significantly different (P< 0·05; Fisher's multiple comparison test). HFD, high-fat diet; STZ, streptozotocin.

Fig. 2 Effects of diabetes and chromium picolinate (CrPic) and biotin supplementation on phosphorylation of insulin receptor substrate (p-IRS)-1) (Tyr162) expression in the liver (□), the kidney (![]() ) and muscles (■). Data are expressed as a ratio of the normal control value (set to 100 %). Blots were repeated at least three times (n 3) and a representative blot is shown. Actin was included to ensure equal protein loading. Values are means, with their standard errors represented by vertical bars. a,b,c,dMean values with unlike letters were significantly different (P< 0·05; Fisher's multiple comparison test). HFD, high-fat diet; STZ, streptozotocin.
) and muscles (■). Data are expressed as a ratio of the normal control value (set to 100 %). Blots were repeated at least three times (n 3) and a representative blot is shown. Actin was included to ensure equal protein loading. Values are means, with their standard errors represented by vertical bars. a,b,c,dMean values with unlike letters were significantly different (P< 0·05; Fisher's multiple comparison test). HFD, high-fat diet; STZ, streptozotocin.

Fig. 3 Effects of diabetes and chromium picolinate (CrPic) and biotin supplementation on NF-κB p65 expression in the liver (□) and the kidney (![]() ). Data are expressed as a ratio of the normal control value (set to 100 %). Blots were repeated at least three times (n 3) and a representative blot is shown. Actin was included to ensure equal protein loading. Values are means, with their standard errors represented by vertical bars. a,b,c,dMean values with unlike letters were significantly different (P< 0·05; Fisher's multiple comparison test). HFD, high-fat diet; STZ, streptozotocin.
). Data are expressed as a ratio of the normal control value (set to 100 %). Blots were repeated at least three times (n 3) and a representative blot is shown. Actin was included to ensure equal protein loading. Values are means, with their standard errors represented by vertical bars. a,b,c,dMean values with unlike letters were significantly different (P< 0·05; Fisher's multiple comparison test). HFD, high-fat diet; STZ, streptozotocin.
Effects of chromium picolinate and biotin on histopathology of tissues
Histopathological evaluation of various liver, kidney and pancreatic segments of the rats fed a regular diet and rats fed a HFD are presented in Fig. 4.

Fig. 4 Effects of chromium picolinate (CrPic) and biotin supplementation on histopathological changes in liver, kidney and pancreatic tissues (stained with haematoxylin and eosin dye). Control: liver, kidney and pancreas tissue sections of rats fed a regular diet; high-fat diet (HFD)/streptozotocin (STZ): liver, kidney and pancreas tissue sections from the diabetic rats; HFD/STZ+CrPic: liver, kidney and pancreas tissue sections from diabetic rats supplemented with CrPic; HFD/STZ+biotin: liver, kidney and pancreas tissue sections from diabetic rats supplemented with biotin; HFD/STZ+CrPic+biotin: liver, kidney and pancreas tissue sections from diabetic rats supplemented with both CrPic and biotin. (A colour version of this figure can be found online at http://www.journals.cambridge.org/bjn).
Liver
Normal histology and normal hepatocellular architecture with a normal central vein were observed in non-diabetic rats. Hepatocytes having pink eosinophillic cytoplasm without any inclusions and with mostly central single nuclei were observed in non-diabetic rats. These cells had well-defined cell borders, polygonal in shape and arranged in sheets. Liver sinusoids were not dilated. There were no areas of haemorrhage or fibrosis. In diabetic rats, hepatocytes had vacuolated eosinophillic cytoplasm with a ground glass appearance and with fatty inclusions. The nuclei were enlarged, displaced and vacuolated. There were several pycnotic nuclei, suggesting significant hepatocellular degeneration. The cells were irregular in size, shape and orientation. Moderate macrovesicular fatty degeneration of liver with dilated sinusoids was observed. In CrPic or biotin, or the combination of supplements groups, lobules with normal hepatocellular architecture with a normal central vein were observed. Hepatocytes had pink eosinophillic cytoplasm without any inclusions and with mostly central single nuclei. These cells had well-defined cell borders, polygonal in shape and arranged in sheets. Liver sinusoids were not dilated. There were no areas of haemorrhage or fibrosis.
Kidney
In diabetic (fat-fed/STZ) rats, renal parenchyma showing significant vacuolar degeneration of renal tubular cells with displaced pycnotic nuclei was observed. Renal glomeruli showing mesangial hyperplasia and eosinophillic fibrinous deposits were observed. Diffuse infiltration of monomorphonuclear cells in renal parenchyma and the glomeruli was observed. Tubulointerstitial nephropathy with significant mesangial proliferation in glomeruli was observed. In CrPic and biotin treatment or in combination groups, normal renal tubular architecture and normal glomeruli were observed.
Pancreas
Non-diabetic rats had normal exocrine pancreatic acinar architecture and pancreatic islets, showing predominantly insulin-producing β-cells with granular basophilic cytoplasm and few eosinophillic glucagon-producing α-cells. In diabetic rats, pancreatic islets showed a relatively decreased population of insulin-producing β-cells with granular basophilic cytoplasm and several eosinophillic glucagon-producing α-cells. There were areas of eosinophillic amorphous deposits within islets, suggesting cellular necrosis. Degenerative changes and islet cell necrosis in endocrine pancreas were observed. In supplemental groups (CrPic or biotin or a combination of them), normal exocrine pancreatic acinar architecture was observed.
Discussion
Diabetes is the most common metabolic disorder worldwide and is associated with profound alterations in glucose, insulin, cortisol, lipid and lipoprotein profiles(Reference Sharma, Bharti and Ojha15, Reference Arvind, Pradeepa and Deepa21, Reference Zheng, Zhang and Wang22). In the present study, Cr and biotin supplementation, each alone or together, ameliorated insulin resistance, dyslipidaemia, hepatic and renal damage and pathological changes in liver, kidney and pancreas tissues in HFD-STZ-induced type 2 diabetic rats. Similar to results of the present investigation, a number of studies have indicated that CrPic and biotin administration, each alone or together, can act as anti-diabetic agents and decrease TC concentration(Reference Albarracin, Fuqua and Evans7, Reference Singer and Geohas8, Reference Sahin, Tuzcu and Orhan23). Previous studies have also demonstrated that animals, when fed a HFD and injected with a low dose of STZ, display many characteristics of insulin resistance, including hyperglycaemia and hyperinsulinaemia, decreased hyperlipidaemia, liver and kidney damage(Reference Sharma, Bharti and Ojha15, Reference Zheng, Zhang and Wang22, Reference Sahin, Tuzcu and Orhan23). The effect of a combination of CrPic and biotin in the present study was more pronounced for all metabolic parameters, as well as MDA, and CrPic was more effective compared with biotin on most of the parameters in diabetic rats. Similarly, previous studies indicated that a combination of CrPic and biotin worked synergistically to produce positive effects on insulin function, blood glucose and lipid metabolism in people with type 2 diabetes(Reference Albarracin, Fuqua and Evans7, Reference Singer and Geohas8, Reference Geohas, Daly and Juturu10) and in an animal model of insulin-resistant obesity(Reference Wang, Zhang and Baldor5). In accordance with other metabolic parameters of the present study, diabetic rats fed a diet supplemented with CrPic or biotin had a greater CISI but lower HOMA-IR. Feed intake and final BW of diabetic rats were paralleled in a way that greater feed intake resulted in a greater final BW.
The present study provided evidence of a specific association between a combination of CrPic and biotin supplementation and MDA in diabetic rats. Lower levels of MDA were observed in diabetic animals receiving CrPic and biotin supplementation. Cr, through playing an important role against insulin resistance, is postulated to augment the antioxidant defence system(Reference Sahin, Tuzcu and Orhan23). A decrease in hepatic thiobarbituric acid reactive substances formation by supplementation of CrPic and chromium nicotinate has been reported in rats(Reference Preuss, Echard and Perricone24). It was also found that chromium dinicocysteinate supplementation in rats significantly lowered C-reactive protein and lipid peroxidation and increased vitamin C and adiponectin levels(Reference Jain, Croad and Velusamy25). Oxidative stress associated with overproduction of reactive oxygen species plays an important role in the development of diabetic complications, including diabetic nephropathy(Reference Akude, Zherebitskaya and Chowdhury26).
PPAR is a member of a nuclear receptor superfamily. Due to its role in decreasing insulin resistance and inflammation, PPAR has been involved in the pathology of numerous diseases, including obesity, diabetes and atherosclerosis(Reference Sharma, Bharti and Ojha15, Reference Derosa and Maffioli27). PPAR exist as three different subtypes in mammals, namely, PPARα, PPARδ and PPARγ. PPARγ, widely expressed in adipose tissue, is the central regulator of insulin and glucose metabolism, leading to improved insulin sensitivity in type 2 diabetic patients as well as in diabetic rodent models(Reference Arvind, Pradeepa and Deepa21). Several studies have shown that PPAR-γ agonists may be effective in reducing renal cortical lipid content and proteinuria by a mechanism independent of their hypoglycaemic property(Reference Benigni, Zoja and Campana28–Reference Bobulescu30). In the present study, CrPic and biotin, as well as their combination, regulated (increased) PPAR-γ expression in adipose tissue, which may exert a potent insulin-sensitising effect and may improve insulin resistance in a rat model of type 2 diabetes mellitus. It has been demonstrated that a combination of lipoic acid, acetyl-l-carnitine, nicotinamide and biotin treatment significantly increased mRNA levels of PPAR-γ in skeletal muscles of type 2 diabetic Goto–Kakizaki rats(Reference Shen, Hao and Tian31). Additionally, it has been reported that anti-lipidaemic and anti-inflammatory effects of drugs, such as Semecarpus anacardium nut milk extract treatment, increase the mRNA expression of PPAR-γ(Reference Khan, Vinayagam and Moorthy32).
Studies in diabetic mice and rat models have found that supplementing CrPic and biotin increases insulin sensitivity(Reference Sahin, Tuzcu and Orhan23, Reference Reddi, DeAngelis and Frank33, Reference Zhang, Osada and Sone34). IRS-1 appears to play a central role in the insulin-stimulated signal transduction pathway and links the insulin receptor to its final biological actions via a series of intermediate effectors(Reference Cheatham and Kahn35). Studies have shown that differential regulation of IRS-1 in the liver and muscle tissues were observed in diabetic animals, which may produce differential alterations in insulin signalling in these two tissues and contribute to hepatic and muscular insulin resistance(Reference Saad, Araki and Miralpeix12). In the present study, decreases of IRS-1 expression in the liver, kidney and muscle tissues were observed in diabetic rats. These results suggest that the favourable impact of CrPic and biotin on hyperlipidaemia was probably associated with the improvement of insulin signal transduction in target tissues, which plays an important role in regulating glucose metabolism. Consistent with the present findings, Jain et al. (Reference Jain, Croad and Velusamy25) reported that chromium dinicocysteinate supplementation increased IRS-1 activation in the liver tissues of type 2 diabetic rats. Similarly, Wang et al. (Reference Wang, Zhang and Russell36) reported that obese rats treated with CrPic had significantly improved glucose disposal rates and demonstrated a significant increase in insulin-stimulated p-IRS-1 and phosphatidylinositol-3 kinase activity in skeletal muscles compared with obese controls.
NF-κB, one of the transcription factors, is responsible for controlling DNA transcription and is involved in cellular responses to a number of stimuli including free radicals(Reference Gilmore, King and Harris13). Hyperglycaemia-induced reactive oxygen species and advanced glycated end products stimulate the signal transduction pathway for the activation of the transcription factor NF-κB(Reference Kuhad and Chopra37). The results of the present study also showed that CrPic and biotin, as well as their combination, decreased NF-κB level in the liver and kidney tissues of the rats with HFD/STZ-induced diabetes. In parallel with the results of the present study, Kuhad et al. (Reference Kuhad, Sachdeva and Chopra38) reported that NF-κB p65 subunit was significantly elevated in the kidneys of diabetic animals. Results of the present investigation are also consistent with previous studies reporting that the levels of NF-κB p65 in the kidneys were distinctly increased in a lower-dose STZ-induced diabetic rat model fed a HFD(Reference Cheng, Chen and Lin39). Tuzcu et al. (Reference Tuzcu, Sahin and Orhan40) also reported a decrease in liver NF-κB expression by supplementation of CrPic in rats fed a HFD. In addition, Jain et al. (Reference Jain, Croad and Velusamy25) found that chromium dinicocysteinate is a potent hypoglycaemic compound, with anti-inflammatory activity apparently mediated by elevated blood vitamin C and inhibition of NF-κB, Akt and GLUT-2 in the livers of type 2 diabetic rats. It can be postulated from the present investigation and results from the reported studies(Reference Jain, Croad and Velusamy25, Reference Cheng, Chen and Lin39, Reference Tuzcu, Sahin and Orhan40) that amelioration of insulin resistance by CrPic and biotin might be directly or indirectly associated with modulation of NF-κB expression.
Data found in the present study also provided evidence that HFD-STZ treatment produces liver, kidney and pancreatic lesions in rats because of associated hyperinsulinaemia, hyperlipidaemia, hyperglycaemia and increased oxidative stress. However, CrPic and biotin alone or in combination prevented these pathological alterations due to their insulin-sensitising, anti-inflammatory, anti-dyslipidaemia and antioxidant activity. Animal studies strongly support the hypoglycaemic action of biotin and CrPic via improved glucose tolerance and decreased insulin resistance(Reference Sahin, Tuzcu and Orhan23, Reference Zhang, Osada and Sone34, Reference Zhang, Osada and Maebashi41).
The present study clearly showed that supplementing CrPic or biotin alone or in a combination exerts antioxidant, anti-hyperlipidaemic, anti-inflammatory and anti-hyperglycaemic effects, and increases the level of insulin in diabetic rats. These changes may be related to the elevation of the levels of PPAR-γ and p-IRS-1 in the liver, kidney and muscle tissues. The combination of CrPic and biotin in the present study was more effective for all metabolic parameters, as well as on MDA, PPAR-γ, p-IRS-1 and NF-κB. CrPic supplementation was more effective, compared with biotin supplementation, on most of the parameters in diabetic rats. Therefore, a nutritional supplement containing CrPic and biotin is highly recommended for individuals having metabolic diseases, diabetes in particular. CrPic and biotin supplementations could exert their health-benefiting roles in regulating diabetes via activation of PPAR-γ, IRS-1 and NF-κB proteins and its associated complications in the tissues. The present doses of CrPic and biotin provided positive results, but dose-dependent responses could also be investigated as a further study.
Acknowledgements
The present study was supported by Nutrition 21. The authors' responsibilities were as follows: C. O., M. T. and I. H. O. participated in data collection and laboratory analyses and assisted in every aspect of the study; N. S. participated in the study design, data collection, laboratory analyses and wrote the first draft of the manuscript; V. J. and J. R. K. participated in study design, interpretation and preparation of the manuscript; K. S. and O. K. participated in the organisation of the study and data interpretation and preparation of the manuscript. All authors read and approved the final manuscript. None of the authors has any conflicts of interest.