


The metabolic syndrome is defined by the presence of central obesity, non-alcoholic fatty liver disease (NAFLD), hyperlipidaemia, hyperglycaemia, insulin resistance (IR) and hypertension. In the developed countries, as well as in many developing countries, where food supplies are abundant and physical activity is reduced, the incidence of obesity is rapidly increasing and becomes a major public health problem( Reference Barness, Opitz and Gilbert-Barness 1 ). This trend is associated with a parallel increase in the prevalence of NAFLD, which affects about 30 % of the general population in Western society, and is recognised as the most common cause of liver dysfunction worldwide( Reference Fromenty, Robin and Igoudjil 2 – Reference Chiang, Pritchard and Nagy 4 ). Liver lipid accumulation (steatosis) is the first stage of NAFLD and can occur from the diet, from de novo lipogenesis or from lipids released from adipose tissue. It is a phenomenon that takes place rapidly when rats are submitted to high-fat feeding but that does not develop linearly over time( Reference Gauthier, Favier and Lavoie 5 ). In parallel, oxidative stress, inflammation, mitochondrial dysfunction and IR may lead to large hepatocyte injuries (steatohepatitis/cirrhosis), which characterise the second stage of NAFLD.
Accumulating and emerging evidence indicates that hepatic mitochondria play a critical role in the development and progression of steatosis and NAFLD, which is consistent with the major contribution of mitochondria in the fatty acid metabolism. Indeed, mitochondrial dysfunction and impaired mitochondrial electron transport chain have been described in many mouse/rat models of diet-induced obesity characterised by hepatic steatosis, liver injury and IR. Owing to the multiple functions performed by mitochondria, the term mitochondrial dysfunction is ambiguous. In relation with NAFLD, mitochondrial dysfunction refers to the impairment of mitochondrial electron transport chain function at respiratory complexes, as well as a reduction in mitochondrial oxidative phosphorylation and ATP synthesis.
Phospholipids are constituents of intracellular and extracellular cell membranes including both inner and outer mitochondrial membranes( Reference Quinn 6 ). Mitochondrial phospholipids define the physical properties of mitochondrial membranes and might, therefore, be expected to regulate the activities of proteins of the electron transport chain, as well as ATP production. Prominent among mitochondrial phospholipids is cardiolipin (CL), which is predominantly localised in the mitochondrial inner membrane, at the heart of mitochondrial metabolism. CL is known to affect mitochondrial bioenergetics and also to contribute to mitochondrial membrane dynamics( Reference Unsay, Cosentino and Subburaj 7 ). In fact, significant changes in CL content/profile may alter the membrane fluidity and also the organisation and functioning of the mitochondrial respiratory chain complexes. Such alterations may in turn modify interactions between these complexes, leading to an altered mitochondrial production of reactive oxygen species (ROS)( Reference Paradies, Paradies and De Benedictis 8 ). The content and/or composition of CL have been well documented in diverse pathological settings associated with mitochondrial dysfunction( Reference Chicco and Sparagna 9 , Reference Han, Yang and Yang 10 ), whereas few studies in the literature have described the possible changes in the CL content in the course of hepatic steatosis installation. For example, in NAFLD induced by choline-deficient diet, a decrease in the hepatic mitochondrial CL content was observed( Reference Petrosillo, Portincasa and Grattagliano 11 ). By contrast, in NAFLD induced by high-fat diet, an increase in the hepatic mitochondrial CL content was observed by our previous works( Reference Aoun, Fouret and Michel 12 ).
The present study was thus designed to explore the causal relationship and underlying mechanisms between NAFLD installation and progression and mitochondrial dysfunction in rats fed an obesogenic diet for 4–20 weeks, emphasising on the mitochondrial dysfunction and on the mitochondrial phospholipids alterations, in particular the CL. Determining whether the mitochondrial dysfunction precedes or follows the hepatic steatosis is an important health issue for the prevention or the treatment of this pathology. The strong point of our study is double in that, unlike most of the literature studies mentioned above, we have carried out several time points up to 20 weeks and we have carried out a control group and an high-fat–high-fructose (HFHFR) group at each studied time point.
Methods
Animals and diets
In all, seventy-five young male Wistar rats (Charles River) were housed (two per cage) under conditions of constant temperature (20–22°C), humidity (45–50 %) and a standard dark cycle (20.00–08.00 hours). The rats were block-randomised to the different time points of killing at the beginning of the study into ten groups (five groups fed the control diet and five other groups fed the high-fat–high-fructose diet). This randomisation was based on the initial rat body weight. Rats fasted for 9h (seven to eight rats per group) were killed after 4, 8, 12, 16 or 20 weeks on the control or the HFHFR diet.
The detailed composition of these two diets is given in the online Supplementary Table S1. The control diet contains 4 % lipids as soyabean oil, and the HFHFR diet contains 35 % lipids (1 % soyabean oil + 8·5 % lard + 17 % palm oil + 8·5 % cocoa butter) and 25 % fructose. Refined palm oil (VAMOLINE) was purchased from Vandemoortele Lipids and Dough Division. The lipid fraction of the control diet was composed of 17·4 % SFA, 28·1 % MUFA and 54·5 % PUFA, and that of the HFHFR diet was composed of 44·2 % SFA, 43·2 % MUFA and 12·6 % PUFA (for more information, see online Supplementary Table S2). Rats were given free access to food and tap water. Rat body weight was determined weekly and food consumption was determined every 2 or 3 d. Our institution guidelines for the care and use of laboratory animals were observed and all experimental procedures were approved by the local ethics committee in Montpellier, France (reference CEEA-LR-12002).
Oral glucose tolerance test
The oral glucose tolerance test (OGTT) was completed 4–5 d before killing the rats and performed as previously described( Reference Feillet-Coudray, Fouret and Ebabe Elle 13 ). Briefly, 6-h fasting rats (08.00 to 14.00 hours) received by oral administration 2·5 g glucose/kg body weight. Blood was sampled through the tail vein of conscious rats immediately before the oral administration, and 20, 40, 60, 90, 120 and 180 min afterwards, and blood glucose was measured using glucose strips and a commercial glucometer (AccuChek Active; Roche Diagnostics). Total cumulative glucose levels for each treatment group are reported as AUC and was calculated by the trapezium method and expressed as g blood glucose/l per 180 min.
Sampling and routine biochemical analysis
On 4, 8, 12, 16 and 20 weeks of diet intake, 4 to 5 d after the OGTT, 9-h-fasted rats (23.00–08.00 hours) were anaesthetised with pentobarbital (40 mg/kg body weight) and blood was drawn from the abdominal artery with slightly heparinised syringes, to prevent possible coagulation during the blood sampling, and distributed into dry and heparinised tubes. Blood tubes were centrifuged at 1000 g for 10 min at 4°C, and plasma or serum were collected and stored at –80°C until analysis. Liver was removed, rinsed with 0·9 % NaCl and cut into two parts: one part was divided into several aliquots and frozen in liquid N2 and kept at –80°C until analyses, and one part was used for the immediate isolation of fresh mitochondria.
Plasma glucose, serum total cholesterol (CHOL), TAG, NEFA and alanine transaminase (ALAT) levels were measured by enzymatic techniques (Sobioda). Plasma insulin was quantified with ELISA kits (Merck Millipore; Invitrogen by ThermoFisher). IR was evaluated by the homoeostasis model of IR (HOMA-IR) formula: (plasma glucose level (mm)×plasma insulin level (mU/l))/22·5( Reference Matthews, Hosker and Rudenski 14 ).
Liver neutral lipids analysis
Liver samples were extracted with a mixture of chloroform–methanol (2:1, v/v) according to Folch et al.( Reference Folch, Lees and Sloane Stanley 15 ) in the presence of 50 mg/l butylated hydroxytoluene to prevent lipid oxidation. Folch extracts were automatically applied on silica gel 60 high-performance TLC (HPTLC) plates (250 µm, 20×10 cm; Merck), pretreated with 1·5 % (w/v) boric acid in ethanol (100 %), on a 4-mm band width using ATS4 apparatus (CAMAG). The development was performed first with methanol–pentane–chloroform (3:52:45, by vol.), which allowed the separation of NEFA, CHOL and TAG+cholesteryl ester (TAG+CE) on a 50-mm total migration distance and then with diethyl ether–pentane (3:97, v/v), which allowed the separation of TAG and CE on a 57-mm total migration distance. The scanning of the plates was carried out using a TLC scanner 3 (CAMAG), operating in the reflectance mode. The plates were scanned at 550 nm after dipping in a solution of copper sulphate (CuSO4–H3PO4–H2O, 40 g:20 ml:230 ml by vol.) and heating for 20 min at 180°C. The different classes of neutral lipids (NEFA, CHOL, TAG and CE) were finally identified by comparing their retention factor (R f) with authentic standards and quantified using calibration curves of the same standards.
Liver mitochondrial isolation
Liver mitochondria were isolated from fresh liver by the differential centrifugation technique( Reference Aoun, Feillet-Coudray and Fouret 16 ). Briefly, about 3 g of liver were homogenised in 10 volumes of sucrose buffer (Sucrose 0·25 m, TRIS 10 mm, EDTA 0·5 mm, pH 7·5) and centrifuged at 900 g for 10 min at 4°C. The supernatant was then centrifuged at 10 000 g for 10 min at 4°C. The pellet was suspended in 3 ml of Miro5 buffer (110 mm sucrose, 20 mm HEPES, 10 mm KH2PO4, 20 mm taurine, 60 mm K-lactobionate, 3 mm MgCl2.6H2O, 0·5 mm ethylene glycol tetraacetic acid (EGTA), 1 g/l bovine serum albumin, pH 7·1). One aliquot of the mitochondrial suspension was used for mitochondrial function measurement( Reference Feillet-Coudray, Fouret and Ebabe Elle 13 ). and one aliquot was frozen at −80°C for lipid measurement. Protein content was determined according to Bradford with bovine serum albumin as the standard( Reference Bradford 17 ).
Mitochondrial characteristics and enzyme activities
The liver mitochondrial membrane potential and ROS production were assessed as previously described( Reference Aoun, Feillet-Coudray and Fouret 16 , Reference Barja 18 ). Mitochondrial respiration was determined by measuring mitochondrial VO2 in a high-resolution Oxygraph (Oroboros Oxygraph2k)( Reference Aoun, Feillet-Coudray and Fouret 16 ). The enzymatic activity of citrate synthase (CS) in liver and mitochondrial respiratory complexes (complex I, complex II+III and complex IV) in liver mitochondria were determined spectrophotometrically as previously described( Reference Aoun, Fouret and Michel 12 ). Mitochondrial β-hydroxyacyl-CoA dehydrogenase (β-HAD) activity, a marker of last step of mitochondrial β-oxidation activity, was determined spectrophotometrically according to the procedure described( Reference Clayton, Eaton and Aynsley-Green 19 ). Briefly, liver mitochondria suspension (25 µg protein) was mixed with NADH and acetoacetyl CoA in 1 ml of 50 mm TRIS-HCl buffer, pH 7·0, and absorbance was followed at 340 nm for 60 s at 30°C.
Separation and analysis of liver mitochondria phospholipids
Liver mitochondrial suspensions were extracted using a mixture of chloroform–methanol (2:1; v/v) according to Folch et al.( Reference Folch, Lees and Sloane Stanley 15 ) in the presence of 50 mg/l of butylated hydroxytoluene to prevent lipid oxidation. Phosphorus was quantified on Folch extracts of mitochondrial suspensions in order to determine total phospholipid quantity as previously described( Reference Bartlett 20 ).
Folch extracts of mitochondrial suspensions were automatically applied on silica gel 60 HPTLC plates (250 µm, 20×10 cm), pretreated with 2·3 % (w/v) boric acid in ethanol (100 %), on a 4 mm band width using ATS4 apparatus (CAMAG). The lipid spots development was performed with methanol–acetic acid–pentane–chloroform (15:10:30:45, by vol.), which allowed the separation of phospholipids and neutral lipids on a 60-mm total migration distance. The scanning of the plates was carried out using a TLC scanner 3 (CAMAG), operating in the reflectance mode. The plates were scanned at 715 nm after dipping in a solution of Blue Spray (Sigma) (Blue Spray–4·2 M H2SO4-acetone, 1:2:3, by vol.) and heating for 3 min at 55°C. The different classes of phospholipids (sphingomyelin=SM, lyso-phosphatidyl-choline=LPC, phosphatidylcholine=PC, phosphatidylinositol=PI, phosphatidylserine=PS, phosphatidylethanolamine=PE, phosphatidylglycerol=PG, phosphatidic acid=PA, CL) were finally identified by comparing their R f with authentic standards and quantified using calibration curves of the same standards.
Fatty acid analysis of liver mitochondrial lipid extracts
Liver mitochondrial lipid extracts were mixed with 12·5 µg C17:0, as an internal standard, and their fatty acids were esterified by addition of acidified methanol, according to the method of Lepage & Roy( Reference Lepage and Roy 21 ). Briefly, the methylation reagent was generated by mixing sulphuric acid with methanol and butylated hydroxytoluen as antioxidant (50 mg/l), and the sample was heated at 90°C for 45 min to obtain the fatty acid methyl esters. After addition of sodium bicarbonate, distilled water and hexane, the sample was vortexed, centrifuged and the upper hexane layer was transferred to a glass vial, evaporated under a nitrogen stream at 37°C and dissolved in 0·5 ml isooctane–butylated hydroxytoluene for GC analysis. Individual fatty acid methyl esters were identified according to the retention times of standards by gas liquid chromatography (Trace GC Ultra; Thermo Fisher Scientific), with a Supelco Vax capillary column (30m×0·32 mm internal diameter×0·25 µm df), an AS-3000 autosampler and flame-ionisation detector. The fatty acid methyl esters were quantified using the chromatographic peak area according to the internal standard method. The fatty acid composition of mitochondrial lipids was compared in terms of the percentage content of various fatty acids.
Liver lipid mitochondrial desaturase and unsaturation indices
Because it is very difficult and tricky to directly measure the activity of the enzymes that catalyse the desaturation and elongation reactions in the fatty acid metabolic pathways, results in animals have supported the use of surrogate measures of desaturase activity such as the use of desaturase indices( Reference Warensjo, Riserus and Gustafsson 22 ). These indices are based on the ratio of product:precursor of individual fatty acids for a given desaturation reaction. The desaturase indices were thus calculated as follows: desaturase Δ9 (16 : 1n-7/16 : 0); desaturase Δ6 (18 : 3n-6/18 : 2n-6); and desaturase Δ5 (20 : 4(n-6)/20 : 3(n-6)). The unsaturation index (UI) was calculated from the relative percentage of each type of MUFA and PUFA multiplied by the number of double bonds present in the molecule( Reference Aoun, Fouret and Michel 12 ).
Immunoblotting for Western blot analysis
Frozen liver samples were homogenised using an Ultra Turax homogeniser in an ice-cold extraction buffer containing 20 mm TRIS-HCl, 150 mm NaCl, 1 mm EDTA, 0·5 % Triton X-100, 0·1 % SDS, 1 mm PMSF, 10 µm leupeptin and 1 µm pepstatin. Proteins (50 µg) were separated with 10 % SDS-PAGE and then transferred to a nitrocellulose membrane (90 min, 120 V). Membranes were blocked in 5 % fat-free milk for 1 h at room temperature. Then, membranes were incubated overnight with primary antibody against PPAR-γ coactivator 1α (PGC1-a) (Calbiochem) and CL synthase (CLS) (Abcam) in blocking buffer. After washes in TRIS-buffered saline/Tween under gentle agitation, membranes were incubated for one hour with horseradish-peroxidase-labelled antibody. After further washes, blots were treated with enhanced chemiluminescence detection reagents (ECL; ThermoScientific). β-Tubulin was used as loading reference, and blot intensities were measured using Image Lab™ Software 5.2.1 (Bio-Rad Laboratories). This analysis was performed in five separate runs (a run per time point for control and HFHFR samples).
Isolation of total RNA and real-time real-time quantitative PCR
Real-time quantitative PCR (RT-qPCR) was used to measure target gene mRNA expression in liver. Total RNA was extracted with Trizol reagent (Invitrogen). Reverse transcription reaction was performed with 2 μg of total RNA. Complementary DNA (cDNA) was synthesised with the use of SuperScript II Reverse Transcriptase for first-strand cDNA synthesis (Invitrogen) and Oligo (dT) primers. The mRNA expressions of target genes (CLS and mitochondrial transcription factor A (Tfam)) were determined by RT-qPCR, using IQTM SYBR Green Supermix with a MiniOpticon detection system (Bio-Rad). Results were expressed using the comparative cycle threshold (C t ) method: the ∆∆C t values were calculated in every sample for each gene of interest with RPS9 gene as the reference gene. The primer sequences used for real-time RT-PCR are the following: RPS9 forward GAAGCTGGGTTTGTCGCAAA, RPS9 reverse CGGAGCCCATACTCTCCAAT; CLS forward TGGATGGATTTATTGCTCGAAA, CLS reverse TGGGACTGGAATAAGATCTGCAT, Tfam forward AATGAAGTCTTGGGAAGAGCAA, Tfam reverse ACACTGCGACGGATGAGAT.
Statistical analysis
Results were expressed as means and standard deviations, six to eight animals per group per treatment duration. All the groups were tested for the effects of diet, treatment duration and their interaction by two-way ANOVA test. When the effects of diet, treatment duration or their interaction were significant, one-way ANOVA test was applied to analyse the effect of treatment duration for each diet followed up by a Fisher’s least significant difference test, and the unpaired Student’s t test was used to analyse the effect of HFHFR diet within each treatment duration point. For protein expression results, the analysis was carried out time by time, and thus comparison among time points was not possible; therefore, comparison was then made only between control and HFHFR diets inside of each time point by the unpaired Student’s t test. The limit of statistical significance was set at P<0·05. HFHFR diet v. control diet: * P<0·05, ** P<0·005, *** P<0·0005. Inside the same diet, over treatment durations, the means with different letters (a, b, c, d, e) are significantly different. Correlations were performed with the Spearman method. Statistical analyses were performed using the StatView program (SAS Institute).
Results
Rat characteristics and blood biochemical parameters
Dietary intake and energy intake were increased throughout the study in both rat groups, whereas the dietary intake was largely lower with the HFHFR diet by comparison with the control diet, but with similar energy intake in both groups, although this energy intake was higher on 12 and 16 weeks of diet intake (Table 1). As expected, rat body weight, as well as liver and adipose tissue weights, were gradually increased throughout the study under both diets, but these increases were much higher with the HFHFR diet, particularly the liver and adipose tissue weights (Table 1).
Table 1 Rat characteristics (Mean values and standard deviations; n 6–8 animals/group per treatment duration)
HFHFR, high-fat–high-fructose.
All the groups were tested for the effects of diet, treatment duration and their interaction by two-way ANOVA test. When the effects of diet, treatment duration or their interaction were significant, one-way ANOVA test was applied to analyse the effect of treatment duration for each diet followed up by a Fisher’s least significant difference test, and the unpaired Student’s t test was used to analyse the effect of HFHFR diet within each treatment duration point.
The limit of statistical significance was set at P<0·05. HFHFR diet v. control diet: * P<0·05, ** P<0·005, *** P<0·0005.
a,b,c,d,e Inside the same diet, over treatment durations, mean values with unlike superscript letters are significantly different.
Plasma glucose was significantly increased throughout the study (with a maximal value at 12 weeks of diet) and was significantly higher with the HFHFR diet compared with the control diet (Table 2). Plasma insulin level was significantly increased throughout the study in both rat groups (Table 2). Moreover, when considering the 8- to 20-weeks experimental period, plasma insulin levels were significantly increased with the HFHFR diet compared with the control diet (P<0·05). Consequently, HOMA-IR was also significantly increased throughout the study and was increased with the HFHFR diet compared with the control diet (Table 2). In agreement with these results, the OGTT showed that glucose intolerance was increased with the HFHFR diet compared with the control diet, which was maximal at 12 weeks of diet administration (Fig. 1).
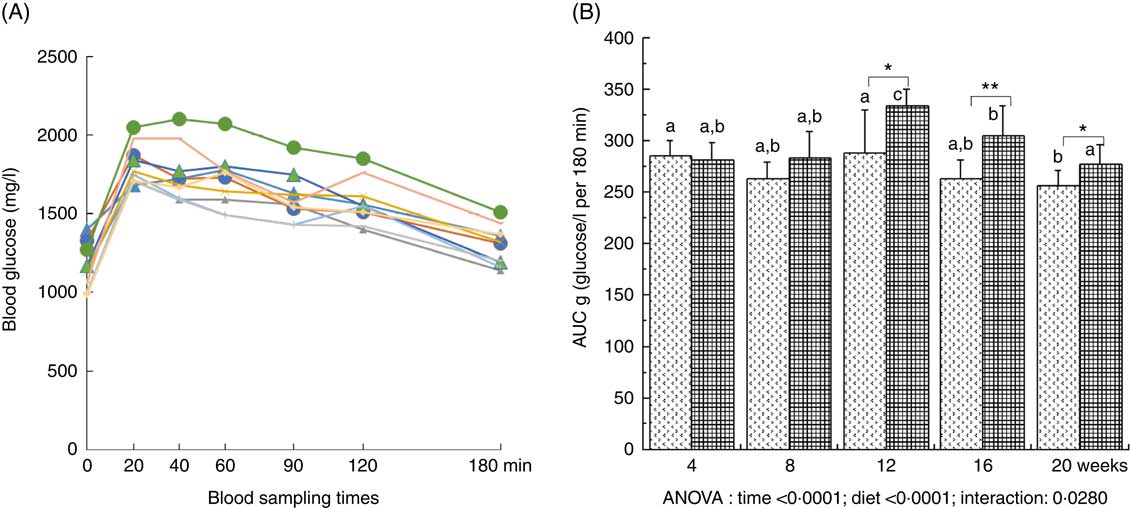
Fig. 1 Time-evolution of glucose intolerance in rats fed control (CTRL) or high-fat–high-fructose (HFHFR) diets for 4–20 weeks. A period of 6-h fasting rats received by oral administration 2·5 g glucose/kg body weight. Blood was sampled through the tail vein of conscious rats immediately before the oral administration, and 20, 40, 60, 90, 120 and 180 min afterwards and blood glucose was measured using glucose strips and a commercial glucometer (A). Total cumulative glucose levels for each treatment group are reported as AUC and were calculated by the trapezium method and expressed as g glucose/l per 180 min (B). Values are means (n 6–8 animals/group per treatment duration), and standard deviations. All the groups were tested for the effects of diet, treatment duration and their interaction by two-way ANOVA test. When the effects of diet, treatment duration or their interaction were significant, one-way ANOVA test was applied to analyse the effect of treatment duration for each diet followed up by a Fisher’s least significant. difference test, and the unpaired Student’s t test was used to analyse the effect of HFHFR diet within each treatment duration point. A: ![]() , 4 weeks/CTRL;
, 4 weeks/CTRL; ![]() , 4 weeks/HFHFR;
, 4 weeks/HFHFR; ![]() , 8 weeks/CTRL;
, 8 weeks/CTRL; ![]() , 8 weeks/CTRL;
, 8 weeks/CTRL; ![]() , 12 weeks/CTRL;
, 12 weeks/CTRL; ![]() , 12 weeks/CTRL;
, 12 weeks/CTRL; ![]() , 16 weeks/CTRL;
, 16 weeks/CTRL; ![]() , 16 weeks/CTRL;
, 16 weeks/CTRL; ![]() , 20 weeks/CTRL;
, 20 weeks/CTRL; ![]() , 20 weeks/CTRL. B:
, 20 weeks/CTRL. B: ![]() , CTRL diet;
, CTRL diet; ![]() , HFHFR diet. The limit of statistical significance was set at P<0·05. HFHFR diet v. control diet: * P<0·05, ** P<0·005. a,b Inside the same diet, over treatment durations, the mean values with unlike letters are significantly different.
, HFHFR diet. The limit of statistical significance was set at P<0·05. HFHFR diet v. control diet: * P<0·05, ** P<0·005. a,b Inside the same diet, over treatment durations, the mean values with unlike letters are significantly different.
Table 2 Metabolic plasma parameters (Mean values and standard deviations; n 6–8 animals/group per treatment duration)
HFHFR, high-fat–high-fructose; HOMA-IR, homoeostasic model assessment of insulin resistance (mm glucose×mU/l insulin)/22·5; ALAT, alanine transaminase.
All the groups were tested for the effects of diet, treatment duration and their interaction by two-way ANOVA test. When the effects of diet, treatment duration or their interaction were significant, one-way ANOVA test was applied to analyse the effect of treatment duration for each diet followed up by a Fisher’s least significant difference test, and the unpaired Student’s t test was used to analyse the effect of HFHFR diet within each treatment duration point.
The limit of statistical significance was set at P<0·05. HFHFR diet v. control diet: * P<0·05, ** P<0·005, *** P<0·0005.
a,b,c Inside the same diet, over treatment durations, mean values with unlike superscript letters are significantly different.
Serum levels of both TAG and total CHOL were gradually and significantly increased throughout the study in both diet groups, whereas HFHFR diet had no significant effect on these both parameters (Table 2). On the other hand, serum NEFA level, as well as serum ALAT level, a marker of liver damage indicative of both cellular leakage and loss of liver cell membrane functional integrity, were significantly decreased and increased, respectively, with the HFHFR diet compared with the control diet (Table 2).
Liver lipid content
Total liver fat (TAG, CHOL esters, free CHOL and NEFA) gradually increased throughout the study under both diets and plateaued on 12 weeks of diet intake. As expected, total liver fat was largely more increased under the HFHFR diet, in particular on 12 weeks of diet intake (Table 3). Thus, the hepatic steatosis, defined when intrahepatic lipid content exceeds 5 % of hepatic tissue( Reference Green and Hodson 23 ), was maximal at 12 weeks of HFHFR diet with a slight amelioration afterwards. When regarded individually, the liver TAG and CHOL ester contents were highly increased (TAG were 2·5 times increased compared to control rats at 12 weeks of diet), whereas CHOL and NEFA were only moderately increased under the HFHFR diet.
Table 3 Abundance of neutral lipids in liver lipid extract(Mean values and standard deviations; n 6–8 animals/group per treatment duration) (Mean values and standard deviations; n 6–8 animals/group per treatment duration)
HFHFR, high-fat–high-fructose.
All the groups were tested for the effects of diet, treatment duration and their interaction by two-way ANOVA test. When the effects of diet, treatment duration or their interaction were significant, one-way ANOVA test was applied to analyse the effect of treatment duration for each diet followed up by a Fisher’s least significant difference test, and the unpaired Student’s t test was used to analyse the effect of HFHFR diet within each treatment duration point.
The limit of statistical significance was set at P<0·05. HFHFR diet v. control diet: * P<0·05, ** P<0·005, *** P<0·0005.
a,b,c Inside the same diet, over treatment durations, mean values with unlike superscript letters are significantly different.
Mitochondrial biogenesis, mitochondrial characteristics and activity
The liver PGC1-a protein expression, considered as the major mitochondrial biogenesis factor, tended to be modified with the HFHFR diet compared with the control diet (P=0·09) with a highest expression at 12 weeks of HFHFR diet (Fig. 2). In addition, the gene expression of TFAM, PGC1-a-dependent gene and a regulator of mitochondrial biogenesis, decreased throughout the study, and this decrease was much more pronounced with the HFHFR diet compared with the control diet (Fig. 2). Finally, liver CS activity, commonly used as marker of mitochondrial content, was decreased throughout the study, but it remained similar with the control and HFHFR diets (Table 4).
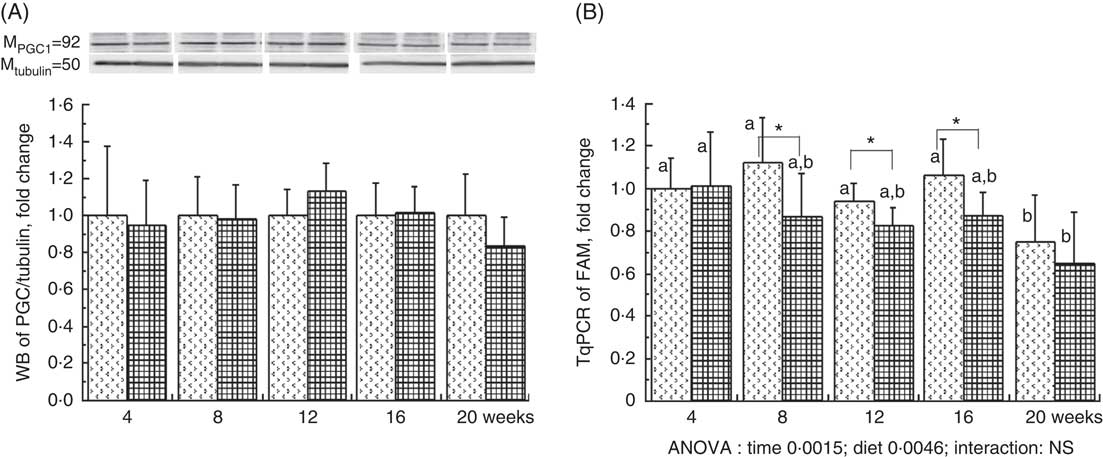
Fig. 2 Relative PPAR-γ coactivator 1α (PGC1-a) protein expression (A) and relative mitochondrial transcription factor A (Tfam) gene expression (B) in rats fed control (CTRL) or high-fat–high-fructose (HFHFR) diets for 4–20 weeks. Values are means (n 6–8 animals/group per treatment duration), and standard deviations. For PGC1-a protein expression, the statistical analysis was carried out time by time and thus comparison among time points was not possible. Comparison was then made only between control and HFHFR diets inside of each time point by the unpaired Student’s t test. For Tfam gene expression, the groups were tested for the effects of diet, treatment duration and their interaction by two-way ANOVA test. When the effects of diet, treatment duration or their interaction were significant, one-way ANOVA test was applied to analyse the effect of treatment duration for each diet followed up by a Fisher’s least significant difference test, and the unpaired Student’s t test was used to analyse the effect of HFHFR diet within each treatment duration point. ![]() , CTRL diet;
, CTRL diet; ![]() , HFHFR diet. The limit of statistical significance was set at P<0·05. HFHFR diet v. control diet: * P<0·05. a,b Inside the same diet, over treatment durations, the mean values with unlike letters are significantly different.
, HFHFR diet. The limit of statistical significance was set at P<0·05. HFHFR diet v. control diet: * P<0·05. a,b Inside the same diet, over treatment durations, the mean values with unlike letters are significantly different.
Table 4 Mitochondrial activity and mitochondrial membrane fluidity in liver (Mean values and standard deviations; n 6–8 animals/group per treatment duration)
AU, arbitrary units; HFHFR, high-fat–high-fructose; ROS, reactive oxygen species; β-HAD, β-hydroxyacyl-CoA dehydrogenase.
All the groups were tested for the effects of diet, treatment duration and their interaction by two-way ANOVA test. When the effects of diet, treatment duration or their interaction were significant, one-way ANOVA test was applied to analyse the effect of treatment duration for each diet followed up by a Fisher’s least significant difference test, and the unpaired Student’s t test was used to analyse the effect of HFHFR diet within each treatment duration point. Membrane potential expressed as fluorescence of rhodamine 123 in the presence of substrates (malate/glutamate/succinate) and ADP. Mitochondrial ROS production expressed as fluorescence of 2′,7′-dichlorofluorescein diacetate in the presence of substrates (malate/glutamate/succinate) and ADP. Mitochondrial respiration was measured in the presence of substrates (malate/glutamate/succinate) and ADP.
The limit of statistical significance was set at P<0·05. HFHFR diet v. control diet: * P<0·05, ** P<0·005, *** P<0·0005.
a,b,c,d Inside the same diet, over treatment durations, mean values with unlike superscript letters are significantly different.
Mitochondrial membrane potential and mitochondrial respiration and ROS production were differently altered throughout the study. Indeed, mitochondrial membrane potential remained stable throughout the study but was increased with the HFHFR diet compared with the control diet (Table 4). On the other hand, mitochondrial respiration and ROS production were decreased and increased, respectively, throughout the study but remained similar between both tested diets.
The enzymatic activity of liver mitochondrial complex I remained unchanged throughout the study but was decreased with the HFHFR diet compared with the control diet (Table 4). Complex II and complexes II+III activities were altered throughout the study and were decreased with the HFHFR diet compared with the control diet. Complex IV (COX) activity was decreased throughout the study but remained unchanged with the HFHFR diet compared with the control diet. Finally, in the present study, mitochondrial β-HAD activity was increased throughout the study and largely increased with the HFHFR diet compared with the control diet (Table 4).
Mitochondrial phospholipid classes
The total phospholipid content in the liver mitochondria was slightly decreased throughout the study without significant effect of the HFHFR diet compared with the control diet (Table 5). More specifically, the content of the major phospholipid, PC, was increased in liver mitochondria during the study similarly with both tested diets. The contents of the second major phospholipid, PE, and the PI were also decreased during the study with less impact with the HFHFR dietcompared with the control diet. Consequently, the PC:PE ratio was increased throughout the study and decreased with the HFHFR diet compared with the control diet. Less expected is the large decrease in SM content throughout the study and slightly under the HFHFR diet. More interestingly, the mitochondrial CL content was increased throughout the study and under the HFHFR diet (Table 5). The CL content was maximal at 8–12 weeks, under both diets, the maximal value being 10 % higher with HFHFR compared with control diet, whereas these increases were attenuated at 16 and 20 weeks with both diets. However, although CLS protein and gene expression remained stable throughout the study, both of them decreased with the HFHFR diet (Fig. 3).
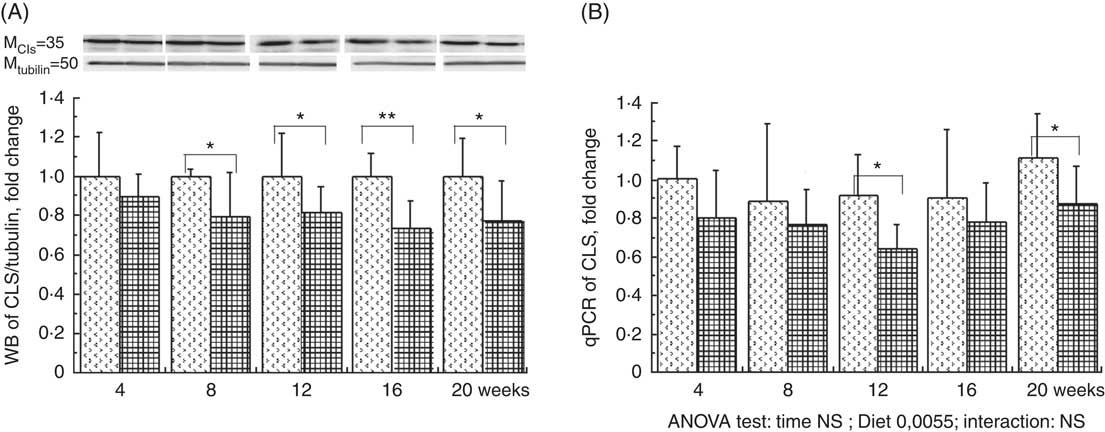
Fig. 3 Relative protein (A) and gene (B) expression of cardiolipin synthase (CLS) in rats fed control (CTRl) or high-fat–high-fructose (HFHFR) diets for 4–20 weeks. Values are means (n 6–8 animals/group per treatment duration), and standard deviations. For CLS protein expression, the analysis was carried out time by time and thus comparison among time points was not possible. Comparison was then made only between control and HFHFR diets inside of each time point by the unpaired Student’s t test. For gene expression, the groups were tested for the effects of diet, treatment duration and their interaction by two-way ANOVA test. When the effects of diet, treatment duration or their interaction were significant, one-way ANOVA test was applied to analyse the effect of treatment duration for each diet followed up by a Fisher’s least significant difference test, and the unpaired Student’s t test was used to analyse the effect of HFHFR diet within each treatment duration point. ![]() , CTRL diet;
, CTRL diet; ![]() , HFHFR diet; qPCR, quantitative PCR. The limit of statistical significance was set at P<0·05. HFHFR diet v. control diet: * P<0·05, ** P<0·005, *** P<0·0005.
, HFHFR diet; qPCR, quantitative PCR. The limit of statistical significance was set at P<0·05. HFHFR diet v. control diet: * P<0·05, ** P<0·005, *** P<0·0005.
Table 5 Abundance of phospholipid classes in liver mitochondrial lipid extract (Mean values and standard deviations; n 6–8 animals/group per treatment duration)
HFHFR, high-fat–high-fructose; PC, phosphatidylcholine; PE, phosphatidylethanolamine; PI, phosphatidylinositol; SM, sphyngomyelin; PS, phosphatidylserine; CL, cardiolipin.
All the groups were tested for the effects of diet, treatment duration and their interaction by two-way ANOVA test. When the effects of diet, treatment duration or their interaction were significant, one-way ANOVA test was applied to analyse the effect of treatment duration for each diet followed up by a Fisher’s least significant difference test, and the unpaired Student’s t test was used to analyse the effect of HFHFR diet within each treatment duration point.
The limit of statistical significance was set at P<0·05. HFHFR diet v. control diet: * P<0·05, ** P<0·005, *** P<0·0005.
a,b,c,dInside the same diet, over treatment durations, mean values with unlike superscript letters are significantly different.
Fatty acid composition of liver mitochondrial phospholipids and desaturase indices
Major fatty acid composition of liver mitochondrial phopholipids was altered throughout the study and especially with the HFHFR diet since the 4th week of diet (Table 6). Indeed, total SFA percentage was decreased throughout the study, because palmitic acid remained stable, whereas stearic acid was significantly decreased. As expected, total SFA percent was increased under the HFHFR diet, which was only owing to the increase in palmitic acid, whereas stearic acid remained unchanged. The percentage of the individual minor MUFA (C16 : 1n-9, C16 : 1n-7, C18 : 1n-7) was significantly increased, whereas the major MUFA, C18 : 1n-9, was only slightly increased throughout the study. Under the HFHFR diet, the percentage of total MUFA was largely increased, principally owing to the increase in the major MUFA, C18 : 1n-9 (+200 %), in spite of a decrease in the two other MUFA, C16 : n-7 and C18 : 1n-7 (Table 6, online Supplementary Fig. S1). Finally, the percentage of PUFA was decreased throughout the study (particularly C20 : n-6 and C22 : 6n-3) and under the HFHFR diet compared with the control diet, including all the five major PUFA. It is also noticeable that linoleic (18 : 2n-6), α-linolenic (18 : 3n-6) and dihomo-γ-linolenic (20 : 3n-6) acids were minimal at 12 weeks of HFHFR diet, whereas the percentage of palmitoleic (16 : 1n-7) and vaccenic (18 : 1n-7) acids was maximal at 12 weeks of HFHFR diet (Table 6).
Table 6 Fatty acid composition (%) of liver mitochondrial lipids (Mean values and standard deviations; n 6–8 animals/group per treatment duration)
HFHFR, high-fat–high-fructose; UI, unsaturation index.
All the groups were tested for the effects of diet, treatment duration and their interaction by two-way ANOVA test. When the effects of diet, treatment duration or their interaction were significant, one-way ANOVA test was applied to analyse the effect of treatment duration for each diet followed up by a Fisher’s least significant difference test, and the unpaired Student’s t test was used to analyse the effect of HFHFR diet within each treatment duration point.
The limit of statistical significance was set at P<0·05. HFHFR diet v. control diet: * P<0·05, ** P<0·005, *** P<0·0005.
a,b,c,d Inside the same diet, over treatment durations, mean values with unlike superscript letters are significantly different.
† UI=(% monoenoic×1)+(% dienoic×2)+(% trienoic×3)+(% tetraenoic×4)+(% pentaenoic×5)+(% hexaenoic×6).
The UI of mitochondrial phospholipids fatty acids was non-significantly decreased throughout the study and significantly decreased with the HFHFR diet compared with the control diet (Table 6). This decreased UI was in agreement with the decrease in the percentage of PUFA throughout the study and under the HFHFR diet compared with the control diet. Regarding the fatty acid desaturase activities, the respective indices of the two desaturases (Δ9=(16 : 1n-7/16 : 0) and Δ5)=(20 : 4n-6/20 : 3n-6) were altered throughout the study and were decreased markedly with the HFHFR diet compared with the control diet, whereas the Δ6 desaturase index (18 : 3n-6/18 : 2n-6) only tended to be modified with the HFHFR diet (Table 6). This is in agreement with the above reported decreases in the percent of PUFA and in the UI.
Table 7 Relation of liver cardiolipin (CL) content in mitochondria and mitochondrial activity* (Spearman’s ρ; n 6–8 animals/group per treatment duration)
AU, arbitrary units; ROS, reactive oxygen species.
* Correlations were performed with the Spearman method.
Discussion
Hyperlipidic–hyperenergetic diets are now frequently consumed in modern societies, coupled with low levels of physical activity. These factors contribute importantly to the development of pathological conditions, which include obesity, dyslipidaemia, NAFLD, IR and diabetes. The exact sequence of events leading to metabolic alterations and NAFLD installation and progression, in particular mitochondrial structure alteration and dysfunction and their interrelation, still remains to be characterised. This study aimed to explore the time-evolution of liver mitochondrial structure and function changes associated with hepatic steatosis installation and progression in rats fed an obesogenic diet for 4–20 weeks. These time intervals are interesting because they cover short-term (4 weeks), usual-term (12 weeks) and long-term (20 weeks) dietary interventions. In this study, the HFHFR diet tested, rich in fat and fructose, has been shown to be efficient in inducing moderate overweight, increased liver and adipose tissue weights, hyperglycaemia and hyperinsulinaemia since the 8th week of diet. The hepatic enlargement reflected an overt hepatic steatosis, objectivised principally by an increased level of liver TAG and CHOL ester and plasma ALAT activity. In addition, the mitochondrial phospholipids PC/PE ratio was decreased with the obesogenic diet, which has been previously linked to NAFLD( Reference Arendt, Ma and Simons 24 ).
In the present study, we have investigated five time points up to 20 weeks and we have carried out a control group and a HFHFR group at each studied time point. Indeed, rare are the dietary studies that lasted as long as 20 weeks. In a rat study as long as ours, Bai et al.( Reference Bai, Li and Yang 26 ) showed that rat hepatic steatosis was established since the 8th weeks and remained stable until the end of their study at 20 weeks. However, Ferramosca et al. ( Reference Ferramosca, Conte and Burri 25 ) showed that hepatic steatosis installation (TAG and CHOL contents) in rat started since the 4th weeks and was increased gradually in their study points at 6, 8 and 12 weeks. In contrast, Gauthier et al.( Reference Gauthier, Favier and Lavoie 5 ) have observed in female rats that liver lipid content was increased rapidly (+200 %) during the first 2 weeks but was decreased between 2 and 6 weeks and was re-increased slightly between 6 and 16 weeks. Finally, in a mice study, Satapati et al.( Reference Satapati, Sunny and Kucejova 27 ) reported that hepatic steatosis was established since the 8th weeks and was increased in their study points at 16 and 32 weeks. It is possible that the observed differences in the installation and progression of hepatic steatosis between these cited results and our results may be due to the quality of fats used in these two studies. Indeed, Bai et al.( Reference Bai, Li and Yang 26 ) and Satapati et al.( Reference Satapati, Sunny and Kucejova 27 ) have used fat diets composed of 35 % of lard only, whereas we have used a mixed fat diet (lard + palm oil + cocoa butter) to increase the saturated fatty acid percentage in our high-fat diet. Moreover, it is not impossible that there is an important species difference between rat and mouse regarding installation and progression of hepatic steatosis on obesogenic diets.
It is well documented that fat intake alters mitochondrial lipid oxidation and composition, which can affect mitochondrial function and structure. Liver mitochondria play a fundamental role in the development, perpetuation and worsening of hepatic steatosis and NAFLD. Most, if not all, liver functions are dependent on energy, an ingredient that is primarily generated by the mitochondrion, the power house of all cells. Dysfunctional mitochondria lead to a shortage in ATP, a leakage of deleterious ROS and an excessive storage of fats. As mitochondria are the main producers of both cellular energy and free radicals, dysfunctional mitochondria play an important role in the development of IR and ectopic fat storage in the liver, thus supporting the emerging idea that mitochondrial dysfunction is closely related to the development of obesity, NAFLD and type-2 diabetes mellitus. Many studies have been conducted these past 20 years to investigate the interrelation between mitochondrial dysfunction and installation and progression of NAFLD or IR( Reference Rogge 28 , Reference Dumas, Simard and Flamment 29 ). Some of them have specifically questioned whether mitochondrial dysfunction is a cause or a direct/an indirect consequence of NAFLD or IR. These studies, carried out in rats or in mice, varied in their fat quality and quantity with or without fructose/sucrose and varied in their experiment durations and measured parameters. Some studies have concluded that mitochondrial dysfunction precedes NAFLD or IR( Reference Kahle, Schafer and Seelig 30 , Reference Rector, Thyfault and Uptergrove 31 ), whereas other studies have reported opposite conclusions or were unable to conclude( Reference Flamment, Rieusset and Vidal 32 ). Because the available literature data have still not resolved this point, we have carried out this study to re-address this question.
In our study, the ex vivo investigation of liver mitochondrial function objectivised by mitochondrial respiration and mitochondrial ROS production showed that mitochondrial respiration was decreased, whereas mitochondrial ROS production was increased throughout the study, but there was no significant difference between control and HFHFR groups at any time. However, the results of the current work showed a significant defect in mitochondrial respiratory chain complexes in the liver of obesogenic rats. Specifically, this defect was objectivised by a decreased activity of mitochondrial complexes I, II since the 12th week, whereas the decreased activity of mitochondrial complexes II+III was already observed since the 4th week, although complex IV remained unchanged. To afford the high flux of lipid substrates to the mitochondria, the enzymatic activity of β-HAD, a crucial key in mitochondrial fatty acid oxidation, has been more than doubled in the liver of obesogenic rats since the 4th week of the study. In addition, the gene expression of Tfam, an essential protein that regulates both mitochondrial transcription initiation and mtDNA copy number, was decreased since the 8th week and continued over 12 and 16 weeks. Surprisingly, these significant alterations in mitochondrial respiratory chain complexes do not seem related to differences in the hepatic mitochondria content between obesogenic and control groups, as indicated by the similar liver CS activity and protein PGC1-a expression observed in both groups throughout the study. Our results are in agreement with previous reported defects in mitochondrial respiratory chain enzyme complexes in obesogenic rats. Garnol et al.( Reference Garnol, Endlicher and Kucera 33 ) have reported decreased activity of complex I in hepatocytes isolated from rats fed a high-fat diet compared with controls fed a standard diet. In addition, Liu et al.( Reference Liu, Zhang and Ming 34 ) have reported that 12 weeks of high-fat diet impaired activities of mitochondrial respiratory chain and β-oxidation in NAFLD in rats. The major part of these mitochondrial alterations nearly paralleled the installation and progression of hepatic steatosis and it seems difficult to conclude whether these alterations precede or follow the hepatic steatosis in the conditions of this experiment (online Supplementary Fig. S2).
The mitochondrial alterations observed in this study may be also originated from changes in the content and/or the composition of mitochondrial membrane phospholipids. Indeed, membrane phospholipids play multiple roles in mitochondria, acting as donors in the synthesis of macromolecules and actively influencing the functional properties of membrane-associated processes, in particular mitochondrial respiratory chain complexes( Reference Dowhan 35 ). Therefore, we have investigated the characteristics and the composition of mitochondrial membrane, in particular membrane potential, as well as the phospholipids and the fatty acids composition of these membranes. Indeed, mitochondrial membrane potential was nearly significantly increased (ANOVA P=0·0561) with the obesogenic diet, whereas the membrane fluidity was significantly decreased as objectivised by a significant decrease in the PC:PE ratio. It is admitted that membrane phospholipid species content and chain length of phospholipid fatty acyl chains and their unsaturation may also alter membrane fluidity. Therefore, we have investigated the mitochondrial phospholipid species content, the unsaturation and the composition of phospholipid fatty acyl chains.
Three out of six mitochondrial membrane phospholipids (PE, PI and CL) were significantly increased with the HFHFR diet, whereas total phospholipids were only non-significantly increased. Although these increases were observed since the 4th week, these increases were all significant on the 16th week of diet. As a consequence, the increase in PE content resulted in a decreased PC:PE ratio and thus membrane fluidity( Reference Tepsic, Ristic and Ristic 36 ). The decreased membrane fluidity may be responsible at least partly for the decreased activity of respiratory chain complexes. Membrane fluidity and respiratory chain complex activity are also determined by the nature of the fatty acids present in each phospholipid and their UI. Indeed, changes in membrane fatty acid composition were rapidly achieved, as soon as 4 weeks of HFHFR diet with a significant increase in SFA and MUFA and a significant decrease in PUFA. In addition, UI was lower with the HFHFR diet, resulting from lower PUFA content only partially compensated by higher MUFA content. These decreases in PC/PE ratio and in UI should lead to a decrease in mitochondrial membrane fluidity. However, the animals can preserve structural homoeostasis through control of phospholipid synthesis, and, in particular, a previous report demonstrated that the fluidity of the mitochondrial lipid bilayer increased with CL concentration, indicating that CL reduced the packing of the membrane( Reference Unsay, Cosentino and Subburaj 7 ). The content of CL in liver mitochondria was increased in the first weeks with the HFHFR diet to reach a maximal value at 12 weeks of HFHFR diet, and then returning towards the control value at 20 weeks of diet. The mitochondrial CL content was positively correlated to in vitro measures of mitochondrial membrane potential and respiration (Table 7). Thus, the increase of CL content during the 1st weeks of HFHFR diet might preserve mitochondrial bioenergetic function. In accordance with that, we and others( Reference Aoun, Fouret and Michel 12 , Reference Fouret, Tolika and Lecomte 37 , Reference Stavrovskaya, Bird and Marur 38 ) have reported increased CL content with HFHFR diet. Increase in CL content may be driven by an increase in overall CL synthesis or a decrease in CL degradation. However, CLS gene and protein expression was lower with the HFHFR diet than the control diet, suggesting decreased CL degradation. Nevertheless, increased CLS activity to compensate for the decreased CL protein expression cannot be excluded. Therefore, CL content probably first increased with increased FA supply to the liver as an efficacious compensatory response. Then the capacity of CLS to favour synthesis of CL, even with low CLS protein expression, may be overwhelmed after 12 weeks of diet, leading to lower CL content. In fact, many studies have shown decreased CL content in diabetes and non-alcoholic steatohepatitis, advanced stage of IR and hepatic steatosis( Reference Feillet-Coudray, Fouret and Casas 39 ). The increase in CL content with the HFHFR diet probably contributes to preserve the bioenergetic function of the mitochondria and compensates for the altered PC/PE ratio that affects membrane properties.
Conclusion
Our results showed once again the deep interrelation between hepatic steatosis development and mitochondrial dysfunction, in particular decreased fluidity, decreased activity of certain mitochondrial respiratory complexes and increased β-HAD activity and high modulation of mitochondrial phospholipids, in particular CL content, and their fatty acid composition. Determining whether the mitochondrial dysfunction precedes or follows the hepatic steatosis is an important health issue for both prevention and treatment of this pathology. Unfortunately, based on these results it is still difficult to say whether the mitochondrial alterations preceded or followed the installation of the hepatic steatosis. Because both hepatic steatosis and mitochondrial alterations occur as early as 4 weeks of diet, future studies should consider these four 1st weeks to reveal the exact interconnection between these two major consequences of obesogenic diet intake.
Acknowledgements
The authors acknowledge the financial support of the National Institute for Agronomic Research and in particular the Human nutrition Department (Alim-H department). The authors wish also to thank the animal staff from Metamus DMEM facility which belongs to Montpellier animal facilities network (RAM, Biocampus).
Author contributions were as follows: study design and literature search: C. F.-C., S. G. and C. C., data collection: G. F., B. B., F. D., B. B., statistical analysis and manuscript preparation: (E. B., C. C. and C. F.-C., data interpretation: C. F.-C., J. L., E. B., C. C., funds collection: C. F.-C. and C. C..
The authors declare that there are no conflicts of interest.
Supplementary material
For supplementary material/s referred to in this article, please visit https://doi.org/10.1017/S0007114517003713


