Introduction
Protected areas (PAs) are created worldwide to ensure the long-term conservation of biological diversity and ecological processes (Meffe and Carroll Reference Meffe and Carroll1994), and their designation is the most traditional and widespread tool to face the ongoing loss of biodiversity (UN 1992, Pullin Reference Pullin2004, Jackson et al. Reference Jackson, Evans and Gaston2009). However, there is a considerable debate on the overall effectiveness of PAs in preserving habitats and species (Cabeza Reference Cabeza2013, Geldmann et al. Reference Geldmann, Barnes, Coad, Craigie, Hockings and Burgess2013), emphasised by the paucity of quantitative studies on this issue. For example, < 5% of studies on the effectiveness of PAs are based on quantitative assessments, and even fewer are studies that measure the impact of PAs on populations (Rayner et al. Reference Rayner, Lindenmayer, Wood, Gibbons and Manning2014). Quantitative studies are probably lacking because they require long-term monitoring records, which are costly and time-consuming. In addition, proper assessment of PA effectiveness would require comparison with long-term monitoring records of the same species in non-protected areas (NPAs), but these data are usually even scarcer than those in PAs (Boakes et al. Reference Boakes, McGowan, Fuller, Chang-qing, Clark, O’Connor and Mace2010).
In Europe, modern PAs have been established since 1909 (Chape et al. Reference Chape, Spalding and Jenkins2008) following the model of national parks in the USA. Since then, the number and the total area of PAs have greatly increased, particularly after the Second World War (EEA 2012). However, the criteria according to which PAs were designed varied markedly among countries or even between administrative regions within them. Indeed, PAs in Europe range from Strict Nature Reserves (IUCN protection category I; see EEA 2012 for details) to managed agricultural landscapes (outside IUCN protection categories). Most European PAs are not reserves where all human activities are excluded; rather, they are managed to fulfil both wildlife protection and socio-economic demands (EC 2002).
In this paper, we aimed to assess the effectiveness in conserving bird communities of the system of PAs of Lombardy (c.24,000 km2), an administrative Region of Northern Italy. Lombardy has a remarkable network of PAs with different levels of nature protection (Table 1; Figure 1). For the sake of the present study, we differentiated PAs into two categories: “Regional Parks” (RPs) and “Nature Reserves” (NRs). The basic distinction between these categories is that RPs are complex systems integrating different natural or cultural values and features, which require coordinated management approaches. In contrast, NRs require more restrictive management approaches because they aim at preserving specific natural features (Sinibaldi and Tallone Reference Sinibaldi, Tallone and Tamburelli2008; see also Materials and Methods and Table 1 for further details).
Table 1. Protected areas of Lombardy, their relevance, and classification for the purposes of the present study.
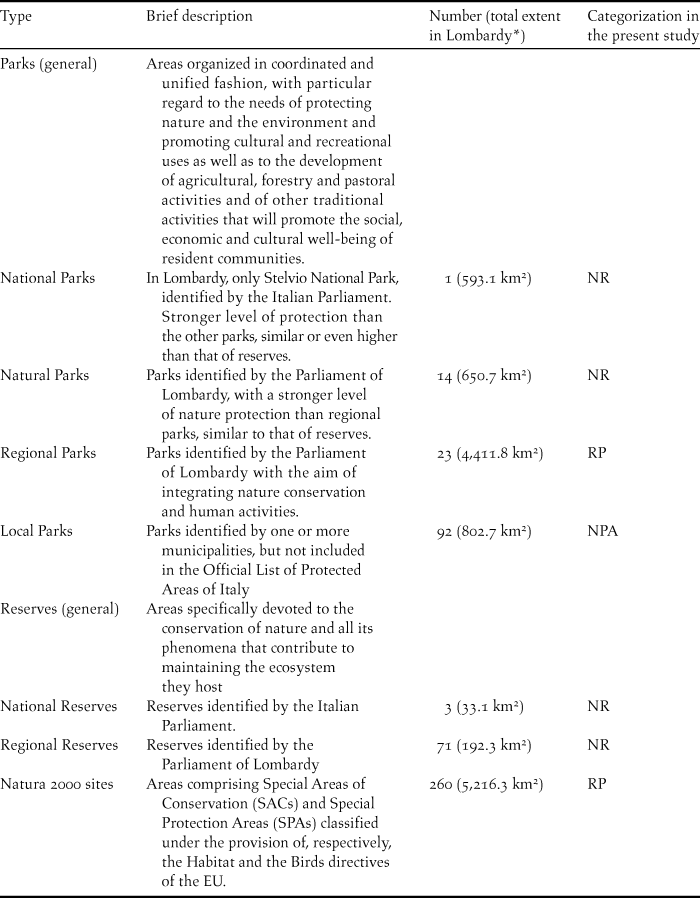
* Boundaries of PAs may overlap.
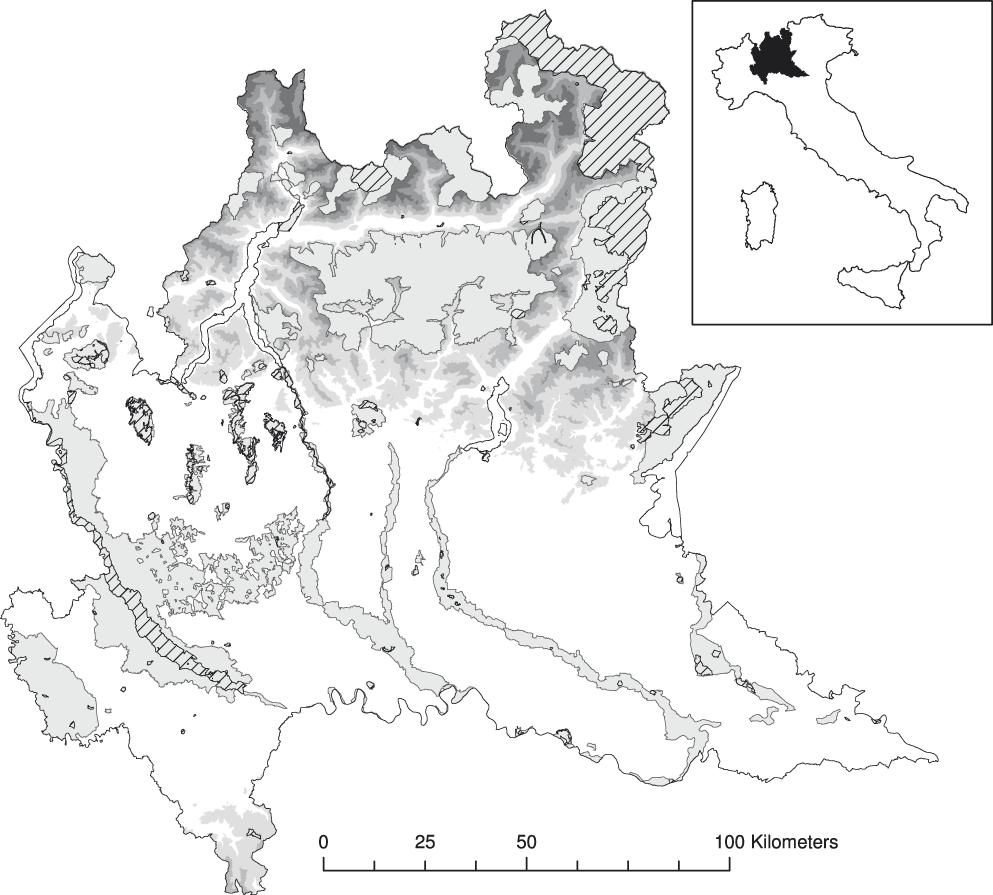
Figure 1. Protected areas of Lombardy according to protection category. Light grey: regional parks and Natura 2000 sites (RPs), simple hatched: national park and nature reserves (NRs). Orography is shown in grey scale, but hidden under protected areas for clarity of representation.
Scientific management of PAs requires permanent monitoring of the environment, including populations not only of species of conservation concern, but also of common species (Lindenmayer and Likens Reference Lindenmayer and Likens2010, Primack Reference Primack2012), which usually provide the majority of ecosystem processes (Gaston Reference Gaston2011). Furthermore, monitoring is essential to obtain information needed to plan appropriate management actions to ensure conservation of the overall biodiversity (Balmford et al. Reference Balmford, Green and Jenkins2003, Sekercioglu Reference Sekercioglu2006). However, for practical reasons, the large majority of monitoring studies carried out in European PAs focus on one or few target species, often those of conservation concern (Pellissier et al. Reference Pellissier, Touroult, Julliard, Siblet and Jiguet2013; but see Devictor et al. Reference Devictor, Godet, Juliard, Couvet and Jiguet2007 and Pellissier et al. Reference Pellissier, Touroult, Julliard, Siblet and Jiguet2013 for remarkable exceptions).
Birds are one of the most commonly used vertebrate taxa in conservation studies, mainly because large datasets on abundance and distribution of species are available in several areas of the world (Eglington et al. Reference Eglington, Noble and Fuller2012). In addition, birds include species at all trophic levels, so that the conservation status of bird communities is often used as an indicator of other taxa (Donald et al. Reference Donald, Green and Heath2001, Gregory et al. Reference Gregory, Noble, Field, Marchant, Raven and Gibbons2003). We took advantage of a large dataset of annual censuses of breeding birds collected by means of point counts in 1992–2013 all over Lombardy (Bani et al. Reference Bani, Massimino, Orioli, Bottoni and Massa2009; Figure S1 in the online supplementary material). This dataset allowed us to calculate annual indices of population occurrence for 54 species over 18 years in NRs, RPs, and NPAs. Since we had a rather long time-series of occurrence for each species, we could also calculate temporal trends in such indices within each type of PA. Hence, our assessment of the effectiveness of the Lombardy PAs system relied on complementary pieces of information, allowing assessment and comparison of both average occurrence and temporal trend in the occurrence of each species in areas with different levels of protection, including NPAs.
In the present work, PAs were considered effective in preserving bird communities if either: i) occurrence was larger or ii) occurrence increased more (or decreased less) in them than in NPAs. We considered one of the two aforementioned conditions as sufficient to confirm that PAs are effective because: i) PAs that currently host larger number of birds than NPAs show their effectiveness in protecting birds; ii) PAs that are currently allowing larger increases (or lower decreases) in bird occurrence will probably sustain a larger number of individuals than NPAs in the future (see Donald et al. Reference Donald, Sanderson, Burfield, Bierman, Richard and Waliczky2007 for a similar approach). We expected Lombardy PAs to be effective in protecting bird communities; therefore, we predicted mean values of occurrence indices to be higher in PAs (both NRs and RPs) than in NPAs and/or temporal trends to be more positive in PAs than in NPAs.
Common birds have shown divergent trends over recent decades in Europe according to their breeding habitat, with farmland birds typically showing sharp declines, while woodland species remained stable (PECBMS 2012). Lombardy is no exception to this general pattern (Bani et al. Reference Bani, Massimino, Orioli, Bottoni and Massa2009). We therefore tested whether PAs were effective in conserving bird populations grouped by these categories. We expected woodland species to occur more often and to have increased their occurrence most in NRs, at an intermediate level in RPs and least in NPAs because several NRs in Lombardy were established in residual old woodlands. Predictions for farmland birds were more difficult because farmland areas are less represented in NRs, and agricultural practices in RPs are rather similar to those in NPAs. We had therefore no clear expectations on the occurrence and on the temporal trend of farmland birds in PAs and NPAs of Lombardy. Furthermore, migrant birds show marked declines both at European scale (Sanderson et al. Reference Sanderson, Donald, Pain, Burfield and van Bommel2006) and in Lombardy (Bani et al. Reference Bani, Massimino, Orioli, Bottoni and Massa2009), with long-distance migrants suffering the most negative population trends. We therefore investigated whether occurrence and temporal trend of birds with different migration behaviour differed among NRs, RPs and NPAs. In this case, we expected average occurrence to be higher and/or its trend to be more positive (or less negative) in PAs in general than in NPAs.
Methods
Study area and field methods
Lombardy is one of the most densely populated (> 400 inhabitants/km2) and industrialised regions of Europe (according to Eurostat, in 2013 it had the second highest GDP among the second level territorial units of the EU; http://ec.europa.eu/eurostat/, accessed on June 10, 2016), and has a remarkable network of protected areas covering 27.8% of its surface area (Figure 1; Geoportal of Lombardy, http://www.cartografia.regione.lombardia.it/geoportale/ptk, accessed on June 10, 2016).
Point counts were performed in 1992, 1995, 1996, and 1999–2013 for monitoring breeding birds (Bani et al. Reference Bani, Massimino, Orioli, Bottoni and Massa2009). Data were collected during the main breeding season (10 May–20 June) from sunrise to 11h00, in good weather conditions (sunny to cloudy, with no rain or strong wind; Blondel et al. Reference Blondel, Ferry and Frochot1981, Fornasari et al. Reference Fornasari, Bani, de Carli and Massa1998). Location of point counts was chosen in each year according to a stratified sampling design, with a minimum distance of 500 m between locations. Figure S1 shows the spatial distribution of point counts in Lombardy. Further details on sampling methods are provided in Bani et al. (Reference Bani, Massimino, Orioli, Bottoni and Massa2009).
Data management
For the purposes of the present study, the territory of Lombardy was schematically divided into three categories (‘protection categories’ hereafter), according to presence or absence of PAs and to the different degrees of nature protection in each PA. The first category was “nature reserves” (NRs), which included PAs specifically designed for the conservation of nature. It included 74 reserves (both national and regional) covering on average 2.6 (0.7 SE) km2 (see Table 1 for details); 14 natural parks covering on average 46.5 (19.2 SE) km2; and the only national park in Lombardy (Stelvio National Park, 593.1 km2). Inclusion of natural and national parks in the NRs category is justified by the generally stronger level of regulation of human activities in these parks than in the regional parks of Lombardy (Table 1). Total extent of NRs was 1,403.9 km2.
The second category was “regional parks” (RPs), which included PAs designed for both protecting nature and promoting sustainable human activities. It included 23 regional parks covering on average 191.8 (52.1 SE) km2 and 260 Natura 2000 (N2000) sites, covering 20.1 (3.7 SE) km2 on average. The N2000 network of PAs was established by the European Union (EU) in response to the Rio the Janeiro Convention on Biological Diversity of 1992, with the double aim of conserving biodiversity and ensuring the sustainability of human activities (EC 2002, Cabeza Reference Cabeza2013; see also Table 1). After accounting for partial overlap among different protected areas, the total area of RPs was 6,461.9 km2. The third protection category consisted of non-protected areas (NPAs) and was composed of areas outside PAs. Total area of NPAs was 17,370.3 km2.
Other kinds of protected areas exist in Lombardy. Local Parks are identified by one or more municipalities, but have a very low level of nature protection, and are not included in the Official List of Protected Areas of Italy (http://www.minambiente.it/sites/default/files/archivio/normativa/dm_27_04_2010.pdf). We therefore considered these areas as NPAs. Wetlands protected under the Ramsar convention and areas protected under the UNESCO Man and Biosphere programme overlap with natural parks and reserves, and were therefore considered NRs. We stress that we were forced to reduce the number of protection categories in order to base comparison on a minimum number of point counts and species and that a certain degree of heterogeneity in the level of nature protection exists within each group of PAs. Nevertheless, we are confident that our categorisation was able to capture the degree of nature protection ensured by the different types of PAs of Lombardy.
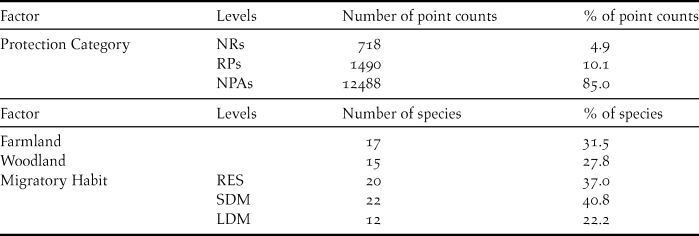
Each point count was assigned to a ‘protection category’ (three-level factor), accounting for the point being within NRs, RPs or NPAs (see Table 2). Points performed in areas where NRs and RPs overlap were considered in NRs. This is justified by the general stronger level of protection in NRs than in RPs.
Table 2. Number and percentage of point counts performed in each protection category, and of species classified as farmland or woodland and according to their migratory habit.
Land use strongly influences bird communities (Wiens Reference Wiens1989). We therefore calculated the proportional extent of farmlands (arable, rice fields and meadows), woodlands (broadleaved, coniferous and mixed forests, including reforestation), urban areas (residential, industrial and commercial areas, including urban green areas, and infrastructures), and open non-farmland environments (mountain grasslands, areas with sparse vegetation, rocks and riverbeds) in a radius of 150 m from the point, as obtained from digital maps of land use. Since our study spanned 22 years, and several digital land use maps were released during these years, we selected the digital land use map temporally closest to each survey year (CLC90, released in 1990, for survey years 1992–1996; DUSAF 1.1, released in 2001, for survey years 1999-2004; and DUSAF 2.1, released in 2007, for survey years 2005–2013; CLC90 is available at http://www.eea.europa.eu/, DUSAF 1.1 and DUSAF 2.1 are available at www.geoportale.regione.lombardia.it/; accessed June 10, 2016).
Bird species were classified according to their migratory behaviour in three levels according to ‘migratory habit’ indicating whether in Lombardy they are residents (RES), short-distance migrants (SDM) or long-distance migrants (LDM; Table S1). Migratory habit was deduced by comparing information and maps from atlases of breeding (Brichetti and Fasola Reference Brichetti and Fasola1990) and wintering (Fornasari et al. Reference Fornasari, Bottoni, Massa, Fasola, Brichetti and Vigorita1992 ) birds in Lombardy, and by data on migratory movements in Italy (Spina and Volponi Reference Spina and Volponi2008a,Reference Spina and Volponib). Bird species were also classified as being ‘farmland’ or ‘woodland’ species (Table S1) based on land use of the points where each species was observed. In detail, a species was classified as farmland when the mean extent of farmlands within 150 m from all the point counts where it was observed was > 50%. Similarly, a species was classified as woodland when the mean extent of woodlands around the points where it was observed was > 50%.
Statistical analyses
We based our analyses on population indices comparable between protection categories, which largely vary in extent and land use, and years, when different numbers of point counts were performed. We first selected, for each year and protection category, the point counts where a species could potentially be observed as those point counts between the minimum and the maximum altitude at which a species has ever been detected in all the point counts in our database. This selection criterion was used with the aim of excluding false zeroes from the analyses, i.e. point counts outside the altitudinal range of a species (see also Appendix S1 in the supplementary materials for further details).
We acknowledge that a species may potentially also occur in point counts at altitudes slightly above or below these limits. However, we are unaware of any comprehensive list of altitude ranges for common species specific to Lombardy, and we refrained from using altitude ranges described in the literature because we found that, for some species, they largely differ from the altitude ranges observed in Lombardy. For example, the Eurasian Linnet Carduelis cannabina usually breeds in lowlands in Central, Northern and Western Europe and it is therefore classified as a farmland bird in the continental ecoregion of Europe by the PECBMS (http://www.ebcc.info/index.php?ID=564, accessed June 10, 2016). In contrast, in Lombardy this species is a strictly alpine breeder. Indeed, the average elevation of point counts where we detected this species was 1,821.9 ± 32.0 SE, m. Thus, using altitude ranges described in the literature for identifying points where a species could potentially be observed, would have determined the inclusion of a large number of “false absences” in the dataset. We therefore preferred to base our selection of points to be included in the analyses on our own data, also because we are confident that our extensive survey (Figure S1) was able to capture the actual altitudinal range of common bird species in Lombardy.
Analyses were run in two steps. First, we ran separate GLMs for each species and protection category with the aim of obtaining indices of the mean occurrence and temporal trend of each species in each protection category. In detail, we modelled the presence/absence of a species at a point count according to the year and the proportional extent of farmlands, woodlands, urban areas and open non-farmland environments around each point. In the models of points in NRs and RPs, we also included as predictor the year when the protected area was declared. For N2000 sites (included in the RP category), we considered the year of approval of management plans, because conservation measures are effective in N2000 areas only after that date (Parks and Biodiversity Unit of Lombardy Regional Administration pers. comm.). When points were performed in areas where different types of protected areas overlap (e.g. N2000 sites and regional parks), we considered the earliest year of institution of any protected area at that point.
Only information on presence or absence of a species at each point count was considered, and only those species detected in at least five years of our survey and in at least 30 point counts in each protection category were selected. This ensured that we had sufficient data to estimate occurrence and trend indices for all species by protection category combinations. The Common Pheasant Phasianus colchicus was excluded because its distribution is largely influenced by game restocking. The Feral Pigeon Columba livia domestica was excluded because its distribution and population dynamics are strictly determined by human activities. Models were fitted assuming a binomial error distribution and a log link function (log-binomial models or “relative risk” models; McNutt et al. Reference McNutt, Wu, Xue and Hafner2003). In the supplementary materials (Appendix S2), we provide a technical description of log-binomial models and of the interpretation of their coefficients, and of the reason why we preferred these models to logistic regressions.
All predictors were centred to their mean value before the analyses. With this parameterization, the intercept of the model represents the log-transformed mean proportion of point counts performed in a given protection category in all years, after accounting for the different land use around the point and, for NRs and RPs, also for the different year of establishment of the PAs. This index therefore estimates the (log-transformed) average “relative risk” of observing a species in a point count performed in a given protection category in all years (“log-occurrence index” hereafter). In contrast, the slope of the year covariate from the same model represents the log-transformed variation in the proportion of points where a species was detected from one year to another (i.e. the year-to-year variation in the relative risk of observing a species) in a given protection category (“log-trend index” hereafter).
Each log-binomial GLM allowed estimation of two indices providing different pieces of information on, respectively, the occurrence of a species and its temporal trend in a protection category. These indices were used in the second step of the analyses. In the text and the graphs we reported their exponentials (“occurrence index”) or their exponential minus one (“trend index”) in percentage to facilitate the interpretation of their values (see Appendix S2 for further details).
In the second step of the analyses, we compared log-occurrence indices and log-trend indices between protection categories in Linear Mixed Models (LMMs), assuming a Gaussian error distribution, with species as a random grouping factor. LMMs were corrected for non-homogeneity of variances whenever necessary (Zuur et al. Reference Zuur, Ieno, Walker, Saveliev and Smith2009; details not shown). Statistical significance was assessed by a permutation test (999 permutations, Pperm hereafter) to assure that our conclusions were robust whenever we detected (small) deviations from normality of model residuals during routine model diagnostics or the presence of (few) outliers (details not shown). Post-hoc tests were conducted by pairwise comparisons, with permutation-based P-values corrected for multiple statistical tests by the False Discovery Rate (FDR) procedure (Storey Reference Storey2002). We also used a LMM with species as a random factor to assess whether average population trends at each protection category, or at all protection categories pooled, significantly differed from zero. The same analytical procedure was repeated separately for farmland and woodland species and for species with different migratory habits.
In order to represent temporal variation in species occurrence, for each species, year and protection category, we calculated the proportion of point counts where a species was detected over the number of point counts performed in that year and protection category within the altitudinal range of that species. We then reported the mean occurrence among all species, farmland and woodland species, and RESs, SDMs and LDMs in each year. This mean occurrence does not strictly correspond to the occurrence index, because it does not account for land use around point counts or for the year where protection measures started in an area. However, it allows visualisation of year-to-year variation in occurrence (Figures 2 and S2). All analyses were run in R 3.1.1 (R Core Team 2015) with the logbin (Donoghoe Reference Donoghoe2015), nlme (Pinheiro et al. Reference Pinheiro, Bates, DebRoy, Sarkar and Core Team2015), lsmeans (Lenth Reference Lenth2015), predictmeans (Luo et al. Reference Luo, Ganesh and Koolaard2014) and multtest (Pollard et al. Reference Pollard, Dudoit and van der Laan2005) packages.
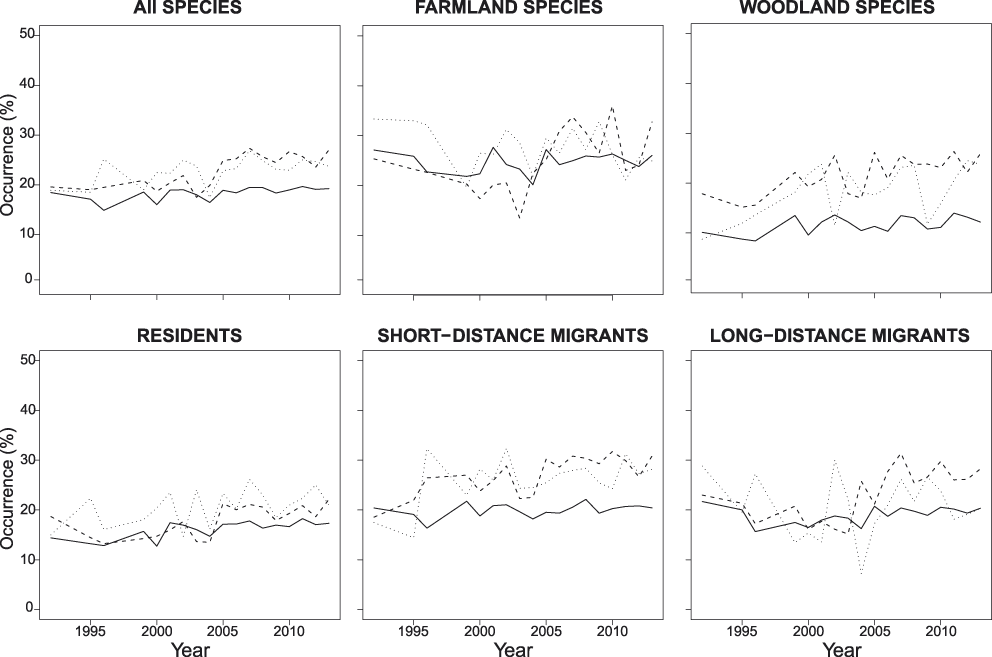
Figure 2. Mean occurrence of all species and of different subsets of species in each year and protection category. Occurrence of a species was calculated as the ratio of point counts where that species was detected in each year and protection category over the total number of point counts performed in that year and protection category within the altitudinal range of that species. Solid lines: non protected areas, dashed lines: regional parks, dotted lines: nature reserves (see Figure S2 for larger images reporting also standard errors).
Results
Analyses of all species
The whole dataset included 14,696 10-minute point counts, corresponding to (mean ± SE) 816.44 ± 63.33 point counts per year. Overall, 54 species were included in the analyses. Table 2 provides the number of point counts performed in each protection category, the number of farmland and woodland species included in the analyses, the number of species with each migratory habit. Table S1 provides occurrence and trend indices of each species.
Occurrence indices of species in each protection category ranged from 0.58 ± 0.31% (Northern Wheatear Oenanthe oenanthe in RPs) to 72.85 ± 1.21% (Eurasian Blackcap Sylvia atricapilla in RPs). Log-occurrence indices significantly differed among protection categories (F2,106 = 9.252, Pperm = 0.001), with significantly lower values in NPAs than in both RPs and NRs, which did not differ to one another (Figure 3A).
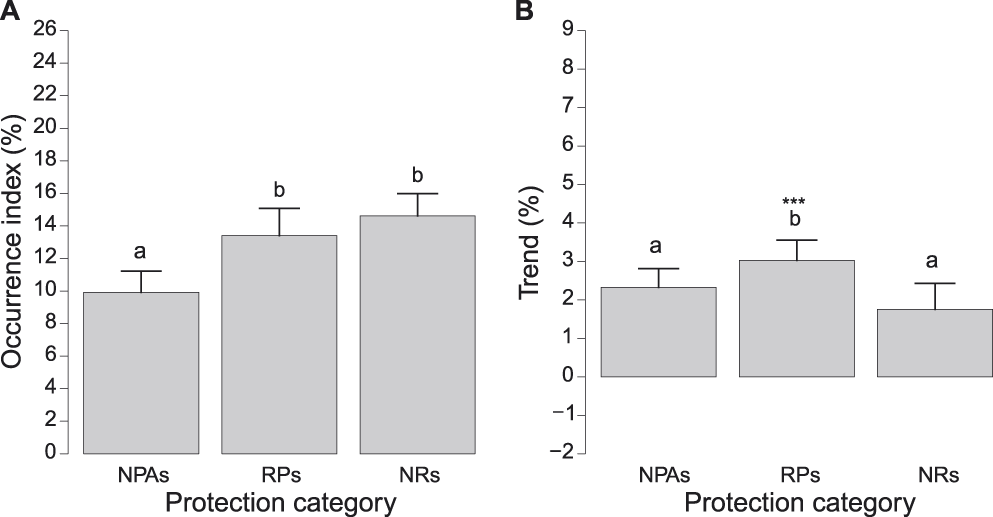
Figure 3. A) Occurrence indices (exponential of the intercept of log-binomial GLMs) and B) trends (exponential of the slope of log-binomial GLMs minus one) of all species in different protection categories (NPAs: non-protected areas, RPs: regional parks and Natura 2000 sites, NRs: national park and nature reserves). Bars represent standard errors. Different letters above bars denote protection categories that differed at post-hoc tests. In B, asterisks above bars denote protection categories where log-trend indices were significantly positive (* = P < 0.05, ** = P < 0.01, *** = P < 0.001). Scales of vertical axes are held constant in all figures to facilitate comparison of population indices and trends.
Overall, bird populations significantly increased in Lombardy during the study period by 2.46 ± 0.48% per year (t54 = 5.165, P < 0.001), as indicated by a LMM run on log-trend indices reported in Table S1 with only the intercept as fixed effect and species as random factor. However, we note that this general increase was the balance between trends of species that showed marked increases (e.g. Song Thrush Turdus philomelos: +10.83 ± 0.82% per year; Woodpigeon Columba palumbus: +9.53 ± 0.49% SE per year; Linnet: +9.46 ± 1.20% per year) and those of species that sharply declined in the last two decades (e.g. European Goldfinch Carduelis carduelis: -4.82 ± 0.29% per year; Cetti’s Warbler Cettia cetti: -4.17 ± 0.55% per year; European Greenfinch Carduelis chloris: -4.11 ± 0.31% per year; see Table S1 for trends of all species).
Trend indices of species in each protection category ranged from -11.37 ± 2.81% per year (Cetti’s Warbler Cettia cetti in NRs) to +15.45 ± 4.22% per year (Spotted Flycatcher Muscicapa striata in NRs) with significant differences among protection categories (F2,106 = 3.422, Pperm = 0.026). Indeed, log-trend indices were more positive in RPs than in both, NRs and NPAs, which, in turn, did not differ significantly from one another (Figure 3B). In addition, log-trend indices were significantly positive only in RPs (Figure 3B).
Farmland and woodland species
Log-occurrence indices of farmland species did not differ among protection categories (F2,32 = 0.084, Pperm = 0.925). In contrast, those of woodland species did (F2,28 = 24.439, Pperm = 0.001) and were lower in NPAs than in both RPs and NRs (Figure 4A). Log-trend indices of farmland species differed significantly among protection categories (F2,32 = 7.285, Pperm = 0.003). In particular, they showed higher values in RPs than in the other protection categories, which, in turn, did not differ significantly from one another (Figure 4B).
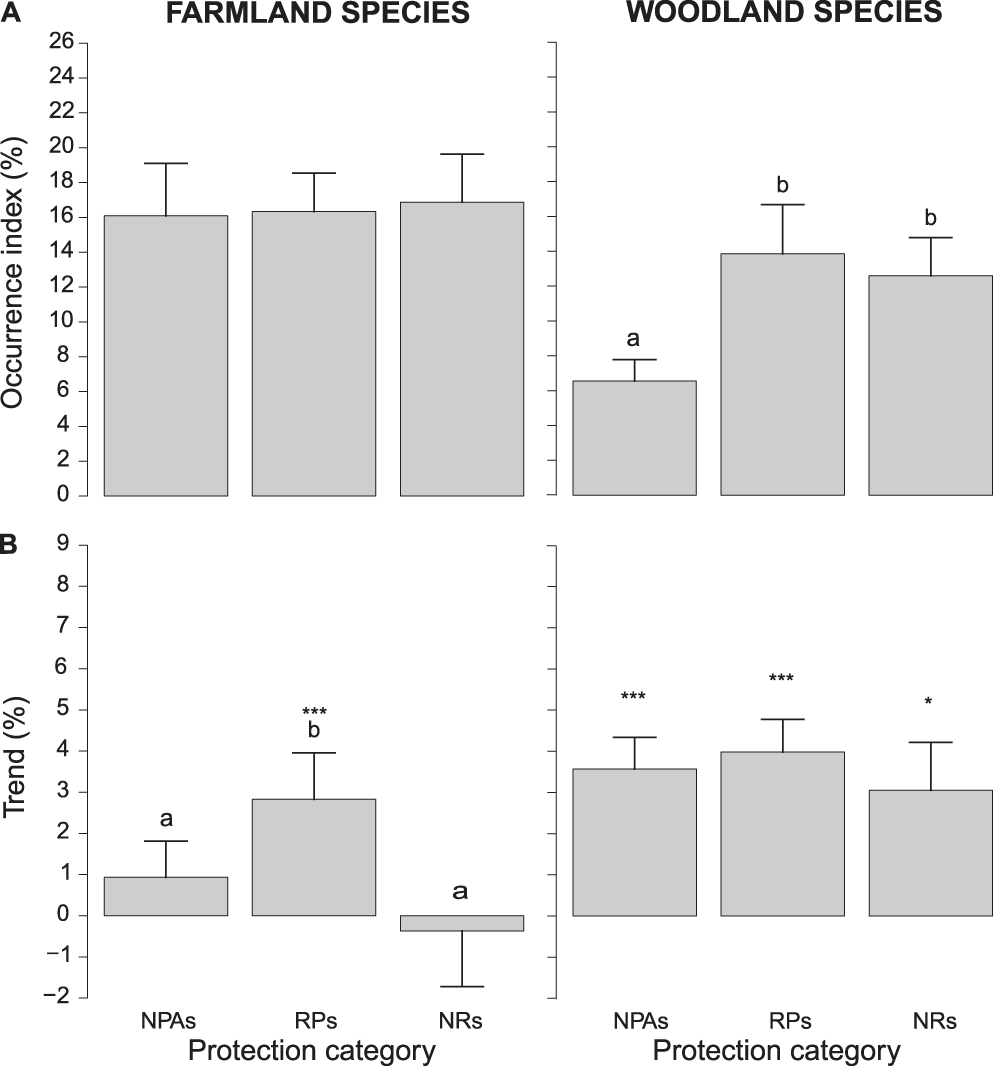
Figure 4. A) Occurrence indices (exponential of the intercept of log-binomial GLMs) and B) trends (exponential of the slope of log-binomial GLMs minus one) of farmland and woodland species in different protection categories (NPAs: non-protected areas, RPs: regional parks and Natura 2000 sites, NRs: national park and nature reserves). Bars represent standard errors. Different letters above bars denote protection categories that differed at post-hoc tests. In B, asterisks above bars denote protection categories where log-trend indices were significantly positive (* = P < 0.05, ** = P < 0.01, *** = P < 0.001). Scales of vertical axes are held constant in all figures to facilitate comparison of indices.
Finally, log-trend indices of farmland birds were significantly positive only in RPs, while they did not differ from zero in the other protection categories (Figure 4B), or when all protection categories were pooled (+1.12 ± 0.98% per year, t34 = 1.157, P = 0.255). In contrast, log-trend indices of woodland species did not differ among protection categories (F2,28 = 1.600, Pperm = 0.258), were significantly positive in all protection categories (Figure 4B), and when all protection categories were pooled (+2.96 ± 0.89% per year, t30 = 3.376, P = 0.002).
Resident species and short- and long-distance migrants
The analyses run separately for species with different migratory habits showed that log-occurrence indices of RESs and SDMs differed significantly among protection categories (RESs: F2,38 = 5.499, Pperm = 0.013: SDMs: F2,42 = 7.987, Pperm = 0.003). In details, log-occurrence indices of RESs were significantly higher in NRs than in NPAs, while in RPs they were intermediate and not significantly different from those in the other protection categories (Figure 5A). In contrast, those of SDMs were significantly lower in NPAs than in the other protection categories (Figure 5A). Finally, log-occurrence indices of LDMs did not differ significantly among protection categories (F2,22 = 0.175, Pperm = 0.863; Figure 5A). Log-trend indices of RESs differed significantly among protection categories (F2,38 = 6.127, Pperm = 0.005) and were significantly lower in NRs than in both NPAs and RPs (Figure 5B). In contrast, log-trend indices of both SDMs and LDMs did not differ significantly among protection categories (SDMs: F2,38 = 6.127, Pperm = 0.005; LDMs: F2,22 = 1.320, Pperm = 0.349; Figure 5B).
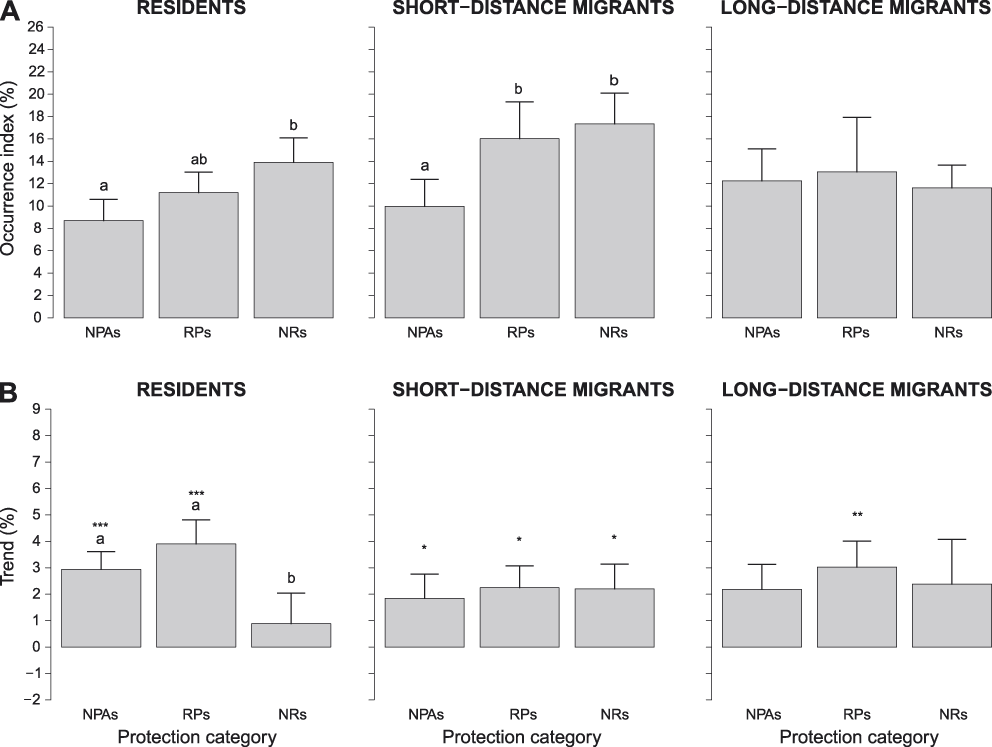
Figure 5. A) Occurrence indices (exponential of the intercept of log-binomial GLMs) and B) trend indices (exponential of the slope of log-binomial GLMs minus one) of residents, short-distance migrants and long-distance migrants in different protection categories (NPAs: non-protected areas, RPs: regional parks and Natura 2000 sites, NRs: national park and nature reserves). Bars represent standard errors. Different letters above bars denote protection categories that differed at post-hoc tests. In B, asterisks above bars denote protection categories where log-trend indices were significantly positive (* = P < 0.05, ** = P < 0.01, *** = P < 0.001). Scales of vertical axes are held constant in all figures to facilitate comparison of indices.
Overall, log-trend indices of RESs, SDMs and LDMs were positive when all protection categories were pooled together (RESs: +2.57 ± 0.80% per year, t40 = 3.336, P = 0.002; SDMs: +2.10 ± 0.81% per year, t44 = 2.602, P = 0.013; LDMs: +2.53 ± 1.08% per year, t240 = 2.376, P = 0.026). In contrast, when we analysed log-trend indices of RESs, SDMs and LDMs in each protection category separately, we found that RESs increased significantly in NPAs and RPs, but not in NRs, SDMs increased significantly in all protection categories, and LDMs increased significantly in RPs only (Figure 5B).
Discussion
Occurrence and trend indices of common birds in PAs and NPAs
Our analyses showed that occurrence indices were, on average, larger in PAs (both NRs and RPs) than in NPAs (Figure 3A). This finding is consistent with our predictions, and confirms the general effectiveness of PAs of Lombardy in conserving breeding birds. Trend indices of common bird species differed among protection categories, and were significantly positive only in RPs, while they did not differ from zero in both NRs and NPAs (Figure 3B). This result is only partly consistent with our expectations, because we predicted trend indices to be more positive in all PAs than in NPAs. Most PAs considered in the present study were established between the 1980s and the 1990s (Lombardy Regional Law n. 86, 30 November 1983; Canova Reference Canova2006), so the effects of protection measures should have had time to produce detectable responses at the population level. Indeed, it has been recognised that there is often a lag of about 10 years between establishment of a protected area and detectable responses at population levels (Male and Bean Reference Male and Bean2005, Donald et al. Reference Donald, Sanderson, Burfield, Bierman, Richard and Waliczky2007).
The fact that bird populations increased in RPs only, while trends were similar and stable in both NRs and NPAs may be explained by different, not mutually exclusive, processes. First, we can speculate that NRs are close to their carrying capacity, and bird populations in them are therefore stable. Second, NRs may act as sources of individuals that move to surrounding areas. Importantly, some NRs were established in the best natural areas within RPs. The increase observed in RPs may therefore be due both to protection measures in RPs and to the dispersal of individuals from source areas in NRs. If this interpretation were true, PAs of Lombardy would have fully achieved their goals, even if populations in NRs sites of Lombardy are increasing less than in RPs, as they conserve bird communities and allow their increase within RPs or in surrounding areas. In the present study, we cannot assess if this interpretation is correct, and further studies on this topic are therefore needed. Such studies may investigate, for example, not only species occurrence, but also abundance and breeding success in different protection categories as well as investigate dispersal of individuals from NRs. Indeed, differences in breeding output and studies on dispersal may elucidate whether NRs actually act as sources of individuals for RPs. We stress that the implementation of large-scale studies on breeding output of common bird species, as well as on dispersal of individuals from areas at different protection categories, should be a priority for the decision-makers involved in the management of the network of PAs in Lombardy, because they will provide pivotal information to assess further the effectiveness of PAs.
Farmland and woodland species
The analyses run on farmland and woodland species indicated that PAs were only partially effective in preserving farmland birds, because occurrence indices of these species were similar in all protection categories and their trend indices increased in RPs only (Figure 4). In contrast, they were effective in protecting woodland birds, because occurrence indices were larger in them than in NPAs and trend indices of these species were positive in all protection categories, including NPAs.
We had no clear view the effectiveness of PAs in preserving farmland birds. Farmlands are often regarded as low-value areas for nature conservation (Oldfield et al. Reference Oldfield, Smith, Harrop and Leader-Williams2004, Powell at al. 2000, Scott et al. Reference Scott, Davis, McGhie, Wright, Groves and Estes2001). Consequently, very few NRs have been established in agricultural areas (indeed farmlands represent only the 10.1% of the total area of NRs in Lombardy). Most farmland birds covered by this study are common and widespread. PAs may thus not be suited to protect such species, because they perform much better at protecting species with more restricted ranges and specific habitat needs (this applies also to LDMs, see below). Different forms of protection should therefore be envisaged for these species, which are generally declining at a continental scale (Tucker and Heath Reference Tucker and Heath1994, Pain and Pienkowski Reference Pain and Pienkowski1997, Donald et al. Reference Donald, Green and Heath2001, Gregory and Strien Reference Gregory and Strien2010). They should recommend environmentally friendly agricultural practices and a strong involvement of private landowners with the precise aim of favouring the growth of farmland bird populations and the overall agro-ecosystem biodiversity.
In contrast to NRs, RPs of Lombardy also protect agricultural areas (farmlands represent 28.9% of the total area of RPs). However, in these PAs management plans exist that promote agro-ecosystem biodiversity (Sinibaldi and Tallone Reference Sinibaldi, Tallone and Tamburelli2008). The fact that farmland birds are increasing in RPs only, may therefore suggest that more environmentally friendly agricultural practices may be effective for protecting farmland birds.
Finally, we stress that the overall stability (or increase, in RPs only) of population trends of farmland birds should be cautiously interpreted, because trends in these species are largely divergent, with some species that largely increased (e.g. Woodpigeon, +9.53 ± 0.49% per year) and species that suffered dramatic declines (e.g. European Goldfinch, -4.82 ± 0.29% per year). Moreover, some farmland bird species that are declining most in Lombardy, such as the Skylark Alauda arvensis and the Red-backed shrike Lanius collurio (Bani et al. Reference Bani, Massimino, Orioli, Bottoni and Massa2009) were not detected in a sufficient number of point counts to be included in the present analyses. This may have determined a possible overestimate of the general trend of farmland species.
PAs of Lombardy seem effective in preserving woodland birds, at least because occurrence indices are higher in them than in NPAs. A large number of NRs in Lombardy were established in residual forests (which indeed represent 30.0% of the total area of NRs in Lombardy), so that their effectiveness in preserving woodland birds was expected. The fact that trend indices of woodland birds were positive and did not differ among protection categories may be due to the general increase in woodland extent that is occurring in Lombardy due to the abandonment of farming in the mountains and the consequent re-colonisation of pastures by secondary woods (Scazzosi Reference Scazzosi and Agnoletti2013, Garbarino Reference Garbarino, Hartel and Plieninger2014).
Our classification of farmland and woodland birds was based on the land use around point counts where a species was detected. On the one side, this classification is based on the data, and therefore represents the habitat preference of these species in Lombardy. On the other side, we acknowledge that the classification of some species may be surprising. For example, the Grey Heron Ardea cinerea and the Mallard Anas platyrhynchos are commonly considered wetland rather than farmland species. However, the first species is often observed foraging in arable fields in Lombardy, and the second, albeit always linked to watercourses, very often occurs in canals between fields. In order to assess whether this selection of species may have biased our conclusions on farmland and woodland birds, we re-ran the analyses by including only species classified farmland or woodland by PECBMS for the continental bioregion of Europe (http://www.ebcc.info/index.php?ID=564, accessed June 10, 2016). We found that results were identical for woodland species and only partially different for farmland species (Appendix S3). Indeed, log-occurrence indices of species classified as farmland by PECBMS did not differ among protection categories (Figure S3A), while their log-trends indices showed higher values in NPAs than in NRs, and intermediate values in RPs (Figure S3B). In addition, log-trend indices of farmland species showed no significant increase in any protection category (Figure S3B), nor when all protection categories were pooled (Appendix S3). Despite a slight difference in the results of log-trend indices, these analyses confirmed that PAs of Lombardy do not seem effective in protecting farmland species. Hence, our results seem robust to the different criteria used to classify farmland and woodland species.
Resident and migratory birds
Species with different migratory habits showed different patterns of variation in occurrence and trend indices among protection categories. NRs seem to favour RESs and SDMs, at least because occurrence indices were more positive in NRs than in NPAs, but population trends of these species did not differ among protection categories, and RESs seem not to increase in NRs (Figure 5). In contrast, both occurrence and trend indices of LDMs in PAs were similar to those in NPAs. We must therefore conclude that there is little evidence that PAs of Lombardy favour LDMs. This is particularly worrying because LDM populations are suffering sharp declines at a continental scale (Sanderson et al. Reference Sanderson, Donald, Pain, Burfield and van Bommel2006). Importantly, these species were generally not declining in Lombardy, and they were slightly increasing in RPs. However, also in this case, some of these species largely increased (e.g. Lesser Whitethroat Sylvia curruca, +8.72 ± 1.19% per year) while other declined (e.g. Common House Martin Delichon urbicum, -1.67 ± 0.32% per year). Similar to farmland birds, LDMs covered by this study are common and widespread species, so PAs may not be suited to protect them (see above). LDMs and farmland species may therefore need novel and different protection measures, like more environmentally friendly land management (see also above).
Comparison with bird population trends at continental scale
The results of the present study partially contrast with estimates of bird population trends in Europe (Tucker and Heath Reference Tucker and Heath1994, BirdLife International 2004, PECBMS 2012), which showed a general decline of bird populations in the last few decades, and in particular a strong decline in farmland birds (Donald et al. Reference Donald, Green and Heath2001, Reference Donald, Sanderson, Burfield and van Bommel2006) and LDMs (Both et al. Reference Both, van Turnhout, Bijlsma, Siepel, Van Strien and Foppen2010, Møller et al. Reference Møller, Rubolini and Lehikoinen2008, Sanderson et al. Reference Sanderson, Donald, Pain, Burfield and van Bommel2006). In Lombardy, we observed a general increase in bird occurrence in the last 20 years, an increase of LDMs, and a non-significant trend of farmland species. It should be stressed that the general trend we observed in any group of species is the balance among those of species that showed opposite tendencies. For example, among the 10 species that declined more, five were farmland and eight migrant birds, three of which LDMs, while among the 10 species that increased more, only two were farmland species and six were migrants, only two of which were LDMs (Table S2). Hence, the evidence that generally LDMs were increasing and farmland birds were not declining in Lombardy must not be interpreted as evidence that any LDM or farmland species was not declining, and therefore must not reduce existing efforts to protect those species that are suffering sharp declines in all environments.
Conclusions and conservation implications
In the present study, we showed that PAs of Lombardy were effective in preserving common breeding bird populations in the last two decades. This conclusion is based on the observation that occurrence indices were higher in PAs than in NPAs. Trend indices of bird populations showed on average positive values in Lombardy, which were, however, the balance between large increases of some species, and sharp declines of other ones. This evidence suggests that the general environment of Lombardy became more suitable for some common bird populations during the last 20 years, but not for others.
PAs seemed effective in protecting woodland and SDM species because their occurrence indices were larger in PAs than in NPAs. This may be because 30.3% of PAs is woodlands, six out of 22 SDM species are woodland species, and forest areas of Lombardy have increased in extent and have been less intensively exploited in the last two decades (Massimino et al. Reference Massimino, Orioli, Pizzardi, Massa and Bani2010). PAs of Lombardy seem less effective in protecting farmland birds and LDMs. Low effectiveness of PAs in protecting farmland birds has been documented also in the recent Regulatory Fitness and Performance Programme (REFIT, http://ec.europa.eu/environment/nature/legislation/fitness_check/index_en.htm, accessed on July 26, 2016) of the EU aiming at assessing the effectiveness of the N2000 network of PAs. Indeed the REFIT procedure generally found that N2000 network performed well in protecting birds, but according to the Italian National Summary for Article 12 of the Birds Directive (https://circabc.europa.eu/sd/a/b97edd9d-cd83-4cc7-8ca2-c66997b2e2f4/IT_A12NatSum_20141031.pdf, accessed on July 26, 2016), agriculture was the main pressure in these PAs in Italy.
Most farmland birds and LDMs covered by this study are common and widespread species, so that they may not be suited to being well protected by PAs. If this interpretation were correct, the best way to protect these species would be to implement ecologically sustainable land use policies, particularly in agro-environment schemes. These new conservation measures should recommend environmentally friendly agricultural practices and strong involvement of private landowners with the precise aim of favouring the growth of farmland and LDM bird populations and the overall agro-ecosystem biodiversity.
Supplementary Material
To view supplementary material for this article, please visit https://doi.org/10.1017/S095927091700017X
Acknowledgements
We are grateful to Dr. Vittorio Vigorita (former Head of Planning Wildlife and Hunting Office of Agriculture General Directorate) and Dr. Laura Cucé. Special thanks go to Professor Renato Massa, who first had the idea to start the Breeding Bird Monitoring Program in Lombardy. Comments by two anonymous reviewers greatly improved the quality of the paper. Regional Agency for Agriculture and Forestry (ERSAF, Ente Regionale per i Servizi all’Agricoltura e alle Foreste) and the Agriculture General Directorate of Lombardy Regional Administration (DG - Agricoltura, Regione Lombardia) supported the Regional Breeding Bird Monitoring Program.


