


Obsessive-compulsive disorder (OCD) is a highly disabling psychiatric illness with a lifetime prevalence of around 2% (American Psychiatric Association, 2013). Symptoms are also present in the general population, with an estimated 21–25% of people who experience subclinical obsessions and compulsive symptoms without OCD diagnosis (Fullana et al., Reference Fullana, Mataix-Cols, Caspi, Harrington, Grisham, Moffitt and Poulton2009). OCD typically takes a chronic course, causing significant impairment in all areas of life (Koran, Thienemann, & Davenport, Reference Koran, Thienemann and Davenport1996), emphasising the need for reliable assessment and early treatment. In particular, in order to advance treatment for OCD, sensitive and reliable instruments are required to accurately measure symptom severity (Anholt et al., Reference Anholt, van Oppen, Emmelkamp, Cath, Smit, van Dyck and van Balkom2009). However, measurement of OCD symptoms remains complex due to its heterogeneity and comorbidity with other disorders (Clark, Reference Clark2004).
A frequently used self-report instrument in both research and clinical practice is the Padua Inventory (PI; Sanavio, Reference Sanavio1988), which now exists in several different versions, including the Padua Inventory — Washington State University Version (PI-WSUR; Burns, Keortge, Formea, & Sternberger, Reference Burns, Keortge, Formea and Sternberger1996) and the Padua Inventory — Revised (PI-R; Van Oppen, Hoekstra, & Emmelkamp, Reference Van Oppen, Hoekstra and Emmelkamp1995). The PI was originally developed as an improvement of OCD measures conceived prior to the 1980s, including the Maudsley Obsessional-Compulsive Inventory (MOCI; Hodgson & Rachman, Reference Hodgson and Rachman1977), the Self-Rating Obsessional Scale (SOS; Sandler & Hazari, Reference Sandler and Hazari1960), and the Leyton Obsessional Inventory (LOI; Cooper, Reference Cooper1970). Factor analytic studies have shown four dimensions for the original PI, including (a) impaired control over mental activities, (b) contamination behaviours, (c) checking behaviours, and (d) urges and worries about loss of control over motor behaviour (Kyrios, Bhar, & Wade, Reference Kyrios, Bhar and Wade1996). Studies have shown the PI to be a reliable questionnaire, although there have been mixed findings for the urges and worries subscale (Sanavio, Reference Sanavio1988; Sternberger & Burns, Reference Sternberger and Burns1990; Van Oppen, Reference Van Oppen1992) and at the time, its factor structure had only been investigated in non-OCD participants. This led Van Oppen, Hoekstra et al. (Reference Van Oppen, Hoekstra and Emmelkamp1995) to develop a revised version of the PI using factor analysis with a sample of OCD patients: the Padua Inventory — Revised (PI-R). This resulted in a questionnaire composed of 41 items (rated 0–4), as opposed to 60 items for the original version, divided into five subscales: (a) impulses, (b) washing, (c) checking, (d) rumination, and (e) precision.
While the PI-R appeared to be an improvement on its previous version in terms of its factor analytically derived subscales in an OCD sample, its development did not address the overlap of the PI with worry and generalised anxiety disorder (Freeston et al., Reference Freeston, Ladouceur, Rhéaume, Letarte, Gagnon and Thibodeau1994). In addition, studies using the PI-R later revealed similar shortcomings in the rumination and precision subscales, which did not distinguish OCD patients from anxious or depressive participants (Beşiroğlu et al., Reference Beşiroğlu, Ağargün, Boysan, Eryonucu, Güleç and Selvi2005). With the intent of improving OCD content specificity in the original PI, Burns et al. (Reference Burns, Keortge, Formea and Sternberger1996) developed the PI-WSUR with a non-clinical sample. This resulted in a questionnaire composed of 39 items (rated 0–4) divided into five subscales: (a) Obsessional thoughts about harm to self/others, (b) Obsessional impulses to harm self/others, (c) Contamination obsessions and washing compulsions, (d) Checking compulsions, and (e) Dressing/grooming compulsions. A literature review of OCD self-report measures by Overduin and Furnham (Reference Overduin and Furnham2012) revealed that the PI-WSUR was an improvement in OCD specificity compared to the original PI, and potentially less susceptible to content overlap between subscales than the PI-R (Anholt et al., Reference Anholt, van Oppen, Emmelkamp, Cath, Smit, van Dyck and van Balkom2009).
Despite differences in the underlying factor structure of the different versions of the Padua Inventory, studies have generally supported their reliability and validity in the measurement of OCD symptomology (see Overduin & Furnham, Reference Overduin and Furnham2012). The PI, PI-R, and PI-WSUR are frequently used measures in the assessment of treatment response (Clark, Kirkby, Daniels, & Marks, Reference Clark, Kirkby, Daniels and Marks1998; O'Connor et al., Reference O'Connor, Aardema, Bouthillier, Fournier, Guay, Robillard and Tremblay2005; Van Balkom et al., Reference Van Balkom, De Haan, Van Oppen, Spinhoven, Hoogduin and Van Dyck1998), as well as the severity of subclinical OCD symptoms (Fullana et al., Reference Fullana, Mataix‐Cols, Trujillo, Caseras, Serrano, Alonso and Torrubia2004; Mataix-Cols et al., Reference Mataix-Cols, Junqué, Sànchez-Turet, Vallejo, Verger and Barrios1999; Mataix-Cols et al., Reference Mataix-Cols, Junqué, Vallejo, Sànchez-Turet, Verger and Barrios1997), which have supported their sensitivity to measuring treatment outcome (Overduin & Furnham, Reference Overduin and Furnham2012). However, little is known about how the different versions of the Padua compare to each other in terms of their sensitivity to measure treatment outcome. In addition, while larger effect sizes have generally been reported in clinician-rated measures like the Yale-Brown Obsessive Compulsive Scale (Y-BOCS; Goodman, Price, Rasmussen, Mazure, Delgado et al., Reference Goodman, Price, Rasmussen, Mazure, Delgado, Heninger and Charney1989) as compared to self-report questionnaires (Taylor, Reference Taylor1995, Reference Taylor, Swinson, Antony, Richter and Rachman1998; van Balkom et al., Reference van Balkom, van Oppen, Vermeulen, van Dyck, Nauta and Vorst1994), these comparisons have mostly been based on impressions across different samples and studies, rather than any direct comparison in the same sample and testing whether any actual significant differences exist.
Also, an ongoing issue with the use of self-report questionnaires is that the PI, PI-WSUR, and PI-R have surprisingly low relationships with the Y-BOCS. Cross-sectional studies have shown particularly low correlations between these three self-report measures and the Y-BOCS (r = .22–.34; Anholt et al., Reference Anholt, van Oppen, Emmelkamp, Cath, Smit, van Dyck and van Balkom2009; Mataix-Cols, Fullana, Alonso, Menchón, & Vallejo, Reference Mataix-Cols, Fullana, Alonso, Menchón and Vallejo2004; Thordarson et al., Reference Thordarson, Radomsky, Rachman, Shafran, Sawchuk and Hakstian2004). On the other hand, longitudinal studies comparing change in self-report symptoms in the PI, PI-WSUR, and PI-R with change in Y-BOCS scores have yielded higher correlations than in cross-sectional studies, yet none indicate adequate convergent validity, considering that these assessment tools are supposed to measure an identical construct (r = .48–.51; Beşiroğlu et al., Reference Beşiroğlu, Ağargün, Boysan, Eryonucu, Güleç and Selvi2005; van Oppen, Emmelkamp, van Balkom, & van Dyck, Reference van Oppen, Emmelkamp, van Balkom and van Dyck1995).
Several explanations have been put forward for the discrepant findings between self-report measurement versus clinician-rated assessment. One explanation is that self-report measures assess symptom severity based on symptom content, while the Y-BOCS evaluates symptom severity independent of symptom specificity (Anholt et al., Reference Anholt, van Oppen, Emmelkamp, Cath, Smit, van Dyck and van Balkom2009). In other words, because individuals with several types of symptoms will score on multiple subscales, their total scale score will be more severe compared to other individuals who present fewer symptom types (Abramowitz et al., Reference Abramowitz, Deacon, Olatunji, Wheaton, Berman, Losardo and Adams2010). For example, a person with a severe OCD that is mono-symptomatic with symptoms of repeated checking, but no other symptoms, is likely to score high on the Y-BOCS, but not necessarily on the Padua, given the large numbers of items in other symptom domains that do not directly pertain to checking symptoms.
Another explanation is that larger effect sizes have been reported in clinician-rated measures than self-report measures (Taylor, Reference Taylor1995, Reference Taylor, Swinson, Antony, Richter and Rachman1998; van Balkom et al., Reference van Balkom, van Oppen, Vermeulen, van Dyck, Nauta and Vorst1994), which could be associated with differences in severity calculation, as self-report instruments measure a more extensive range of OCD symptoms (van Oppen, Emmelkamp et al., Reference van Oppen, Emmelkamp, van Balkom and van Dyck1995). However, a study by Anholt et al. (Reference Anholt, van Oppen, Emmelkamp, Cath, Smit, van Dyck and van Balkom2009) revealed that neither differences in administration or severity calculation between self- and clinician-administered instruments could account for the low correlations found between the PI-R and the Y-BOCS. Anholt et al. (Reference Anholt, van Oppen, Emmelkamp, Cath, Smit, van Dyck and van Balkom2009) conclude that the PI-R and the Y-BOCS measure unrelated features of OCD with no adequate explanation for the low correlations between these measures.
It is important to note, however, that the majority of these results were established by examining the relationships between self-report and the Y-BOCS administered at a single time point, rather than relationships between change in symptoms across time as the result of treatment. Although previous studies have clearly demonstrated that weak correlations exist between the three versions of the PI and the Y-BOCS, the relationships are numerically higher when considering change over time in treatment outcome research. Hence, although low correlations between the Y-BOCS and self-report measures appear to support the notion that these questionnaires measure unrelated features of OCD, this might not necessarily be the case to the same extent when considering change in symptoms over time. As such, the explanation that weak relationships between these measures are due to the Padua measuring severity on the basis of symptom content, while the Y-BOCS measures severity independent of symptom specificity, has so far not been investigated in relation to change in symptoms over time. This issue is of particular relevance for treatment outcome research, with current recommendations consisting of using both self-report measures and clinician-rated instruments to measure treatment outcome. The evidence so far indicates that they measure unrelated aspects of OCD, although the exact nature of the differences between both types of questionnaires remains unknown. Further investigation into potential differences between self-report questionnaires and the Y-BOCS, and identifying the exact reasons why these measures do not relate strongly to one another, might yield more refined recommendations on their relative benefit and use in treatment outcome research.
Aims and Hypotheses of The Present Study
The current study aimed to investigate the sensitivity of three different versions of the PI to measure treatment outcome, as well as revisit one possible explanation for the weak relationships between the self-report measures of OC, namely that whereas the PI measures severity by aggregating symptoms in different domains, the Y-BOCS measures severity independent of specific symptom domain. It was hypothesised that (1) all measures would be sensitive to treatment outcome without any specific expectancies of whether any differences would emerge between the self-report measures. However, it was expected that the Y-BOCS would be significantly more sensitive to measure change during treatment than any of the self-report measures. Second, given that studies into the relationship between self-report measures and the Y-BOCS have so far been mainly cross-sectional, the study aimed to investigate the relationship between these measures for change in symptoms over time. Specifically, it was hypothesised that (2) correlations between the self-report measures and the Y-BOCS are significantly stronger for change in symptoms as compared to the relationship of these measures at a single point in time. In addition, it was hypothesised that (3) weak relationships between the Y-BOCS and the PI can be explained by the Y-BOCS measuring symptoms independent of symptom content, whereas the PI measures symptom severity on the basis of symptom content.
Method
Participants and Procedure
Participants were recruited at the OCD Spectrum Study Center in Montreal as part of past and ongoing research studies and treatment trials, and who had consented to have their data stored in a databank for future studies. The study received ethics approval from the local ethics board. Participant data were extracted from the databank based on the following criteria prior to participation in a treatment trial: (1) a primary diagnosis of OCD (American Psychiatric Association, 2013) as measured by the Structured Clinical Interview for DSM-IV (SCID-I; First, Spitzer, Gibbon, & Williams, Reference First, Spitzer, Gibbon and Williams1995) by an independent evaluator; (2) no evidence of substance abuse; (3) no suicidal ideation; (4) no past or present schizophrenia, bipolar disorder, or organic disorder; (5) had completed a 24-session cognitive-behavioural treatment; (6) had completed a Y-BOCS assessment by an independent evaluator before and after treatment; (7) had completed the Padua Inventory and the Beck Depression Inventory before and after treatment.
In total, 118 participants fulfilled these criteria and their data were extracted from the databank (51.7% female, 48.3% male, M age = 38.15 years, age range: 18–64). Highest achieved educational levels were: 4.2% primary education, 26.3% secondary education, 16.1% college education, and 33.9% university education. The marital status of participants was: 37.3% single, 32.2% married or common law, and 10.2% separated or divorced.
Measures
Padua Inventory
The PI (Sanavio, Reference Sanavio1988) is a self-report inventory designed to measure the degree of disturbance caused by obsessions and compulsions. It is composed of 60 items rated on a 5-point Likert scale (0 = not at all, 4 = very much). The items are divided into four subscales: (a) impaired control over mental activities, (b) contamination behaviours, (c) checking behaviours, and (d) urges and worries about loss of control over motor behaviour (Kyrios et al., Reference Kyrios, Bhar and Wade1996). The PI total scale and subscales have been found to demonstrate high internal consistency (Cronbach's α > 0.80) with the exception of mixed reports for the (d) Urges and worries subscale (Sanavio, Reference Sanavio1988; Sternberger & Burns, Reference Sternberger and Burns1990; Van Oppen, Reference Van Oppen1992). Sanavio (Reference Sanavio1988) found high test–retest reliability for the PI (r of .78 to .83). All participants completed the original Sanavio version of the Padua, with scores on the other versions derived from the original version.
Padua Inventory — Revised
The PI-R (Van Oppen, Hoekstra et al., Reference Van Oppen, Hoekstra and Emmelkamp1995) is a modified instrument elaborated based on the PI (Sanavio, Reference Sanavio1988). Designed to measure obsessive-compulsive complaints, including intrusive thoughts and ruminations, the PI-R is composed of 41 items rated on a 5-point Likert scale from 0 (not at all) to 4 (very much). To cover the behaviour, obsessions, and impulses of most obsessive-compulsive patients, the instrument uses five scales: (a) impulses, (b) washing, (c) checking, (d) rumination, and (e) precision. Research has shown that the PI-R has good construct validity and reliability and that its factorial structure is invariant across various clinical samples (i.e., obsessive-compulsives, panic disorder patients and social phobics) and non-clinical controls (Van Oppen, Hoekstra et al., Reference Van Oppen, Hoekstra and Emmelkamp1995).
Padua Inventory — Washington State University Revision
The PI-WSUR (Burns et al., Reference Burns, Keortge, Formea and Sternberger1996) is a modified self-report instrument based on the PI (Sanavio, Reference Sanavio1988). Designed to measure symptoms of obsessions and compulsions, it is composed of 39 items rated on a 5-point Likert scale from 0 (not at all) to 4 (very much). The items were divided into five content areas relevant to OCD: (a) Obsessional thoughts about harm to self/others, (b) Obsessional impulses to harm self/others, (c) Contamination obsessions and washing compulsions, (d) Checking compulsions and (e) Dressing/grooming compulsions (Burns et al., Reference Burns, Keortge, Formea and Sternberger1996). Finally, this instrument has demonstrated good internal consistency (Cronbach's α ranging from 0.77 to 0.88 on subscales and 0.92 for the total scale; Burns et al., Reference Burns, Keortge, Formea and Sternberger1996).
Yale-Brown Obsessive Compulsive Scale — Severity Scale
The Y-BOCS (Goodman, Price, Rasmussen, Mazure, Delgado et al., Reference Goodman, Price, Rasmussen, Mazure, Delgado, Heninger and Charney1989; Goodman, Price, Rasmussen, Mazure, Fleischmann et al., Reference Goodman, Price, Rasmussen, Mazure, Fleischmann, Hill and Charney1989) is a clinician-administered structured interview used to evaluate OCD symptom severity independent of symptom content. It is a 10-item measure of obsession and compulsion severity (‘last week’, 0–4 scale). Items pertain either to obsessions or compulsions and are first summed to calculate the Obsession and Compulsion Severity Scales. All items are then summed to calculate the Total Severity Score. Interrater reliability has been high for the Y-BOCS (Goodman, Price, Rasmussen, Mazure, Delgado et al., Reference Goodman, Price, Rasmussen, Mazure, Delgado, Heninger and Charney1989; Woody, Steketee, & Chambless, Reference Woody, Steketee and Chambless1995). Total and subscale scores have been significantly correlated with symptoms of OCD, depression and anxiety as measured by other instruments (Goodman, Price, Rasmussen, Mazure, Fleischmann et al., Reference Goodman, Price, Rasmussen, Mazure, Fleischmann, Hill and Charney1989).
Beck Depression Inventory-II
The BDI-II (Beck, Steer, & Brown, Reference Beck, Steer and Brown1996) is a 21-item instrument elaborated to measure the severity of depressive symptoms experienced by participants during the 2 weeks prior to completion. Frequently used by researchers, this questionnaire has shown to be highly reliable and a valid measure of depressive symptoms (Beck et al., Reference Beck, Steer and Brown1996).
Statistical Analyses
The first hypothesis that the measures would be sensitive to measuring treatment outcome was tested by comparing pre- and posttreatment mean scores on the PI, PI-WSUR, PI-R, and Y-BOCS with paired t tests, and calculation of effect sizes and confidence intervals for each questionnaire (Hedge's g). The second hypothesis, that relationships between the self-report instruments and the Y-BOCS are stronger for change scores as compared to single time measurements, was tested by calculating correlations of each self-report questionnaire, followed by comparing the strength significance of the correlations using the ZPF statistic for dependent, non-overlapping correlations as proposed by Raghunathan, Rosenthal, and Rubin (Reference Raghunathan, Rosenthal and Rubin1996).
To investigate whether or not differences in the way the Y-BOCS and the self-report measure severity, we allocated each participant to their predominant symptom domain utilising the scores on the subscales of the different versions of the PI, following a similar method previously applied by Julien, O'Connor, Aardema, and Todorov (Reference Julien, O'Connor, Aardema and Todorov2006). As noted by these authors, there currently is no standard way of subtyping in OCD, with some studies utilising the Y-BOCS, whereas others rely on subscale scores of self-report questionnaires to subtype participants (Julien et al., Reference Julien, O'Connor, Aardema and Todorov2006). Since the current study did not aim to subtype participants into discrete categories, but rather identify the most relevant predominant symptom domain of each participant according to each version of the Padua Inventory, subscale scores of the PI, PI-WSUR, and PI-R were first transformed to z scores. Next, participants were allocated to a specific group based on the highest subscale score in each of the self-report versions of the Padua. For example, a person who had the highest subscale z score on the contamination subscale of the PI as compared to any of the other PI subscales would subsequently be allocated to the ‘PI-Contamination’ group. This process was repeated for each of the other versions of the Padua Inventory. Consequently, a person was allocated to a predominant symptom domain on three occasions, based on each particular version of the Padua Inventory. If a symptom domain for each self-report measure consisted of fewer than 20 participants, then it was no longer considered in the analysis.
Utilising these criteria, and based on the PI subscales, the sample was divided among the following predominant symptom domains: PI-Impaired Mental Control Group (n = 22), PI-Contamination Group (n = 34), PI-Checking Group (n = 29), and PI-Urges and Worries Group (n = 33). Based on the PI-WSUR, the sample was divided among the following predominant symptom domains: PI-WSUR-Contamination Obsessions and Washing Compulsions Group (n = 25), PI-WSUR-Dressing/Grooming Compulsions Group (n = 24), PI-WSUR-Checking Compulsions Group (n = 22), PI-WSUR-Obsessional Thoughts of Harm to Self/Others Group (n = 22), and PI-WSUR-Obsessional Impulses to Harm Self/Others Group (n = 25). Finally, based on the PI-R subscales, the sample was divided among the following predominant symptom domains: PI-R-Impulses Group (n = 26), PI-R-Washing Group (n = 24), PI-R-Rumination Group (n = 25), PI-R-Checking Group (n = 22), and PI-R-Precision Group (n = 21).
Pearson correlations were performed between the symptom subtype change scores of the PI, PI-WSUR, and PI-R with the Y-BOCS total change scores. The significance of the differences between these correlations and the Y-BOCS with their respective OCD self-report total change scores with the Y-BOCS total change scores was then calculated using the Fisher r to z transformation (Upton & Cook, Reference Upton and Cook2008).
Results
Sensitivity of the Three Self-Report Measures and the Y-BOCS for Measuring Symptom Change
Table 1 presents t test results that indicate that there was a significant difference in the pretreatment and posttreatment scores of all three self-report measures and the Y-BOCS. There was a significant difference in the PI, PI-WSUR, PI-R, and Y-BOCS between pretreatment and posttreatment scores. Hedge's g effect size calculations were performed and are presented in Table 1. Taken individually, the Hedge's g effect size values for each instrument suggested a very high practical significance for the Y-BOCS (g = 1.79). The same sample of participants was used for all analyses; therefore, the effect sizes found for the instruments can be compared directly. A lower practical significance was found for the PI-WSUR (g = 0.86) than for the PI, and the PI-R (g of 0.97 and 0.98 respectively). The Hedge's g effect size confidence intervals are presented in Figure 1. The Y-BOCS Hedge's g effect size (95% CI [1.45, 2.05]) was significantly stronger than the Hedge's g effect sizes for the PI, PI-WSUR, and PI-R. The upper tail of the PI-WSUR was numerically lower than the Hedge's g of the PI, and PI-R. However, although they are numerically different, no significant difference was observed between the Hedge's g effect sizes of the three versions of the PI.
TABLE 1 Descriptive Statistics, t Test and Effect Size Results
Note: PI = Padua Inventory; PI-WSUR = Padua Inventory — Washington State University Revision; PI-R = Padua Inventory — Revised; Y-BOCS = Yale-Brown Obsessive-Compulsive Scale — Severity Scale.
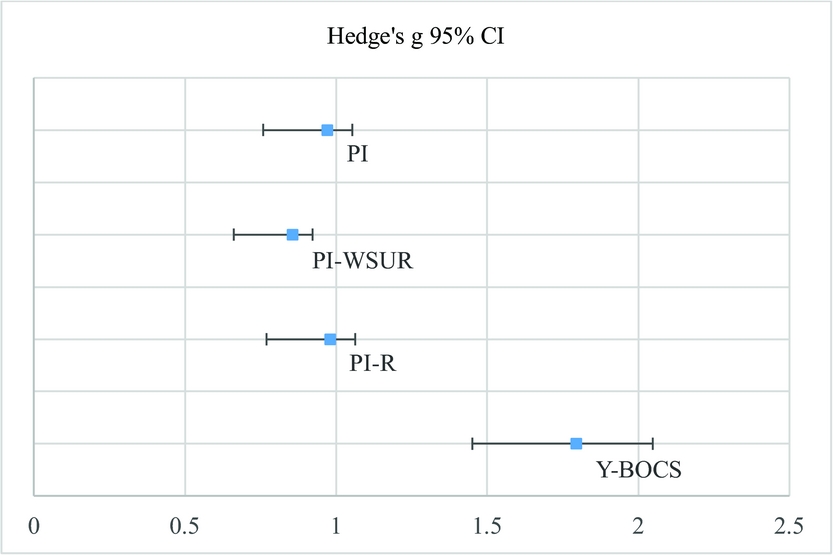
FIGURE 1 Hedge's g effect sizes (95% CI) are displayed for each instrument. The Hedge's g (95% CI) for the Y-BOCS was significantly stronger than the Hedge's g (95% CI) for the self-report questionnaires.
Relationships Between the PI Versions and the Y-BOCS for Pretreatment and Change Scores
Table 2 presents the Pearson correlations found between self-report instrument change scores and the Y-BOCS. Moderate correlations were found between the PI, PI-WSUR, and PI-R change scores with the Y-BOCS change scores. Low correlations were found between the PI, PI-WSUR, and PI-R pre-scores with the Y-BOCS pre-scores. Moderate correlations were found between the PI, PI-WSUR, and PI-R change scores with the Y-BOCS Obsessions change scores and the Y-BOCS Compulsions change scores. All correlations were numerically higher between self-report instrument change scores with the Y-BOCS change scores (r of .41 to .47) than the correlations found between self-report instrument change scores with the BDI change scores (r of .29 to .35). When controlling for BDI change scores, relationships between the PI, PI-WSUR, and PI-R change scores with the Y-BOCS change scores remained significant.
TABLE 2 Pearson Correlations Between the PI, PI-WSUR, and PI-R Pre and Change Scores With Y-BOCS Change Scores and BDI Change Scores
Note: PI = Padua Inventory; PI-WSUR = Padua Inventory — Washington State University Revision; PI-R = Padua Inventory —Revised; Y-BOCS = Yale-Brown Obsessive-Compulsive Scale — Severity Scale; Y-OBS = Yale-Brown Obsessive-Compulsive Scale items 1 to 5; Y-COMP = Yale-Brown Obsessive-Compulsive Scale items 6 to 10; BDI = Beck Depression Inventory.
* p < .05;
** p < .01.
The significance of the difference of correlation coefficients between self-report total change scores with the Y-BOCS change scores as compared to the correlation coefficients found between self-report pre-scores and the Y-BOCS pre-scores was calculated using the ZPF statistic. First, the correlation found between the PI total change scores with the Y-BOCS total change scores (r = .47) was significantly stronger than the correlation found between the PI pre scores with the Y-BOCS pre-scores (r = .22), ZPF (n = 118) = 2.56, p < .01. Second, the correlation found between the PI-WSUR total change scores with the Y-BOCS total change scores (r = .41) was significantly stronger than the correlation found between the PI-WSUR pre-scores with the Y-BOCS pre-scores (r = .21), ZPF (n = 118) = 2.06, p < .05. Finally, the correlation found between the PI-R total change scores with the Y-BOCS total change scores (r = .43) was significantly stronger than the correlation found between the PI-R pre-scores with the Y-BOCS pre-scores (r = .23), ZPF (n = 118) = 1.97, p < .05.
Relationships Between Change Scores of Self-Report Measures and the Y-BOCS in Predominant Symptom Domain Groups
Table 3 presents the Pearson correlations found between the PI, PI-WSUR, and PI-R subscale change scores and the Y-BOCS change scores in each predominant symptom domain group with more than 20 participants. First, for the PI subscales matched with the predominant symptom domain of participants, moderate to very strong correlations were found between the PI-impaired mental subscale, contamination subscale and checking subscale change scores and Y-BOCS change scores. With the exception of the PI-contamination and PI-urges and worries subscales, these correlations were numerically higher than unmatched correlations between change in the PI total score and change in Y-BOCS (r = .47). Moreover, the correlation coefficient found between the PI-impaired mental subscale change scores and the Y-BOCS total change scores was significantly stronger than the correlation coefficient found between the PI total change scores with the Y-BOCS total change scores (z = 2.23, p < .05). Second, for the PI-WSUR subscales matched with the predominant symptom domain of participants, strong correlations were found between the PI-WSUR-checking subscale and PI-WSUR-obsessional thoughts of harm to self/others subscale change scores and the Y-BOCS change scores, which were numerically higher than unmatched correlations between change in the PI-WSUR total score and change in Y-BOCS (r = .41), although none of them were significantly stronger. The other subscales did not show such significant correlations. Third, for the PI-R subscales matched with the predominant symptom domain of participants, the PI-R-rumination subscale demonstrated a very strong correlation with the Y-BOCS change scores, which was significantly stronger (z = 2.92, p < .01) than the relationship between change in the PI-R total score and change in Y-BOCS (r = .43). None of the other subscales of the PI-R showed stronger correlations than those between change in the PI-R total score and change in Y-BOCS when matched with predominant symptom domains.
TABLE 3 Pearson Correlations Found Between Y-BOCS Change Scores and the PI, PI-R and PI-WSUR Subscales Matched With The Predominant Symptom Domain Of Participants
Note: PI = Padua Inventory; PI-WSUR = Padua Inventory — Washington State University Revision; PI-R = Padua Inventory — Revised; Y-BOCS = Yale-Brown Obsessive-Compulsive Scale — Severity Scale.
* p < .05;
** p < .01
When considering the Y-BOCS obsession and compulsion subscales separately, a similar pattern of correlations emerged, with the exception of the contamination subscales of the different versions of the PI. Lastly, whereas no significant relationships were observed between change in these scales with change in total Y-BOCS scores and change in the Y-BOCS obsessions subscale, there were moderate to strong relationships with the Y-BOCS compulsions subscale for the PI-Contamination Group, the PI-R-Washing Group, and the PI-R-Precision Group change scores.
Discussion
The current study had two main aims. First, to compare the sensitivity of three different versions of the Padua Inventory and the Y-BOCS as measures of treatment outcome. Second, the study aimed to investigate the relationship between change in self-report measures with change in Y-BOCS before and after treatment, and whether weak relationships found in previous studies can be explained by differences in these questionnaires. Specifically, it was hypothesised that these weak relationships emerge because self-report measures primarily measure symptom severity based on content, whereas the Y-BOCS measures symptom severity independent of content.
Our first hypothesis, namely that the Y-BOCS would be significantly more sensitive to measure treatment outcome, was confirmed. This result is consistent with previous findings that report larger effect sizes in observer-rated scales than self-report questionnaires (Taylor, Reference Taylor1995, Reference Taylor, Swinson, Antony, Richter and Rachman1998; van Balkom et al., Reference van Balkom, van Oppen, Vermeulen, van Dyck, Nauta and Vorst1994). Unlike previous reports, the current study investigated these differences by comparing confidence intervals allowing for testing of significant differences, in addition to testing this hypothesis in the same sample, adding to the significance of these findings.
No differences were found in the sensitivity of the different versions of the PI as measures of treatment outcome, with generally moderate to large effect sizes when comparing before and after treatment assessments. Effect sizes were similar for all three self-report instruments, with no significant differences, although numerically speaking, the smallest effect was found for the PI-WSUR. Overall, however, these results indicate that in terms of sensitivity to measuring treatment outcome, there are no differences between these questionnaires, although other considerations might guide the choice of which questionnaire to use in treatment outcome research, such as, for example, the time duration available for questionnaire completion by participants, or previous research results on concurrent and divergent validity. Comorbidities might also be a deciding factor, as some versions of the questionnaire were less sensitive in measuring OCD specific phenomenon.
Our second aim was to investigate the relationship of change in three self-report versions of the PI with the Y-BOCS. Our second hypothesis, namely that correlations between the PI versions and the Y-BOCS would be significantly stronger for change in symptoms as compared to the relationship of these measures at a single point in time, was supported. Correlations found between the change scores of the PI, PI-WSUR, and PI-R with the Y-BOCS change scores were higher than correlations found between these instruments in previous cross-sectional studies (Anholt et al., Reference Anholt, van Oppen, Emmelkamp, Cath, Smit, van Dyck and van Balkom2009; Mataix-Cols et al., Reference Mataix-Cols, Fullana, Alonso, Menchón and Vallejo2004; Thordarson et al., Reference Thordarson, Radomsky, Rachman, Shafran, Sawchuk and Hakstian2004). Examination of these change score correlations revealed that the three self-report instruments performed nearly equally in terms of being associated to the Y-BOCS change scores. In addition, change score correlations between the PI, the PI-WSUR and the PI-R with the Y-BOCS were significantly stronger than the correlations found between the pretreatment scores of the PI, PI-WSUR and PI-R with the Y-BOCS. Results thus suggest that treatment outcome research yields stronger correlations between these versions of the PI and the Y-BOCS, which is consistent with correlations reported in previous longitudinal studies (Beşiroğlu et al., Reference Beşiroğlu, Ağargün, Boysan, Eryonucu, Güleç and Selvi2005; van Oppen, Emmelkamp et al., Reference van Oppen, Emmelkamp, van Balkom and van Dyck1995). These relationships could not be explained by change in depression scores, suggesting that the relationship between self-report measures and the Y-BOCS is not merely an artifact of changes in mood unrelated to change in obsessionality. Hence, low interrelationships between self-report questionnaires and the Y-BOCS appear to be more of a concern in cross-sectional studies than in treatment outcome studies, which measure change in symptoms over time.
Although change scores between these self-report measures and the Y-BOCS appear to be higher than relationships that exist at single time measurements, relationships remained modest. This suggests that self-report questionnaires do measure unrelated features of OCD to some extent, which raises the question of which measure would be best recommended in research and practice. Some have suggested that both types of measures be used, but without any explanation for why correlations between the Y-BOCS and self-report instruments are low, it remains unclear what specific benefit this might offer beyond assessing participants’ direct experience. For this reason, we re-examined a previously rejected hypothesis posed by Anholt et al. (Reference Anholt, van Oppen, Emmelkamp, Cath, Smit, van Dyck and van Balkom2009) that differences might be due to the PI measuring severity based on content, whereas the Y-BOCS measured severity independent of content. To investigate this third hypothesis, we allocated patients into predominant symptom domain groups with the expectancy that relationships between change scores on self-report measures and the Y-BOCS would be significantly stronger when considering the predominant symptom domain of patients, as compared to the relationships that exist independent of predominant symptom domain.
Support for our third hypothesis was mixed. For a substantial portion of the self-report subscales, when these were matched with predominant symptom domain groups, they showed stronger correlations with change in Y-BOCS scores than between the change in self-report total scale scores and the Y-BOCS scores. In particular, the symptom subtype correlation coefficients for the PI-impaired mental control subscale and the PI-R-rumination subscale change scores were significantly stronger than the correlation coefficient found between their respective total self-report change scores and Y-BOCS change scores. Hence, the results suggest that measuring symptoms based on content does appear to contribute to the modest relationships of these measures with the Y-BOCS, at least for some predominant symptom domains. However, not all of the self-report subscales showed stronger relationships when matched with predominant symptom domains, and in some cases, the relationships with change in Y-BOCS scores was even non-significant. Hence, we must conclude that differences in which symptoms are measured between the self-report measures and Y-BOCS can only provide a partial account for modest relationships between both measures.
The current study has several practical implications. First, the results suggest that in terms of overall OCD severity, the Y-BOCS is a more sensitive instrument than self-report questionnaires that measure severity on the basis of content. Moreover, results suggest that the lower sensitivity of the different versions of the PI can in part be explained by total scores that do not optimally represent symptom severity. As noted earlier, for some of the self-report subscales, relationships with Y-BOCS change scores were significantly stronger when considering predominant symptom domains in each patient subtype as compared to total change scores of the PI. Consequently, a person with severe symptomatology in only one particular symptom domain may not necessarily score as high on self-report questionnaires as a person with less severe symptomatology in multiple symptom domains, as previously pointed out by Abramowitz et al. (Reference Abramowitz, Deacon, Olatunji, Wheaton, Berman, Losardo and Adams2010).
Second, although total scores of self-report measures based on content may not be optimal for the measurement of severity, this does not appear to be the case to the same extent when matching participants with specific subscales. Yet the specific benefits of utilising self-report questionnaires for measuring treatment outcome remains unclear. While the procedure of allocating participants into a predominant symptom domain and utilising subscales to measure treatment outcome can be easily implemented in most outcome studies, it is not yet clear whether this results in a higher sensitivity in measuring treatment outcome as compared to change in Y-BOCS scores. However, results do indicate that, at least for some subscales, this might be preferable than the use of self-report total scores. These questions need further investigation in future studies before more specific recommendations can be made.
Limitations should be noted. The participant sample size of each predominant symptom domain group was relatively small, and further research with larger samples is needed to explore the relation between OCD clinician-administered instruments such as the Y-BOCS and subscales from self-report measures, including the Padua Inventory, but also more recent questionnaires, such as the Vancouver Obsessional-Compulsive Inventory (Thordarson et al., Reference Thordarson, Radomsky, Rachman, Shafran, Sawchuk and Hakstian2004) or the Dimensional Obsessive-Compulsive Scale (Wheaton, Abramowitz, Berman, Riemann, & Hale, Reference Wheaton, Abramowitz, Berman, Riemann and Hale2010; see Overduin and Furnham, Reference Overduin and Furnham2012, for a review of OCD self-report measures). Another limitation was the use of the PI to carry out statistical analyses for the PI-R and the PI-WSUR. Although these versions utilise items found in the original PI, they contain fewer items overall. As such, participants may have taken less time to complete these two versions and may have responded differently than to the PI, which could have affected results. However, using all three versions of the PI as separate questionnaires might have generated more bias due to the repetition of many items.
Overall, the current results support the Y-BOCS as the main instrument of choice for measuring OCD severity, while an appropriate level of caution should be taken with self-report measures based on content. Self-report questionnaires might be better suited for measuring the effectiveness of treatments in specific symptom domains, but further investigation into the specific advantages of self-report questionnaires is needed. Building on previous findings, the present study represents an important step in that direction, which we hope will inspire future studies in this area.
Disclosure and Acknowledgments
The authors have no conflicts of interest to report. This study was supported by grants (no. 111261; no. 114905) from the Canadian Institutes of Health Research (CIHR). The last author is also a recipient of a research scholar award from the Quebec Health Research Fund (Fonds de recherche du Québec – Santé).


