


Implications
Mycotoxins are present in almost all feedstuffs used in animal nutrition, and the effects can be manifested in reproductive, immunological and performance disorders. The data suggest that feedlot Nellore bulls fed finishing diets containing exogenous contamination of mycotoxins exhibited poorer performance compared to those fed diets that were naturally contaminated. When a mycotoxin adsorbent was added to the diet with exogenous contamination, the performance of the animal was partially recovered. Therefore, our results may be useful for improving performance in beef cattle.
Introduction
The effects of mycotoxins in animals depend on the amount consumed, exposure time, type of toxin and interaction among different toxins (Upadhaya et al., Reference Upadhaya, Park and Ha2010). These effects may manifest as reproductive, immunological and performance disorders (Zain, Reference Zain2011). Since 1968, it is known that mycotoxins affect the performance and liver and kidney weights of beef cattle (Garrett et al., Reference Garrett, Heitman and Booth1968). Additionally, a recent study by Custodio et al. (Reference Custodio, Prados, Yiannikouris, Holder, Pettigrew, Kuritza, Resende and Siqueira2019) outlined that at least one mycotoxin is present in samples of feedlot diets collected in Brazil. However, studies evaluating the effects of mycotoxins on ruminants were developed mainly with dairy cattle (Fink-Gremmels, Reference Fink-Gremmels2008; Chaiyotwittayakun, Reference Chaiyotwittayakun2010; Santos and Fink-Gremmels, Reference Santos and Fink-Gremmels2014). Fink-Gremmels (Reference Fink-Gremmels2008) concluded that the major effects of the mycotoxins present in feed included reduced DM intake and, consequently, reduced milk production and reproduction in dairy cattle. Moreover, Osweiler et al. (Reference Osweiler, Kehrli, Stabel, Thurston, Ross and Wilson1993) observed that the ingestion of fumonisins could elevate the serum enzyme activity of liver enzymes, suggesting impairment of liver function.
In a review, Jouany (Reference Jouany2007) explained that mycotoxin adsorbents can be an effective strategy to reduce or even control the harmful effects of these toxins. Adsorbents can decrease mycotoxin absorption by animals, creating stable chemical interactions with toxins and further limiting their bioavailability in the gastrointestinal tract (Yiannikouris and Jouany, Reference Yiannikouris and Jouany2002). Merril et al. (Reference Merrill, Bohnert, Harmon, Craig and Schrick2007) studied the milk production of beef cattle (Angus × Hereford) fed mycotoxin-contaminated diets and observed a linear increase in milk production (9.8 to 14.2 kg/day) as the intake of a yeast cell wall adsorbent increased (0 to 60 g/day). However, studies with beef cattle and the effects of mycotoxin adsorbents on performance are scarce.
The hypothesis of this experiment was that the consumption of mycotoxins would decrease the performance of Nellore bulls finished in the feedlot and that the yeast cell wall adsorbent may attenuate this damage. The objective of this experiment was to evaluate the effects of mycotoxin levels and adsorbent usage on the intake and performance of Nellore cattle finished in feedlots.
Material and methods
Experimental animals and treatments
This experiment was conducted at Agência Paulista de Tecnologia dos Agronegócios (APTA) in Colina, SP, Brazil. The experimental period lasted 97 days, divided into an adaptation period of 28 days and a finishing period of 69 days. The animals received treatment diets during the entire experimental period (97 days). In total, 100 contemporary Nellore bulls (430 ± 13 kg BW; 24 ± 4 months old) were used in a randomized complete block design (blocked by initial BW; animals were stratified and assigned to eight blocks) in a 2 × 2 factorial arrangement of treatments. Animals were then assigned randomly within the block to pens, and each pen was randomly assigned to one of the four treatments. Four animals, representative of different BW blocks, were slaughtered at the beginning as the baseline group to represent the initial carcass weight of the remaining animals. The remaining animals were allocated into 32 (three animals per pen) 4 m × 15 m (totaling area 60 m2, feed bunk of 4 m) open-air feedlot pens that were equipped with individual water fountains with 100 l capacity, with a high flow valve and covered trough.
The treatments were evaluated in a 2 × 2 factorial arrangement to investigate the main effects of diets and adsorbents and their interactions. The main effect of diet was evaluated by implementing two different diets with different mycotoxin contaminations (Table 1). The main effect of the adsorbent was established by the presence or absence of the adsorbent in the diet (1 g/kg of DM). The organic mycotoxin adsorbent (ADS; Mycosorb A+, Alltech, Nicholasville, KY, USA) was composed of internal yeast cell walls (Saccharomyces cerevisiae) and algae. At the beginning of the study, the ADS was added to all mineral mixes of animals receiving this treatment. The dietary treatments included (1) a diet with natural contamination (NC); (2) a diet with natural contamination + the adsorbent (NC + ADS); (3) a diet with exogenous contamination (EC) and (4) a diet with exogenous contamination + the adsorbent (EC + ADS).
Table 1 The most frequent mycotoxins found in diets and their concentration in the natural and exogenous contaminated diets of Nellore cattle finished in feedlot

DON = deoxynivalenol; NC = diet with natural contamination; EC = diet with exogenous contamination; REQ = risk equivalent quantities.
1 Aflatoxin: B1 + B2 + G1 + G2; fumonisin: B1 + B2; trichothecenes B: DON, 15-acetyl DON, 3-acetyl DON, fusarenol X, nivalenol, and DON 3-glycoside; trichothecenes A: T-2, H-T2, diacetoxyscirpenol and neosolaniol.
2 NC: REQ = 15.0 µg/kg.
3 EC: REQ = 45.0 µg/kg.
Mycotoxin production and evaluation in the diets
The identity and dose of mycotoxins used in this study were based on a survey previously conducted by Custodio et al. (Reference Custodio, Prados, Yiannikouris, Holder, Pettigrew, Kuritza, Resende and Siqueira2019). This initial survey aimed to identify the types of mycotoxins that mainly occurred in feedlots from 30 different production ranches and to establish the mycotoxin levels present in feedstuffs used in beef cattle feedlot diets in Brazil.
The mycotoxins aflatoxins B1 + B2, fumonisins B1 + B2 + B3, trichothecenes A (T-2 toxin) and B (deoxynivalenol (DON)) were produced individually at College of Agriculture Luiz de Queiroz, University of São Paulo. The production of mycotoxins was conducted via natural fermentation of corn or wheat by mycotoxin-producing fungal species. A strain of Aspergillus flavus was used for aflatoxin B1 and B2 production, a strain of Fusarium verticilioides for fumonisins, a strain of Fusarium graminearum for trichothecene B and a strain of Fusarium sporotrichioides for trichothecene A. The concentration of each mycotoxin in the diet was standardized throughout the experimental period, and these mycotoxins were weighed and added to the diets daily during the mixing of feedstuffs (only in the exogenously contaminated diets). The mycotoxins were stored in a sterilized room until use. Every day, 100 g of contaminated corn produced in the laboratory was added to achieve exogenous contamination.
Once a week, a sample of each feedstuff used in the diets was collected, and a composite sample was analyzed at the end of the experiment. The composite samples were sent to the Alltech 37® + Analytical Services Laboratory (Lexington, KY, USA), where mycotoxin evaluation was performed and comprised two distinct steps. In the first step, the absolute quantification of 38 different mycotoxins was performed using a validated and ISO/IEC 17025:2005 accredited method by means of ultra-performance liquid chromatography electrospray ionization tandem MS (Waters Acquity Tqd; Waters Corp., Milford, MA, USA), involving an isotopic dilution step and a data normalization process. In the second step, the mycotoxin concentrations were further interpreted according to known species-specific sensitivities and normalized according to the principles of toxic equivalent factors, determining the risk equivalent quantities (REQs) expressed in µg/kg of aflatoxin B1 equivalent (Yiannikouris, Reference Yiannikouris2015; Table 1).
Feed management
Bulls were acclimated to the assigned finishing diet during a 28-day acclimation period. During the first 21 days, the animals received the acclimation diet (Table 2); during the subsequent 7 days, the bulls received a mixture of the acclimation and finishing diets (50 : 50) and after day 28, the animals received the finishing dietalone. Diets were formulated to meet the nutrient requirements of Nellore bulls gaining 1.5 kg daily (National Academies of Sciences, Engineering, and Medicine, 2016).
Table 2 Ingredients used in the diets and chemical composition of the diets of Nellore cattle finished in feedlot
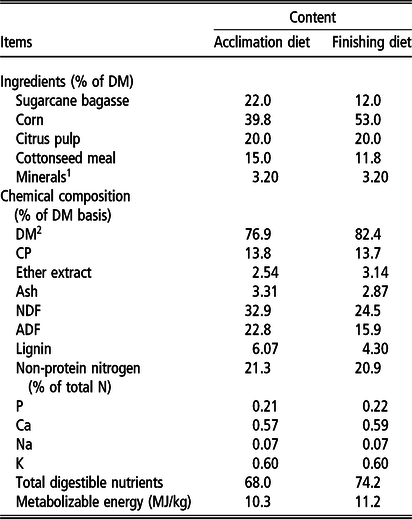
1 Mineral = Na: 43 g/kg; Ca: 106 g/kg; P: 12.6 g/kg; S: 34 g/kg; Mg: 14.1 g/kg; P: 76 g/kg; Mn: 382 mg/kg; Zn: 1231 mg/kg; Fe: 373 mg/kg; Cu: 373 mg/kg; Co: 49 mg/kg; I: 36 mg/kg; Se: 5 mg/kg; F: 106 mg/kg; monensin: 800 mg/kg; vitamin A: 89 992 IU/kg; non-protein nitrogen: 88.8%; CP: 91.1%.
2 The DM content was adjusted with water to 65%.
The diet was provided daily at 0800 h, using a mixer wagon (RX-40 E; Casale, São Carlos, SP, Brazil) equipped with a scale. The diets were provided ad libitum (Table 2), while the orts were weighed daily, and the amount of feed offered was adjusted daily to maintain 1% to 3% orts and to measure DM intake (DMI).
Chemical analyses
Chemical analyses of ingredient samples were carried out at the Laboratory (APTA, Colina, SP, Brazil). Samples were partially dried at 55ºC in a forced draft oven for 72 h, ground in a knife mill (Thomas Model 4 Wiley; Thomas Scientific, Swedesboro, NJ, USA) using a 1-mm mesh sieve, and then stored for further chemical analysis.
The contents of DM (method 934.01), ash (method 942.05), CP (method 978.04) and ether extract (method 920.39) were measured according to recommendations of the Association of Official Analytical Chemists (AOAC; 1995). The contents of NDF and ADF were determined by sequential analysis as described by Mertens (Reference Mertens2002). Cellulose was solubilized using 72% sulfuric acid, whereby the lignin content was obtained by the difference from the ADF. The samples were subjected to nitric acid digestion and inductively coupled plasma spectroscopy analyses for minerals (Ca, P, Na and K) (method 975.03; AOAC, 1995).
Blood sampling
On days 0, 14, 28 and 97, all animals were fasted for 8 h, then blood was collected via jugular venipuncture. Serum blood samples were collected into tubes without avoiding hemolysis, placed on ice and centrifuged (3000× g for 20 min at 4°C) within 1 h after collection. The samples were then placed in labeled Eppendorf tubes and stored at −20°C until subsequent analysis for the following serum enzymes: aspartate aminotransferase (AST) and gamma-glutamyl transferase (GGT). Enzyme analyses were performed colorimetrically using commercial kits (LabQuest, Campinas, SP, Brazil).
The contents of total protein, urea, creatinine, total cholesterol and triglycerides were analyzed using an automatic analyzer with high performance for biochemical and turbidimetric tests (Labmax Plenno, Nasu-Gun, Tochigi, Japan).
Slaughter and animal performance
At the beginning of the experiment, after an 8 h fast, four animals (randomly selected) were transported to the slaughterhouse (Minerva Foods, Barretos, SP, Brazil) located 20 km from the research facility. After arrival at the slaughterhouse, animals were kept in resting pens for 18 h (free access to water) and then submitted to humanitarian slaughter under Brazilian Federal Inspection, and the hot carcass weight (HCW) was obtained. After slaughter, carcasses were placed at cold chamber for 24 h at a temperature of 2°C.
Carcass gain was calculated using a linear equation to predict the initial HCW of the remaining animals. The equation was applied to the initial BW to determine a predicted initial HCW, as follows (equation (1)):
 $${\rm{HCWinitial}} = - 38.9 \pm 30.4 + 0.613 \pm 0.065 \times {{\rm{BWinitial }}\,({R^{{2}}} = 0.978;\ \!{\rm{ RMSE}} = 9.08)}$$
where HCWinitial is the initial HCW (kg) and BWinitial is the initial BW (kg).
After 97 days of the experiment and 8 h of fasting, all remaining animals were slaughtered following the same procedure as that of the baseline groups, and the final HCW was obtained. Carcass-adjusted gain was determined by subtracting the final HCW from the initial HCW. Carcass-adjusted feed efficiency was calculated by dividing carcass gain (kg/day) by DMI.
Carcass-adjusted final BW was calculated from HCW divided by the average dressing percent of all treatments. Carcass-adjusted average daily gain (ADG) ((final BW – initial BW)/97) and feed efficiency (ADG/DMI) were calculated.
Organs and histopathology
After animals were harvested, the liver and kidneys of all animals were weighed, and samples for color and histopathology examination were collected. For histopathology, kidney samples were obtained from the cortical, medullar and pelvic layers (renal papilla). Liver samples were obtained from the caudate lobe, diaphragmatic surface and left lobe. The kidney and liver samples had a maximum thickness of 0.5 cm and were fixed in buffered formalin solution. After fixation, the samples were stained with hematoxylin and eosin. The assessment of lesions/tissue changes was based on the methodology described by Kraieski et al. (Reference Kraieski, Hayashi, Sanches, Almeida and Santin2017). The liver and kidney colors (L* = lightness; a* = redness; b* = yellowness) were also analyzed.
Statistical analyses
The experiment was conducted in a randomized complete block design with a 2 × 2 factorial arrangement of treatments. The pen was considered the experimental unit, and the block was considered the random effect (eight blocks; one replication per block; eight pens per treatment; three animals per pen). For all statistical analyses, the MIXED procedure of SAS (SAS Institute Inc., Cary, NC, USA) was used with the fixed effects of contamination, ADS and the contamination × ADS interaction.
The analysis of blood and DMI was submitted to ANOVA as repeated measures over time using mixed models, using the REPEATED statement of SAS (SAS Institute Inc.). The day (or week for DMI) was considered the repeated measure, and the subject was considered the pen. For blood variables, the initial collection was considered a covariate. Different residual covariance structures were tested (15 covariance structures) to determine the structure that best fits each variable. The covariance structure was chosen using the Bayesian information criteria, and the lowest value was considered to be the best fit.
Differences were considered significant when P < 0.05, while a trend was considered when 0.05 ≤ P ≤ 0.10.
Results
Dry matter intake, performance and carcass traits
There was no interaction (P = 0.92) between contaminated diets and the use of ADS on DMI (Table 3). However, there was a tendency (P = 0.09) of 5.14% lower DMI in animals fed the diets with exogenous contamination compared to that in animals fed the natural diets. When analyzed as repeated measures (weekly), there was an interaction between diet and period (P = 0.01). The DMI of animals fed the EC diets was lower (P = 0.01) than that of animals fed NC diets during 6 weeks of the whole study period (Figure 1).
Table 3 Performance and efficiency of Nellore cattle finished in feedlot fed diets with natural mycotoxin contamination and exogenous contamination with or without adsorbent
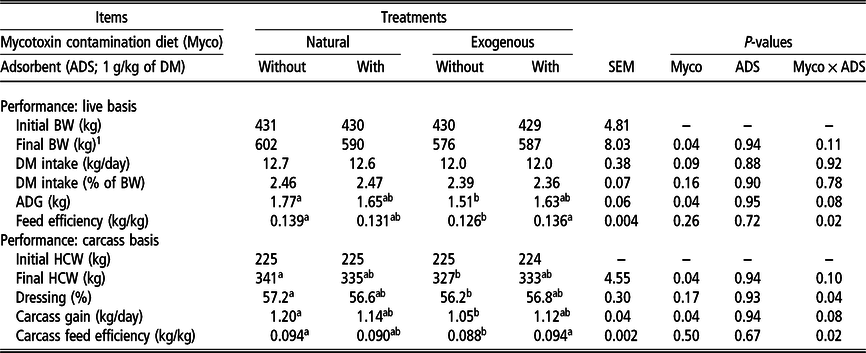
Myco = effect of the diet; ADS = effect of presence or absence of adsorbent; Myco × ADS = interaction between diet and adsorbent; ADG = average daily gain; HCW = hot carcass weight.
1 FinalBW is calculated from hot carcass weight divided by the average dressing percent of all treatments; DM intake in % of BW, ADG and feed efficiency were calculated through the adjusted final BW.
a,bValues within a row with different letters differ significantly at P < 0.05.

Figure 1 Dry matter intake of Nellore cattle fed diets with natural mycotoxin contamination and exogenous contamination, with or without yeast-derivate adsorbent (ADS), measured weekly during feedlot. Mycotoxin P = 0.06, ADS P = 0.86, mycotoxin × ADS interactions P = 0.91, period P < 0.01, mycotoxin × period interactions P = 0.01, ADS × period interactions P = 0.94, mycotoxin × ADS × period interactions P = 0.78. DMI = DM intake; NC = diet with natural contamination; EC = diet with exogenous contamination; *Indicated significant difference among diets (P < 0.05). #Indicated a tendency of significant difference among diets (0.05 ⩽ P ⩽ 0.10).
The final BW was affected by the contaminated diets (P = 0.04). Animals fed the NC diets were 14.5 kg heavier than animals fed the EC diets (Table 3). Similarly, the ADG was affected by the contaminated diets (P = 0.04). Animals fed the natural contamination diets had 1.71 kg/day of ADG compared to the 1.57 kg/day of animals fed the exogenous contamination diets.
There was an interaction between contaminated diets and ADS for dressing percentage (P = 0.04) and carcass feed efficiency (P = 0.02), and there was a tendency of interaction among factors for final HCW (P = 0.10) and carcass gain (P = 0.08; Table 3). Animals fed the NC diets had a 1.78-fold greater dressing percentage than that of animals fed the EC diets. However, animals fed the NC + ADS and EC + ADS diets had similar dressing percentages compared to those of animals fed the NC and EC diets. Animals fed the NC and EC + ADS diets had greater carcass feed efficiency than those fed EC. Animals fed the NC + ADS diet had a similar carcass feed efficiency compared to that of animals fed the NC, EC + ADS and EC diets. The HCW of animals fed the NC was 14 kg greater than that of animals fed the EC diets. Finally, the highest carcass gain was observed for animals fed the NC diets, and the lowest was observed for those fed the EC diets. Moreover, the NC + ADS and EC + ADS treatments presented intermediate values, and they did not differ significantly from those of the NC and EC treatments.
Metabolic variables
The serum enzymes AST and GGT were not different among factors (P ≥ 0.19; Table 4). However, these enzymes were affected by the day of collection (P < 0.01). The two enzymes presented higher concentrations in the serum at the end of the experiment (P < 0.01). On average, AST and GGT were present at 74.6 and 30.7 U/l, respectively, at the end of the experiment compared with 60.0 and 23.3 U/l, respectively, at the beginning of the study.
Table 4 Blood parameters of Nellore cattle finished in feedlot fed diets with natural mycotoxin contamination and exogenous contamination with or without adsorbent

Myco = effect of the diet; ADS = effect of presence or absence of adsorbent; Myco × ADS = interaction between diet and adsorbent; AST = aspartate aminotransferase; GGT = gamma-glutamyl transferase; TP = total protein; CR = creatinine; TC = total cholesterol; TR = triglycerides; D = effect of the day; Myco × D = interaction between diet and day; ADS × D = interaction between adsorbent and day.
Three-way interaction (diet, adsorbent and day) was not significant (P ≥ 0.18).
Serum concentrations of total protein, total cholesterol and triglycerides did not present interactions among factors (P ≥ 0.17; Table 4). However, the concentrations of urea and creatinine tended to interact among factors (P = 0.08; Figure 2). Urea was greater for the NC + ADS and EC diets than for the NC and EC + ADS diets. In contrast, creatinine was greater for the NC diets than for the other treatments. There was an interaction between diet contamination and experimental period for urea and creatinine (P ⩽ 0.04). The values of urea increased by 9.10 mg/dl for the NC diets and 1.25 mg/dl for the EC diets at the end of the experiment. Creatinine concentrations of animals fed the NC diets increased from 1.85 mg/dl on day 14 to 1.88 mg/dl on day 96; however, animals fed the EC diets had similar values over time (1.85 mg/dl).

Figure 2 Urea concentration (mg/dl) in blood of Nellore cattle fed diets with natural mycotoxin contamination and exogenous contamination, with or without yeast-derivate adsorbent. Mycotoxin P = 0.30, ADS P = 0.78, mycotoxin × ADS interaction P = 0.08. NC = diet with natural contamination; EC = diet with exogenous contamination; ADS = presence of adsorbent (1 g/kg of DM). a,bValues differ significantly at P < 0.05.
There was no interaction between contaminated diets and ADS for liver weight (P = 0.78) and kidney weight (P = 0.11; Table 5). However, kidney weight tended to be lower with the use of ADS in the diets (P = 0.09). There was no effect of contamination in the diets, ADS usage or an interaction among factors on the histopathology of the liver (P ≥ 0.33) and kidneys (P ≥ 0.14).
Table 5 Weight, histopathology, and colors of liver and kidney of Nellore cattle finished in feedlot fed diets with natural mycotoxin contamination and exogenous contamination with or without adsorbent

Myco = effect of the diet; ADS = effect of presence or absence of adsorbent; Myco × ADS = interaction between diet and adsorbent; liver/100 kg of carcass = liver for 100 kg of carcass; kidneys/100 kg of carcass = kidneys for 100 kg of carcass.
1 Total tissue scores of liver and total tissue scores of kidneys = stained with hematoxylin and eosin (HE), magnification ×200 of an optical microscope.
2 L* = lightness; a* = redness; b* = yellowness.
The results for organ color (Table 5) did not present interactions (P ≥ 0.10) between diets and ADS. However, the L* color value of the kidneys was greater for animals fed diets without the ADS than for those fed diets with ADS supplementation. In addition, the b* color value of the kidneys decreased for animals fed the contaminated diets and for those administered the adsorbent (P < 0.01).
Discussion
This study shows the effects of mycotoxins and a yeast-based adsorbent on beef cattle performance. There are few studies examining the effects of mycotoxins on beef cattle (Merril et al., Reference Merrill, Bohnert, Harmon, Craig and Schrick2007; Tagaki et al., Reference Tagaki, Uno, Kokushi, Shiga, Mukai, Kuriyagawa, Takagaki, Hasunuma, Matsumoto, Okamoto, Shahada, Chenga, Deguchi and Fink-Gremmels2011); however, these previous studies evaluated isolated mycotoxins. Multiple toxins are normally found in the diet (Zain, Reference Zain2011; Custodio et al., Reference Custodio, Prados, Yiannikouris, Holder, Pettigrew, Kuritza, Resende and Siqueira2019), and mycotoxins can act synergistically in animals (Yiannikouris and Jouany, Reference Yiannikouris and Jouany2002).
In the present study, it was observed that exogenously contaminated diets affected the DMI during almost the entire experimental period. Although not measured, it is hypothesized that this may be due to metabolic disruptions in the rumen and intestine of cattle fed the EC diet. According to Santos and Fink-Gremmels (Reference Santos and Fink-Gremmels2014), mycotoxins can impair rumen function and impair the metabolism of carbohydrates. Additionally, Gallo et al. (Reference Gallo, Giuberti, Frisvad, Bertuzzi and Nielsen2015) declared that some mycotoxins have antimicrobial activity and are able to reduce microbial activity in the rumen and intestine, which can decrease the degradation rate, NDF digestibility, rumen mobility and microbial protein and affect the DMI. However, these data still scarce (Gallo et al., Reference Gallo, Giuberti, Frisvad, Bertuzzi and Nielsen2015). Wang et al. (Reference Wang, Zhang, Zheng, Guo, Song, Zhao and Wang2019) declared that aflatoxins can affect the ruminal concentrations of acetate, propionate, butyrate, valerate, isovalerate and isobutyrate in dairy cows. Nevertheless, such effects can cause economic losses. Moreover, mycotoxins can affect the function of vital organs and cause immunosuppression (Tagaki et al., Reference Tagaki, Uno, Kokushi, Shiga, Mukai, Kuriyagawa, Takagaki, Hasunuma, Matsumoto, Okamoto, Shahada, Chenga, Deguchi and Fink-Gremmels2011); however, in the present study, the relatively chronic mycotoxin challenge did not impact metabolic organs, perhaps due to the low exogenous contamination diet.
Dry matter intake strongly influences animal performance. Thus, the final BW and ADG were affected by different DMI values and by impairments in the digestive tract. According to Santos and Fink-Gremmels (Reference Santos and Fink-Gremmels2014), if animals are exposed long term to mycotoxins, an impairment of the rumen microbiota is likely to occur, reducing feed efficiency, which may be explained by the antimicrobial activity of some mycotoxins. Additionally, mycotoxins can impact intake or feed refusal and nutrient absorption and impair metabolism (Rodrigues, Reference Rodrigues2014). In this way, mycotoxin contamination of the diet reduced the growth rate and, consequently, feed efficiency, and the ADS was able to recover part of this damage. Likewise, Merril et al. (Reference Merrill, Bohnert, Harmon, Craig and Schrick2007) studied the use of ADS and observed that increasing the amount of yeast cell wall in the diet increased milk production of Angus × Hereford cows consuming high-ergot-alkaloid tall fescue.
In this study, the lower DMI values arguably explain part of the reduction in performance of animals fed the EC diet compared to that of those fed the NC diet, and maybe the other part was caused by damage to animal metabolism (Wang et al., Reference Wang, Zhang, Zheng, Guo, Song, Zhao and Wang2019). Analyzing the beef cattle requirements (BR-CORTE; Valadares Filho et al., Reference Valadares Filho, Costa e Silva, Gionbelli, Rotta, Marcondes, Chizzotti and Prados2016) and DMI to reach the observed final BW suggests that the different DMI in treatments explains approximately 60% of the difference in growth rate, and the other 40% is probably due to other factors such as rumen motility, NDF digestibility and degradation rate (Gallo et al., Reference Gallo, Giuberti, Frisvad, Bertuzzi and Nielsen2015). Moreover, some mycotoxins have antimicrobial activity, as explained above, and this can damage the digestibility and metabolism of nutrients impairing animal performance.
The ADS did not increase the DMI, which may be the reason it recovered only part of the loss in growth rate caused by the toxins. However, the ADS, by chemically interacting with the mycotoxins, prevented these toxins from damaging the metabolism, for example, causing subacute rumen acidosis, thereby allowing animals to recover some of the lost performance caused by the EC diet.
Yeast cell walls and their constituents have been shown to adsorb a large spectrum of mycotoxins in vitro (Yiannikouris et al., Reference Yiannikouris, Andre, Poughon, Franções, Dussap, Jeninet, Bertin and Jouany2006) and in vivo to alleviate the effects of dietary mycotoxin exposure in several species (Diaz et al., Reference Diaz, Hagler Junior, Blackwelder, Eve, Hopkins, Anderson, Jones and Whitlow2004; Meissonnier et al., Reference Meissonnier, Raymond, Laffitte, Cossalter, Pinton, Benoit, Bertin, Galtier and Oswald2009). However, the efficacy of this adsorbent depends on the type of mycotoxin (Patience et al., Reference Patience, Myers, Ensley, Jacobs and Madson2014). Kong et al. (Reference Kong, Shin and Kim2014) studied yeast cell wall activity in vitro and observed adsorption of 92.7% aflatoxin but only 22.9% adsorption of DON. Other factors can influence the adsorbent effects in vivo, including the level of diet contamination, type of diet and adsorption rate (Kong et al., Reference Kong, Park and Kim2016).
The partial performance recovery of ADS was reflected in ADG and carcass gain. No data were found in the literature related to the carcass weight of beef cattle fed mycotoxin-contaminated diets and adsorbents. However, Rossi et al. (Reference Rossi, Rutz, Lima, Nunes, Anciuti, Moraes, Silva, Silveira and Maier2010) observed a lower dressing percentage and breast weight for chickens fed diets contaminated with aflatoxin B1 than those of chickens fed uncontaminated diets. However, Rossi et al. (Reference Rossi, Rutz, Lima, Nunes, Anciuti, Moraes, Silva, Silveira and Maier2010) detected an improvement in dressing percentage when a similar ADS to the one used in the present study was added to the diet. This can be explained by the ability of the ADS to interact with mycotoxins, inactivating them.
The ADS (β-d-glucan fraction of yeast cell wall) is involved in the mycotoxin binding, and its structure modulates the attachment strength (Yiannikouris et al., Reference Yiannikouris, Francois, Poughon, Dussap, Bertin, Jeminet and Jouany2004a). Hydrogen and van der Waals bonds have been evidenced in glucan-mycotoxin complexes, and they are stable at the pH level of the digesta in the entire gastrointestinal tract and could contribute to proving the reliability of these adsorbents against mycotoxins (Yiannikouris et al., Reference Yiannikouris, Andre, Buleon, Jeminet, Canet, Francois, Bertin and Jouany2004b; Jouany, Reference Jouany2007).
Regarding metabolic variables, ruminants fed mycotoxin-contaminated diets normally have elevated serum metabolites, including urea, protein, AST and GGT (Chaiyotwittayakun, Reference Chaiyotwittayakun2010). In addition, enzyme tests are widely used as indicators of the effect of chemical or toxicological substances in the liver. Elevated serum enzyme activity of diagnostic liver enzymes (AST and GGT) can be a sign of intoxication, suggesting hepatocellular injury (Fink-Gremmels, Reference Fink-Gremmels2008). The fact that the levels of AST and GGT were unaltered among treatments in this study may indicate that there was no liver damage in these animals.
The non-alteration of enzymes linked to hepatic metabolism may be related to the low contamination of diets, even in the EC diet, and a relatively short exposure. Osweiler et al. (Reference Osweiler, Kehrli, Stabel, Thurston, Ross and Wilson1993) observed that doses above 150 ppm of fumonisin B1 caused hepatic alterations in cattle. The authors reported that the liver is only affected in the case of high contamination levels in cattle. In this study, the higher dose of this toxin was 5754 ppb or 5.754 ppm. In another study with beef cattle, Garrett et al. (Reference Garrett, Heitman and Booth1968) observed liver alteration with doses above 100 ppb aflatoxin B1, which was higher than the doses observed in this study (10 ppb).
Thus, mycotoxins are normally metabolized in the liver and kidneys, especially aflatoxins, which are powerful hepatotoxins and are reported to cause liver necrosis (Ashiq, Reference Ashiq2015). In this sense, it is interesting to verify the integrity of these organs through weight, color and histopathology.
In contrast to data found in the literature, the organ weight in this study did not show interactions between diet contamination and ADS usage. As mentioned before, this can probably be explained by the low level of contamination implemented in this study. On the other hand, Ledoux et al. (Reference Ledoux, Rottinghaus, Bermudez and Alonso-Debolt1998), studying chicks fed aflatoxin B1, observed heavier liver, heart, kidney, proventriculus and pancreas weights, whereas chicks fed the combination aflatoxin B1 + ADS diet had similar organ weights to those fed negative control diets. Similarly, Fernandez et al. (Reference Fernandez, Belio, Ramos, Sanz and Saez1997) observed lambs fed 2.5 ppm aflatoxins for 21 days and saw that they presented hepatic and nephritic injuries and increased weight and size of liver and kidney.
According to Ledoux et al. (Reference Ledoux, Rottinghaus, Bermudez and Alonso-Debolt1998), aflatoxins cause a variety of effects in poultry organs, such as liver pathology with pale characteristics. In a study conducted by Kumar and Balachandran (Reference Kumar and Balachandran2009), the livers from broilers fed 1 ppm aflatoxin for 28 days showed enlargement, pallor or yellowish discoloration, and their kidneys were enlarged and pale. In our study, the b* color value of the kidneys was affected by both the contaminated diet and ADS factors, but we have no explanation for this. The L* value was also affected by the ADS. This result indicates that the kidneys of animals fed the ADS were pale compared to those of animals fed without the ADS. These differences may be due to the role of the kidneys in the metabolism. Kidneys are responsible for filtering the blood. However, we highlight that further studies are needed.
Regarding organ histopathology, some authors have documented that contaminated diets can cause liver lesions and multiorgan damage, including necrosis and hemorrhage in pigs (Chen et al., Reference Chen, Ma, Xue, Ma, Xie, Wang, Bi and Cao2008). Kumar and Balachandran (Reference Kumar and Balachandran2009) observed histopathological degenerative and necrotic changes in the liver and kidneys of broilers fed 1 ppm aflatoxin. In this study, the less-severely contaminated diets and ADS did not affect these variables. We highlight that monogastric animals are more susceptible to mycotoxins than ruminants.
In conclusion, under the conditions of this experiment, mycotoxins affect beef cattle performance, and the inclusion of an ADS in the dietallows for the partial recovery of performance when animals are fed exogenously contaminated diets.
Acknowledgements
The authors would like to thank Luiz Fernando Costa e Silva, Anne Koontz and Rebecca Delles for their assistance and all contributions. This study was made possible by grants from the São Paulo Research Foundation (FAPESP) no. 2015/21416-6 (first author), no. 2018/20176-0 (second author) and no. 2017/50339-5 (PDIP). The work was conducted as part of the first author’s dissertation (Leticia Custodio).
L. F. Prados 0000-0001-5142-6819
Declaration of interest
The authors declare no conflicts of interest.
Ethics statement
The experiment was conducted at the Agência Paulista de Tecnologia dos Agronegócios (APTA) in Colina, SP, Brazil, following the guidelines for animal well-being provided by the São Paulo state in Brazil. All procedures and protocols involving the use of animals were approved by the ethics committee on animal use of the Universidade Estadual Paulista (protocol number 15473/15).
Software and data repository resources
None of the data were deposited in an official repository.


