


This corrigendum corrects errors in the published version of my article “Does the Meeting Style Matter? The Effects of Exposure to Participatory and Deliberative School Board Meetings” (Collins Reference Collins2021). After reviewing my code, I have identified 5 errors. These errors involve using slightly incorrect samples, miscoding one value of an independent variable for the global analyses, and using incorrect subsamples for some categorical analyses. One error affected the size of the results of one of the subanalyses. Below, I summarize each error and its consequences.
First, for the research design, all incomplete cases and cases where respondents completed the sample in less than 1 minute should have been eliminated. The version of the results from the originally published manuscript reports results that eliminate the vast majority of these incomplete and too rapid cases. However, there was an additional line of code missing that would have reduced the sample by 19 more cases. Second, the research design also intended to eliminate cases without posttreatment open-ended responses and those who did not answer a final posttreatment question about attending future meetings, but 40 of them remained in the sample that was used for the estimations. Third, individuals with household incomes between $50K and $75K were accidentally coded as a part of the low-income group ($50K or less).
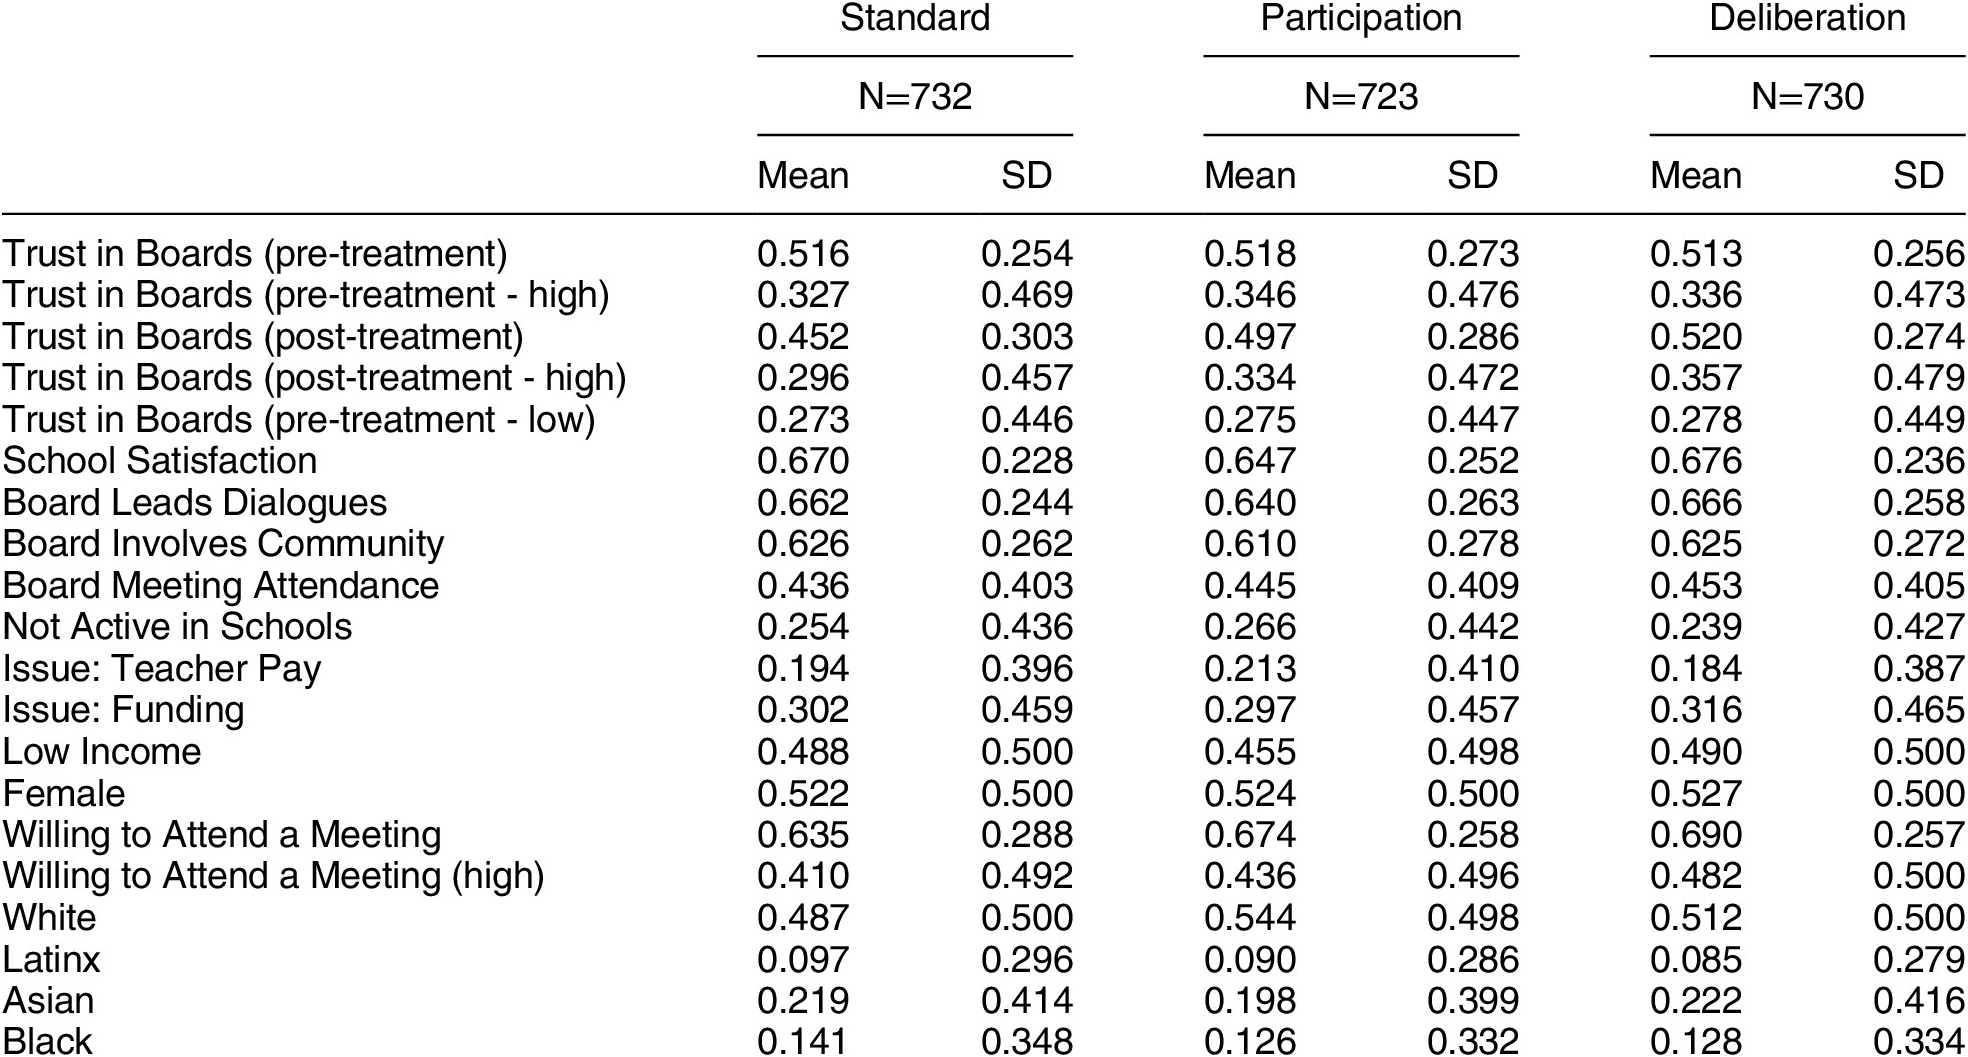
In most cases, these errors did not change the interpretation of the respective treatments relative to the control group experiencing standard meetings. However, they do alter the specific estimates in the analysis. The miscoded income error, for instance, changed the size of the low-income group by less than 1 percentage point (see updated descriptive statistics in the Supplementary Materials). As a result, I updated estimates for the figures that were impacted by this error, including the standard error bars.
I also include ANOVA tests of differences in means between the deliberation treatment, the participation treatment, and the standard meeting, which tests whether there are significant differences across the three conditions. These results make it explicitly clear that there are statistically significant differences at the 0.05 level in analyses of key groups for trust in school boards in the overall sample (Figure 4) and among those with low levels of pretreatment trust (Figure 5). In addition, there are statistically significant differences in the willingness to attend a meeting across the three different conditions for the full sample (Figure 7), among people of color in general (Figure 9), and particularly among Asian Americans (Figure 10). While these results are similar to those reported in the published manuscript, the willingness to attend future meetings is not statistically significantly different across the three conditions for those who have never attended a prior meeting (Figure 7) or white, Black, or Latinx Americans (Figure 10).
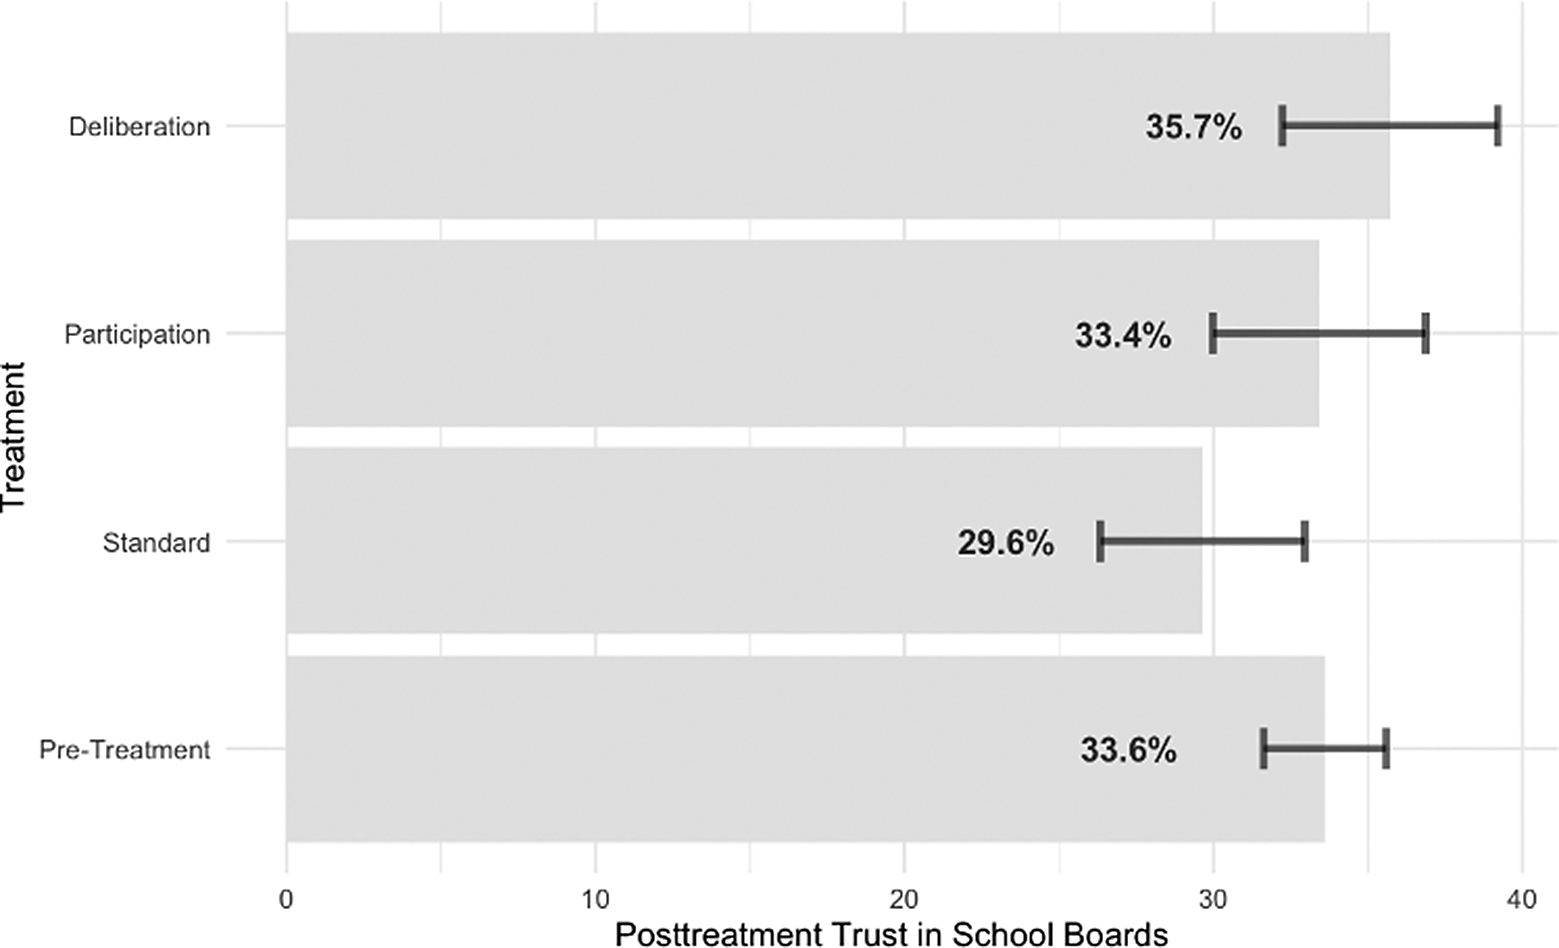
Figure 4. (Amended): Posttreatment Trust in Local Officials, by Group Assignment
Note: Difference of means for posttreatment trust in school boards: F test = 3.111 (p = 0.045).
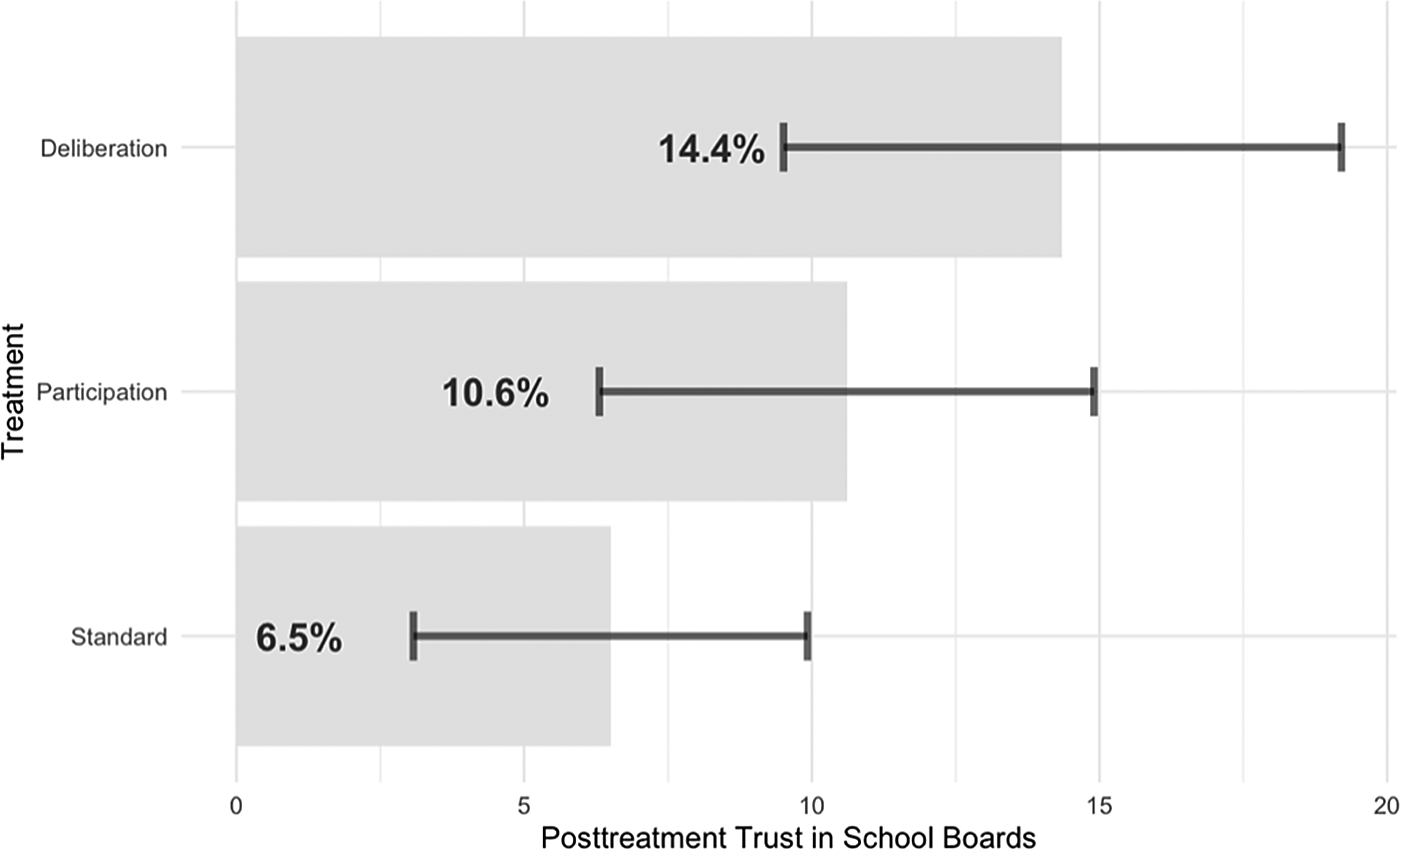
Figure 5. (Amended): Posttreatment Trust in Local Officials among Respondents with Low Levels of Pretreatment Trust, by Group Assignment
Note: Difference of means for posttreatment trust F test = 3.322 (p = 0.037).
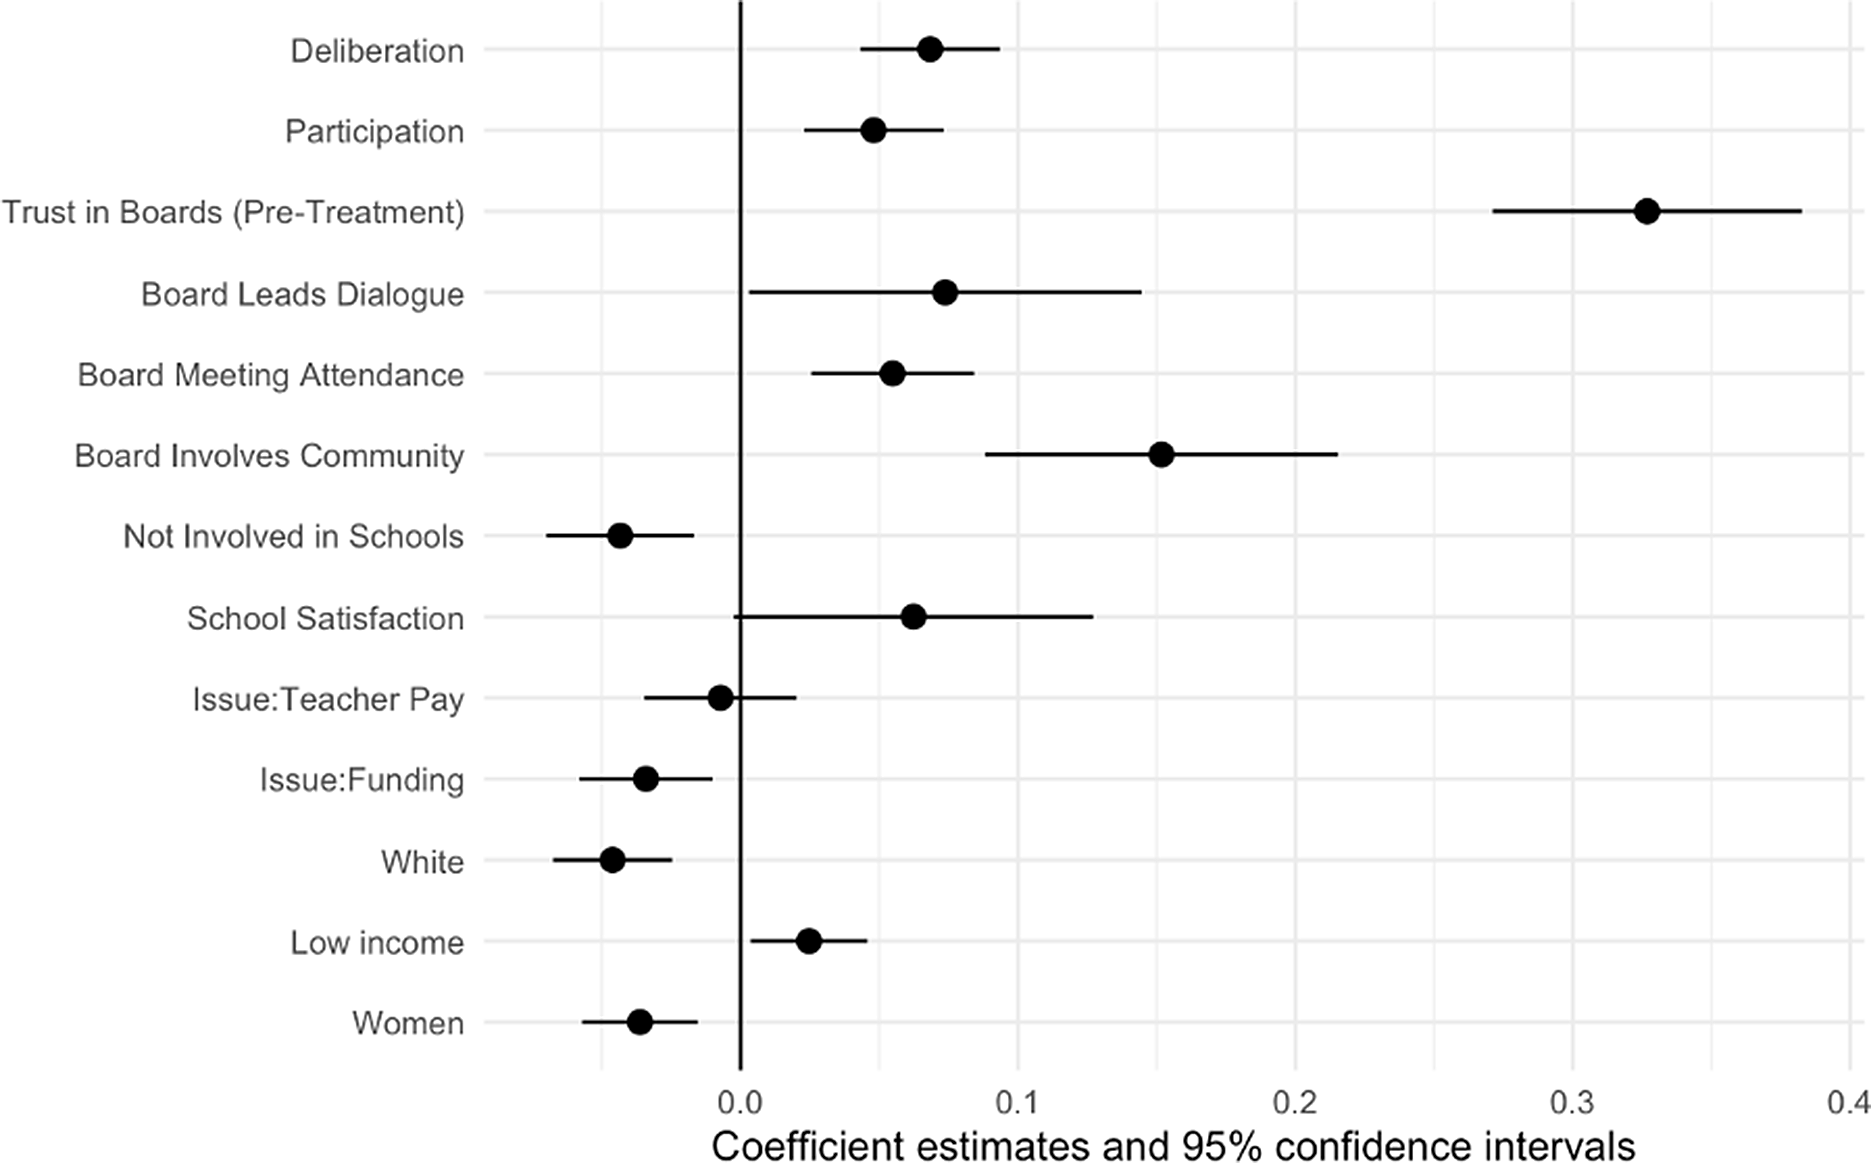
Figure 6. (Amended): Modeling Posttreatment Trust in Local Officials
Note: N = 1,980
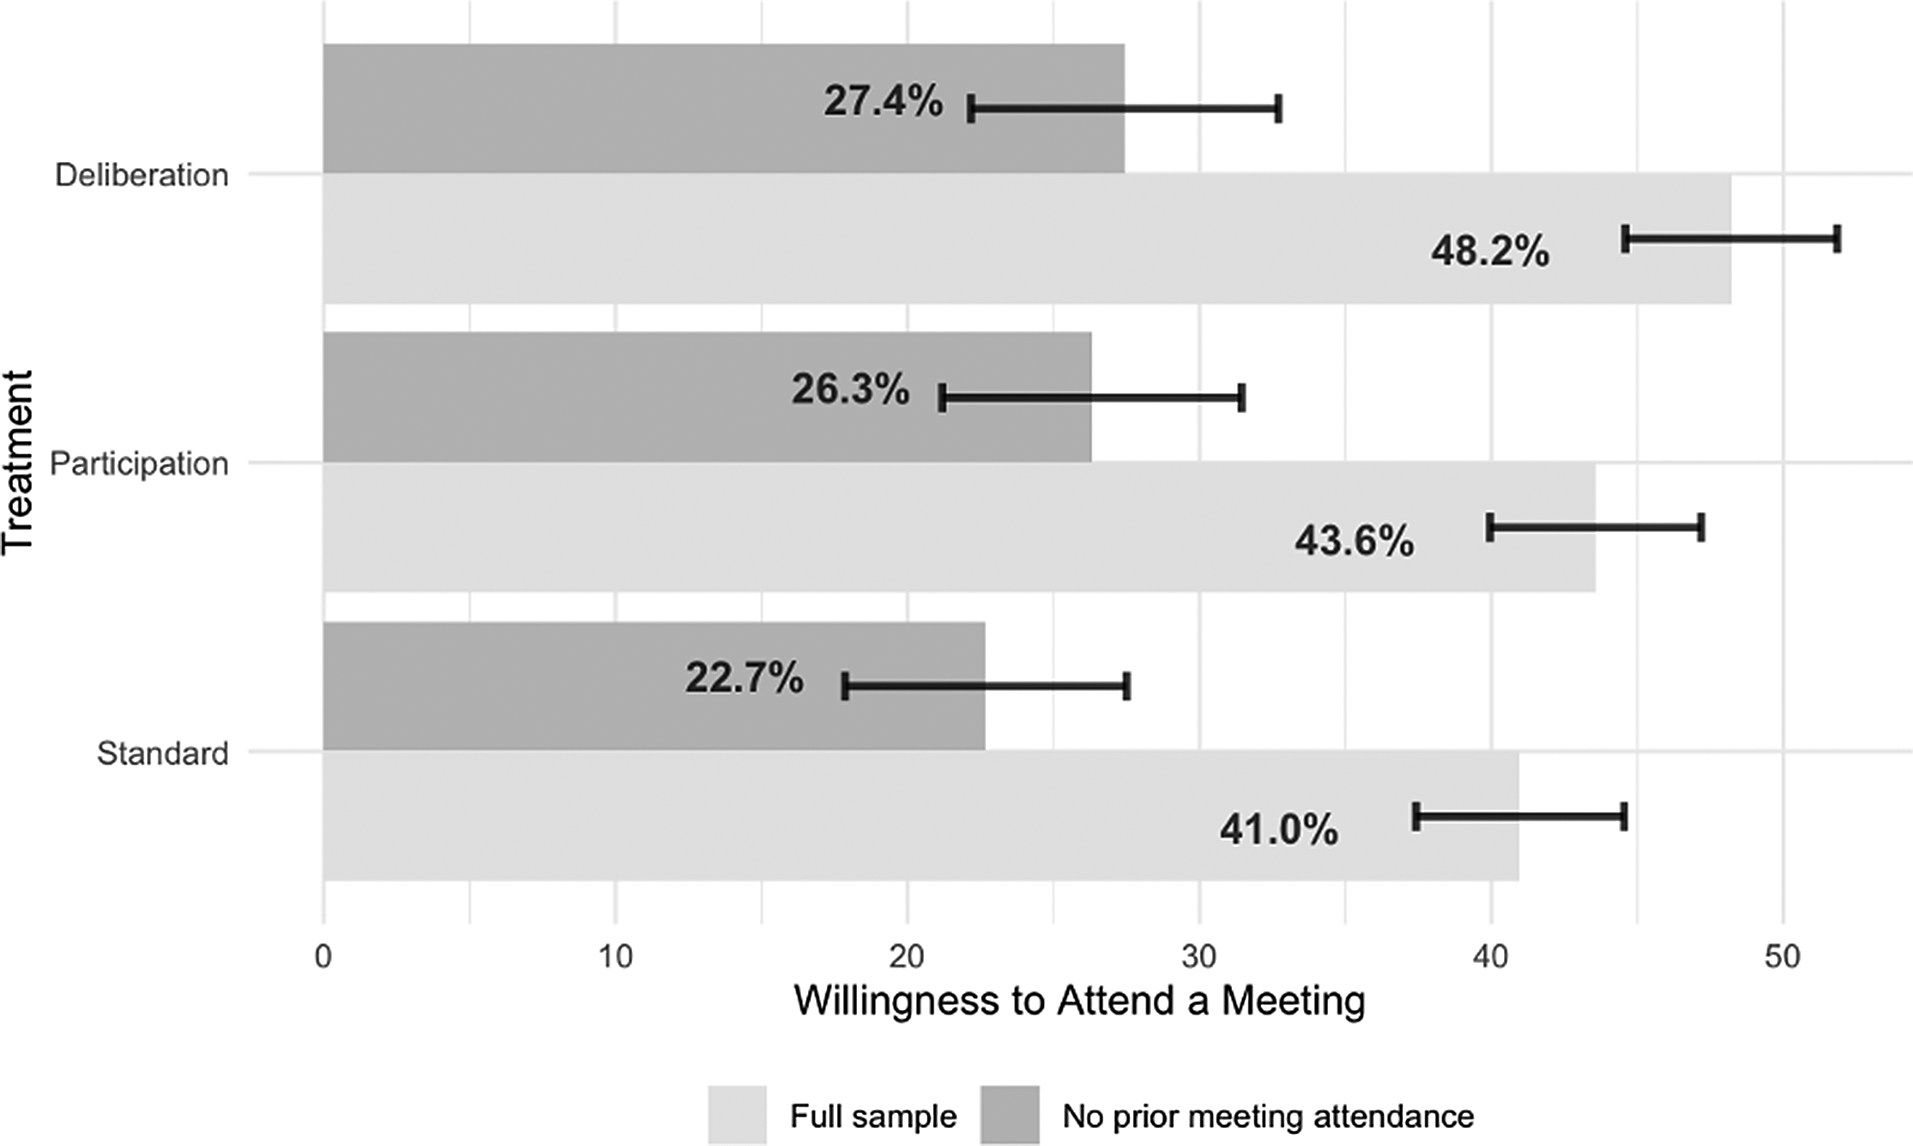
Figure 7. (Amended): Posttreatment Differences in Willingness to Attend a Meeting in the Future by Group Assignment
Note: Difference of means for posttreatment willingness to attend a meeting for full sample F test = 3.991 (p = 0.019) and for no prior meeting attendance F test = 0.932 (p = 0.394)
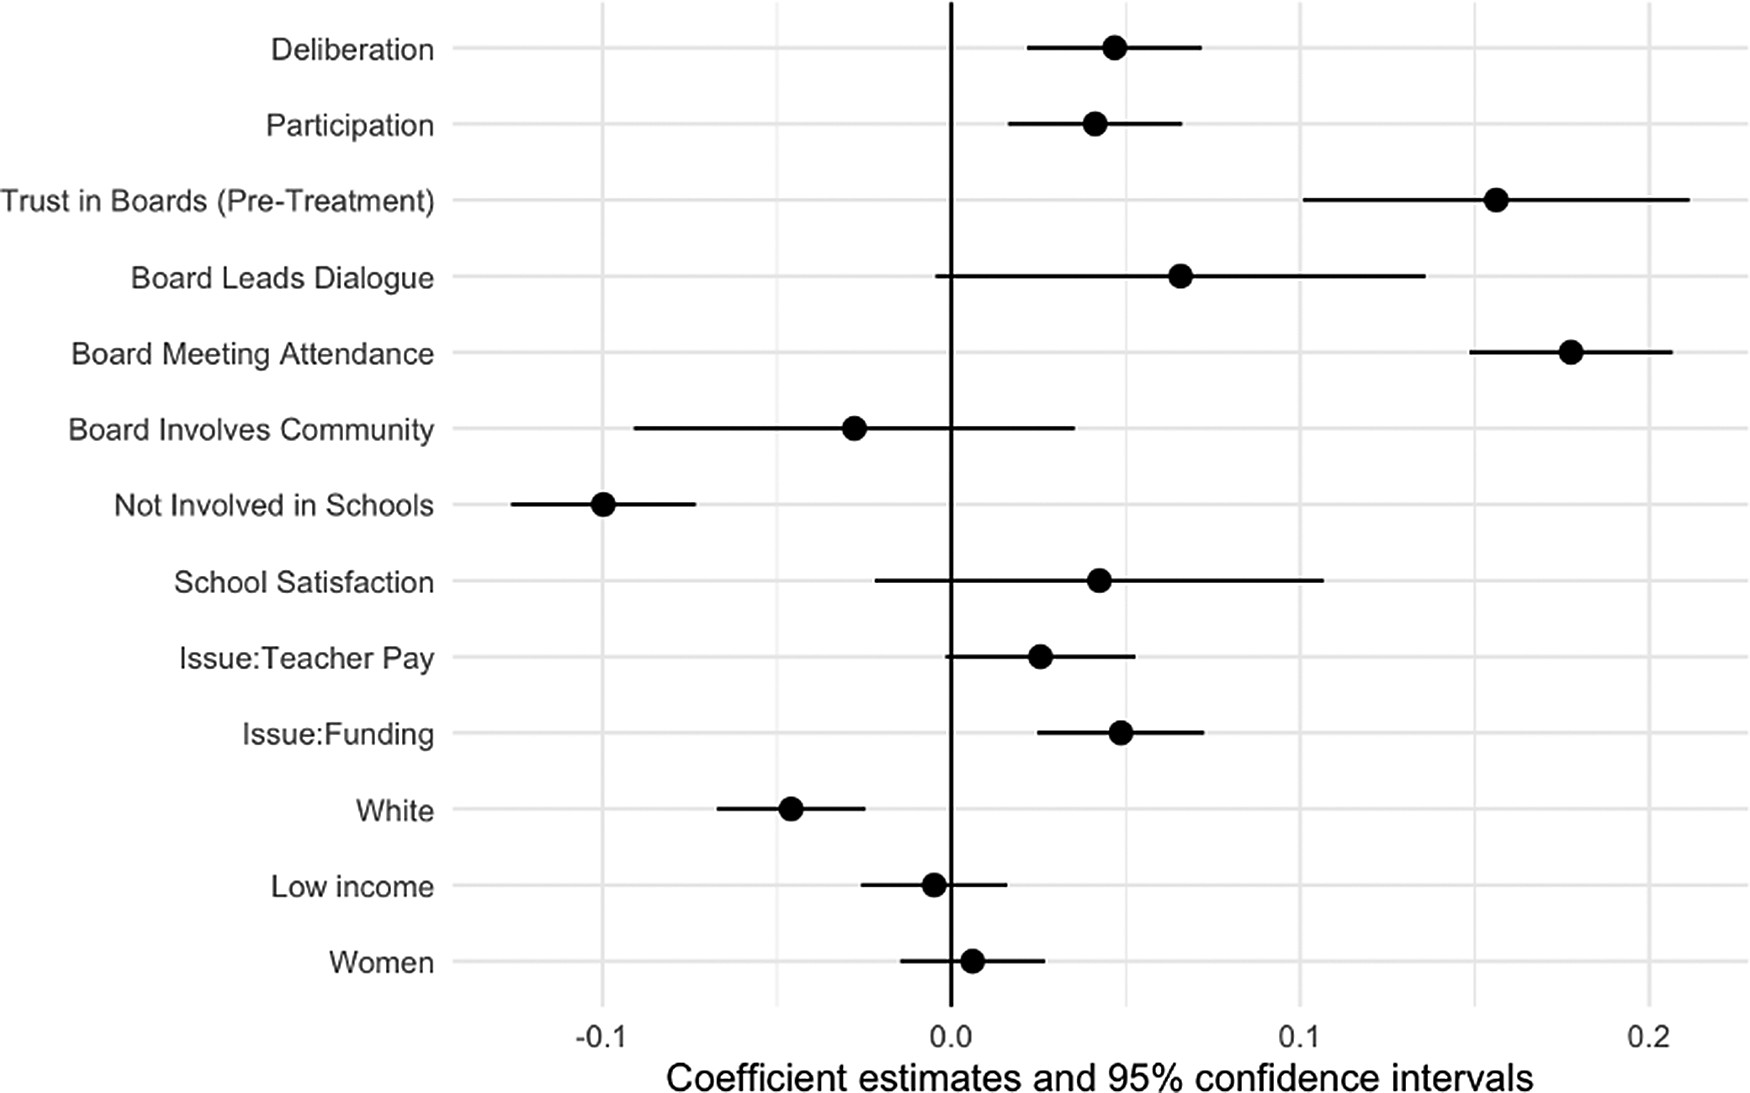
Figure 8. (Amended): Modeling Posttreatment Willingness to Attend a Meeting
Note: N = 1,983
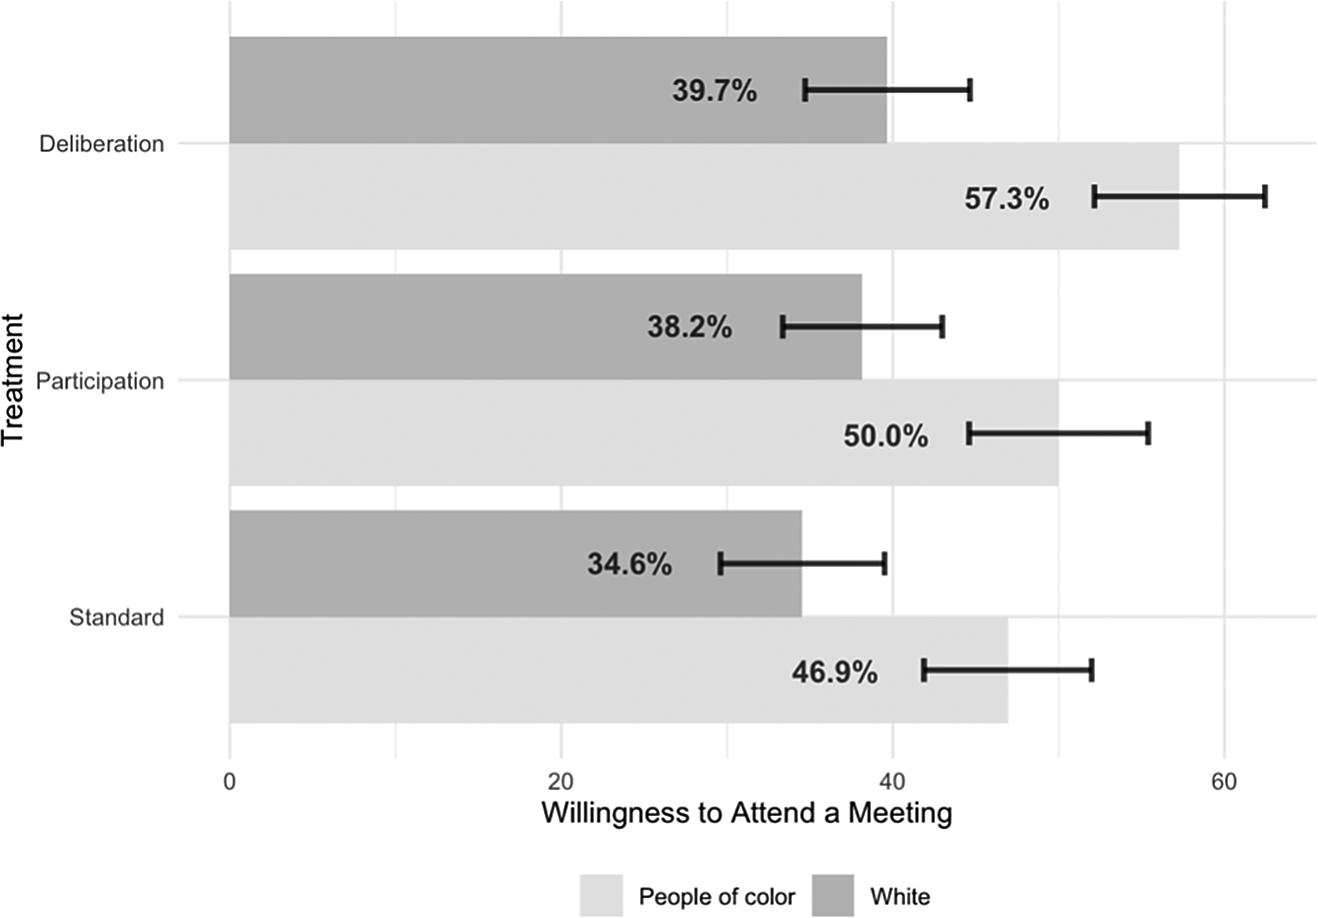
Figure 9. (Amended): Posttreatment Willingness to Attend a Meeting in the Future, by Group Assignment and Identification as White or a Person of Color
Note: Difference of means for posttreatment willingness to attend a meeting for Persons of color: F test = 4.130 (p = 0.016) and for White people: F test = 1.074 (p = 0.342).
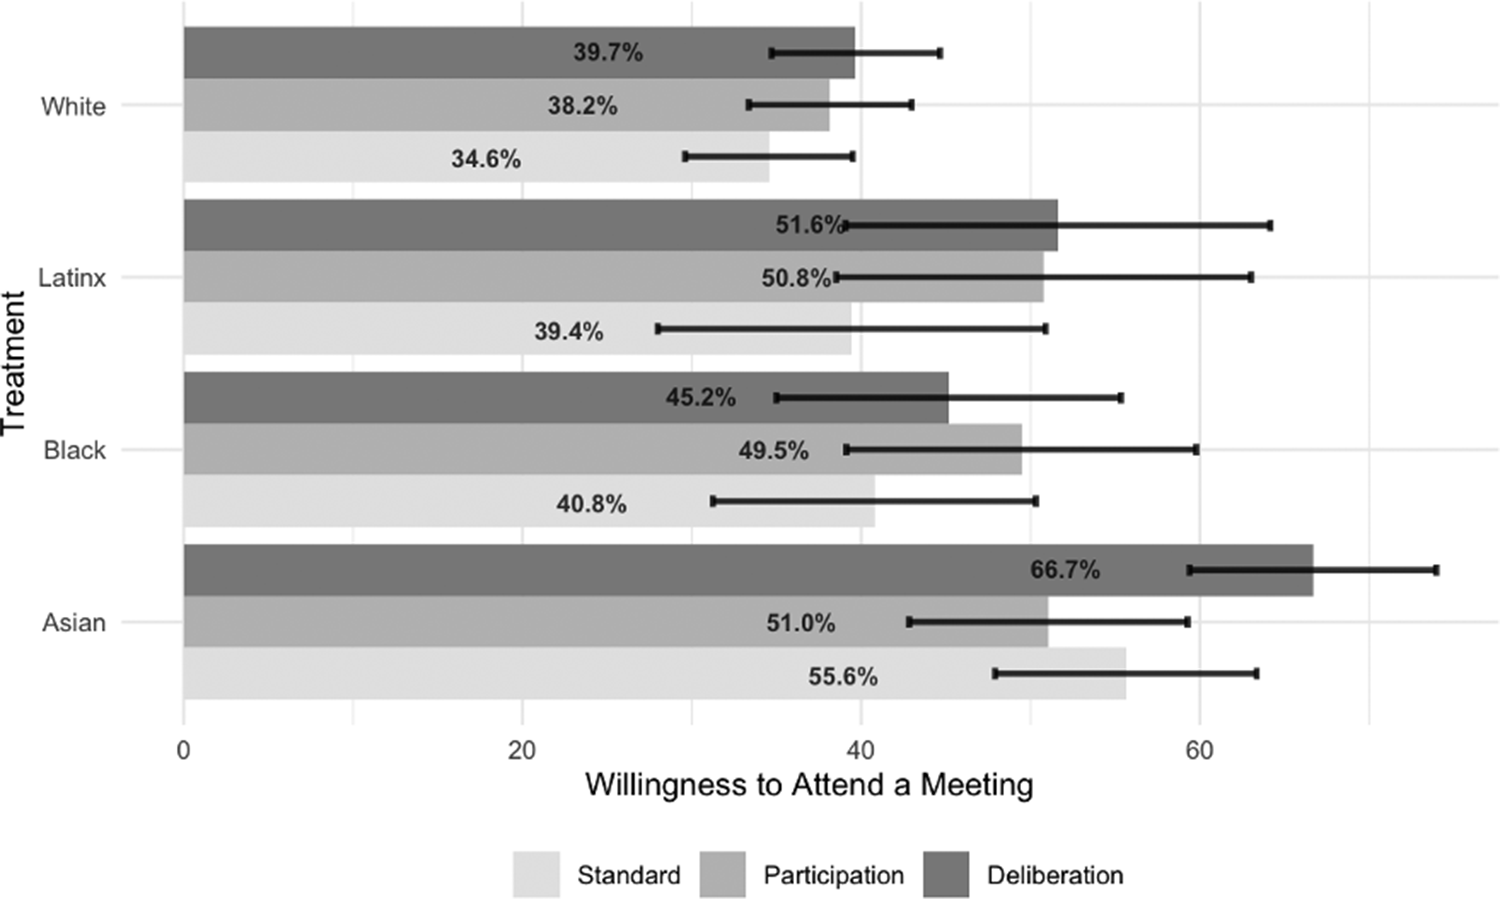
Figure 10. (Amended): Posttreatment Willingness to Attend a Meeting in the Future, by Group Assignment and Race/Ethnicity
Note: Difference of means for posttreatment willingness to attend a meeting for White Americans: F test = 1.074 (p = 0.342), for Black Americans: F test = 0.731 (p = 0.482), for Latinx Americans: F test = 1.262 (p = 0.285), for Asian Americans: F test = 4.149 (p = 0.016).
The estimates for Figures 4, 9, and 10 differ slightly from the original manuscript due to the change in the sample.
The change in sample also leads to slight changes in regression model estimates. Therefore, I am providing updated estimations for Figure 6 and Figure 8. As the figures show, the deliberation and participation treatments, respectively, remain statistically different from the standard meeting control.
Two additional errors do have implications for the estimates in the paper. The two subanalyses in the paper (individuals with low-trust pretreatment and individuals with no prior meeting attendance) inadvertently included participants who did not fit into the examined subcategories. When including only those individuals with low levels of trust, the results are what are now displayed on the amended Figure 5. The size of the effects of the meetings changes slightly, with deliberation meetings still producing a statistically and substantively significant improvement in trust over standard meetings. However, there is no longer a statistically significant difference between the participation and deliberation treatments.
To correct Figure 7, I used only individuals with no prior meeting attendance for the subsample. When doing so, the size the of the effects on those who had not previously attended a meeting are smaller than originally reported. The effect of the deliberation treatment on that group is about half the size of the estimate from the original paper, and it is no longer statistically distinct from the participation treatment. Nonetheless, the deliberation treatment still has a stronger effect than the standard treatment, but the difference no longer reaches statistical significance, which is largely due to the change in sample size. Both the full sample results (which are the same as the original paper) and the consistently stronger effect of the deliberation treatment (though not as strong for those with no prior meeting attendance as depicted in the original paper) support the main argument of the paper.
These corrections also add conceptual clarity. As in the original paper, the respondents who received either the deliberation or participation treatments are in many instances, including in the regression results, statistically more likely to trust school boards and express a willingness to attend a meeting in the future. However, it is now even clearer that, statistically, the deliberation treatment is not definitely more effective than the participation treatment. In terms of raw averages, the former consistently outpaces the latter, but the difference is not large enough to be distinguishable from random noise. This lack of statistical difference likely means that the kind of public trust and empowerment that can be generated through active public comment rests more on whether members of the public speak than whether the board responds. Under this larger idea that “meeting style matters,” public engagement within the varying styles seems to be what changes perspectives on local meetings. Essentially, engagement begets engagement.
All data and materials to verify the reproducibility of the original and amended versions of the code have been posted to the American Political Science Review Dataverse: https://doi.org/10.7910/DVN/K04IOD.
SUPPLEMENTARY Materials: Summary Statistics (Amended)


Comments
No Comments have been published for this article.