

A long line of work on advanced capitalist democracies argues that the need for governments to assemble majority electoral coalitions accords the middle class a strong say over government policies and virtually ensures that it will share in the prosperity that modern capitalism enables (e.g., Baldwin Reference Baldwin1990; Esping-Andersen Reference Esping-Andersen1990; Iversen and Soskice Reference Iversen and Soskice2006; Korpi and Palme Reference Korpi and Palme1998; Meltzer and Richard Reference Meltzer and Richard1981; Rothstein Reference Rothstein1998). Such sharing takes many forms, but the two main vehicles are investments in skills and the welfare state (Huber and Stephens Reference Huber and Stephens2001; Iversen and Stephens Reference Iversen and Stephens2008). Recent work, however, including several contributions to this volume, call the conventional wisdom into doubt. One line of research argues that policies are strongly biased toward the preferences of the rich, as revealed in public opinion surveys (e.g., Bartels Reference Bartels2008, Reference Bartels2017; Gilens Reference Gilens2005, Reference Gilens2012; Gilens and Page Reference Gilens and Page2014); another argues that the structural power of increasingly footloose capital undermines the capacity of the state to tax and redistribute rendering democratic governments increasingly incapable of responding to majority preferences (e.g., Piketty Reference Piketty2014; Rodrik Reference Rodrik1997, Reference Rodrik2011; Streeck Reference Streeck2011, Reference Streeck2016). This chapter is a critical reassessment of these and related arguments using macro evidence on government taxation and spending. Without probing preferences directly, we ask which classes gain and lose from government policies, and whether such “revealed power” has changed over time. We base our estimates on LIS data amended by data on in-kind government spending and we complement this evidence with data from the new World Inequality Database (WID). In a separate paper, we have examined evidence on preferences based on ISSP data (Elkjær and Iversen Reference Elkjær and Iversen2020).
Broadly consistent with the older literature, we find that government policies and outcomes in most cases are responsive to the economic interests of the middle class, and we show that middle-class power over fiscal policies has remained remarkably stable over time, even though market inequality has risen sharply and despite a large recent literature on the “hollowing-out of the middle.” The rich are as large net contributors to the welfare state today as they were in the past, and it does not appear that the democratic state is increasingly constrained by global capital. In most cases, the middle class, measured by posttax income, has kept up with the advancement of the economy as a whole. The partial exception is the United States where middle-income growth has lagged average growth, although in absolute terms posttax incomes rose at a comparable rate to Europe.
Perhaps surprisingly, these conclusions appear to also apply to the bottom end of the income distribution. Growth in the posttax incomes of the bottom income quintile largely follows average incomes, although here the United States is an even greater outlier with bottom-end inequality rising sharply. We find that the bottom benefits from center-left governments, but the capacity of the bottom to keep up with the middle seems to be mainly driven by demand for insurance and public goods in the middle class.Footnote 1 In this sense, the poor are highly vulnerable, even under democracy, since they depend on the middle class defining its interests as being bound up with those of the poor. There are reasons to think this may be less true today than in the past.
Our comparison of the LIS data, which is based on equivalized household income, and the WID data, which is based on individualized income, reveals the important role of the family in shaping distributive outcomes. There is much redistribution going on within the household because members share consumption (notably living space, food, and consumer durables), but lower marriage rates and rising divorce rates have created many more single-adult households, which affect both distributive outcomes and distributive politics. Interestingly, this trend has produced very different outcomes in Europe and the United States, and it seems to be bound up in part with the role of race in US politics.
As Lupu and Pontusson note in their introduction, our overall findings appear at odds with theirs. We agree that one reason is that our data are for a longer period and for a larger sample of countries. It also matters that we include in-kind transfers in our analysis, while they do not. Lupu and Pontusson note that the distribution of these transfers depends on assumptions that cannot be fully validated with current data. Yet excluding in-kind transfers implicitly assumes that they are proportional to after-tax income, which is almost certainly not the case, so that is not a solution. Still, if we do exclude in-kind transfers, it does not much affect the trends we document over time (our focus) since the magnitude and composition of in-kind transfers do not change much. We should also note that our results are substantively identical whether we exclude students and retirees from the analysis or exclude people without factor income. Finally, while we agree that transfer rates are not the only test of models of redistributive politics, a remarkable implication of our results is that the evolution of transfer rates – which we use as a signal of political power – produces largely constant relative post-fisc incomes over time for the middle and bottom. This is not an accounting relationship, as Lupu and Pontusson’s hypothetical example in the introduction illustrates, and it is consistent with rising inequality in the top half.
The rest of the chapter is organized into three sections. The first is a critical assessment of the state of the literature, comparing recent arguments about the subversion of democracy to more long-standing theories of the pivotal role of the middle class. We offer definitions of class interests over government tax-and-spend policies, and we hypothesize different patterns of spending priorities depending on class power. We then turn to the empirics, showing evidence from eighteen advanced democracies going back to the 1970s, with a focus on how different classes have fared over time according to both LIS and WID data. The last section concludes.
Theoretical Perspectives
The Subversion of Democracy Debate
In recent decades, a deep pessimism about advanced democracy and its capacity to serve the needs of ordinary people has taken hold. It is not hard to find reasons to be concerned: rightwing populism, rising inequality, declining growth, and a concentration of wealth that leaves the impression that the system increasingly works only for the rich and powerful. There is worrying evidence to back up such pessimism. Work by Bartels (Reference Bartels2008), Gilens (Reference Gilens2005, Reference Gilens2012), and Gilens and Page (Reference Gilens and Page2014) on the US, as well as recent work testing and extending their approach to other advanced democracies (e.g., Bartels Reference Bartels2017; Elsässer, Hense, and Schäfer Reference Elsässer, Hense and Schäfer2018; Peters and Ensink Reference Peters and Ensink2015; contributions to this volume) find that the affluent dominate democratic politics to the point where other income classes do not matter. This is of obvious normative concern, and it also challenges standard models of democracy, which accord a strong role to the middle class.
Yet, the interpretation of the public opinion evidence is contested (see e.g., Elkjær and Klitgaard Reference Elkjær and Klitgaard2021). Subgroup preferences are highly correlated over time (Page and Shapiro Reference Page and Shapiro1992; Soroka and Wlezien Reference Soroka and Wlezien2008), and the middle class emerges as far more politically influential when preferred levels of spending are used instead of preferred changes in spending (Elkjær and Iversen Reference Elkjær and Iversen2020). Nor do public opinion data capture the role of political parties. Voters may be generally uninformed about politics, which shows up as noisy survey responses and ill-considered policy positions, but they may know enough to vote for parties that are broadly representative of their interests, using either ideological cues (as originally argued by Downs Reference Downs1957) or retrospective economic evaluations (Fiorina Reference Fiorina1981; Kitschelt Reference Kitschelt2000; Munger and Hinich Reference Munger and Hinich1994). Political parties may thus act as “trustees” for their constituencies and advance their long-term interests in government; what Mansbridge (Reference Mansbridge2003) calls “promissory representation.” Most plausibly, effective representation requires parties to pay attention to both interests and preferences, as argued long ago by Pitkin (Reference Pitkin1967). For this reason, evidence on expressed preferences as well as interests is salient for assessing power and influence.
In his contribution to this volume, Bartels criticizes some of this and our other earlier work, arguing that we assign undue importance to bivariate associations of policies and preferences. In reality, though, we follow a line of scholarship dating back to at least Nagel (Reference Nagel1975), who distinguished between the ‘influence’ an actor exerts on an outcome and the “benefit” they receive from their own and others’ influence. The latter, Nagel (Reference Nagel1975: 156–7) argued, can be measured as the correlation between preferences and the outcome. In practical terms and considering the strong model dependency of published results (Elkjær and Klitgaard Reference Elkjær and Klitgaard2021), we also think it’s ill-advised to ignore the bivariate associations. In the face of even minor model misspecifications, the high levels of multicollinearity that are inherent in multivariate models of preferences and political outcomes might thus greatly exacerbate statistical bias (see Winship and Western Reference Winship and Western2016). Finally, and perhaps most importantly, Bartels’ critique has no bearing on our substantive conclusions: when we use Bartels’ preferred specification, the middle class still stands out as a pivotal player in redistributive politics (some of these results are presented in appendices to the original papers).
Even if governments respond to middle-class electorates, however, these responses may be increasingly constrained and inadequate. New work in comparative political economy highlights macro trends that appear to show that governments do not respond to rising inequality – a puzzle that is known as the Robin Hood paradox (following Lindert Reference Lindert2004). In addition, there is evidence that partisanship matters less for government policies than in the past (Huber and Stephens Reference Huber and Stephens2001; Kwon and Pontusson Reference Kwon and Pontusson2010). Such “convergence” could reflect that governments are increasingly hamstrung by footloose capital, as argued by Streeck (Reference Streeck2011, Reference Streeck2016), Piketty (Reference Piketty2014), and Rodrik (Reference Rodrik1997, Reference Rodrik2011). Closely related, businesses and high-income earners may have the ability to shift their consumption, income, and effort to offset higher taxes, which places a binding constraint on how much governments can tax. Rising top-end incomes would incentivize the rich to engage in additional tax shifting. Another possibility is that big business and the rich exert political influence behind the scenes, outside the light of public discourse and open electoral contests (Hacker and Pierson Reference Hacker and Pierson2010; Hertel-Fernandez Reference Hertel-Fernandez2018, Reference Hertel-Fernandez2019; Rahman and Thelen Reference Rahman and Thelen2019).
On the other side of the debate are arguments about the geospatial embeddedness of advanced capitalism. As argued by economic geographers (e.g., Glaeser Reference Glaeser2011; Storper Reference Storper1997, Reference Storper2013) and business scholars (e.g., Iammarino and McCann Reference Iammarino and McCann2013; Rugman Reference Rugman2012), advanced production is rooted in local skill clusters, which tend to be concentrated in the successful cities, and these clusters are complemented by dense colocated social networks, which are very hard to uproot and move elsewhere (Iversen and Soskice Reference Iversen and Soskice2019). In this perspective, trade and foreign investment tend to reinforce local specialization and raise the dependence of multinational capital on location cospecific assets, most importantly highly skilled labor, and the mostly tacit knowledge they represent. This makes sustained tax evasion through mobility or income shifting hard. Intense market competition, especially in globalized markets, also makes it hard for business to coordinate politically. From this perspective, globalization does not undermine the capacity of governments to respond to democratic demands and may in fact augment it.
Class Interests
In this chapter, we abstract from public opinion data and instead use an axiomatic approach where class interests are derived deductively and then compared to actual tax-and-spend policies over time.Footnote 2 This offers partial evidence on class power. As noted earlier, a fuller picture would also require attention to preferences. We have done so in a separate paper (Elkjær and Iversen Reference Elkjær and Iversen2020). The assumptions and mathematical derivations for our predictions are relegated to Appendix 3.A; here we focus on the key intuitions. The baseline model predicts patterns of taxation and spending, but our empirical approach does not presuppose any particular channel of influence, or whether voters are informed or not, or whether governments have high capacity or not. Deviations from the baseline predictions will instead alert us to potential violations of assumptions, which invite alternative interpretations.
As in much work before ours, we divide the adult population into three income classes: low (L), middle (M), and high (H). We assume that each class is only concerned with maximizing its own material welfare. Altruism, racial animosity, and moral reasoning are all ignored for the purpose of parsimony and clear predictions, but we will consider some of these alternative motivations in the discussion of the evidence.
Fiscal policies are characterized along three dimensions, which reflect the main material concerns of each class: (i) maximize net income; (ii) optimize social insurance, and (iii) optimize the provision of public goods. In the case of M, net income is maximized by taxing H and transferring the proceeds to M, subject to a standard cost of taxation, which is rising exponentially in the tax rate because of multiplying work and investment disincentives, rising administrative costs of enforcing tax rules, etc. Optimal taxation of H will stop well short of confiscatory taxation for these reasons.Footnote 3 This approach follows a long “optimal taxation” tradition going back to Mirrlees (Reference Mirrlees1971) and also employed by Meltzer and Richard (Reference Meltzer and Richard1981).
A somewhat different approach focuses not on what is the optimal tax rate, but instead on what is feasible. Known as the New Tax Responsiveness literature (Feldstein Reference Feldstein1995, Reference Feldstein1999; Gruber and Saez Reference Gruber and Saez2002; Saez, Slemrod, and Giertz Reference Saez, Slemrod and Giertz2012), the focus is on the capacity of businesses and high-income earners to shift their consumption, income, and effort to offset higher taxes, which places a binding constraint on how much governments can tax. Higher taxes essentially induce a substitution effect into lower-taxed income streams. An unambiguous implication of the New Tax Responsiveness literature is that rising top-end incomes incentivize the rich to engage in more tax shifting, and it therefore ties into the broader argument about inequality and class power used in this volume. In this formulation, for M to retain its political influence and keep up taxation of H during periods of rising top-end inequality, it must counter not only the “instrumental power” of the rich to shape the tax structure but also their “structural power” to evade taxation within any given tax structure. With rising top-end inequality governments must continuously find new ways to plug tax loopholes and dissuade tax evasion. In this version, the difference between a constant and a falling H transfer rate is the difference between a politically resilient nonrich majority and an ascending rich minority.
In a changing world, governments need to continuously update their tax regimes to address demands from the middle class. This is also true on the spending side. Demand has shifted away from traditional social consumption toward social investment (Garritzmann, Hausermann, and Palier Reference Garritzmann, Häusermann and Palier2022). It is precisely because the content of policies is changing all the time that a theory of class power cannot rely entirely on arguments about path dependence (Pierson Reference Pierson1996; 2000). The focus of our analysis is the capacity of the lower and (especially) the middle classes to continuously reinvent tax and spend policies to satisfy their material interests. Our argument is not about the stasis of policy, but about the resilience of class power.
We start by defining what we will refer to as transfer rates for each class:

where,  refers to each of the three classes, i = {L, M, H}. We measure transfer rates relative to net (after-tax and transfer) income because it is readily observable whereas we cannot observe market income in the counter-factual case of zero taxation. A positive number means that a group is a net beneficiary; a negative number that it is a net contributor.
In Appendix 3.A, we first show that if M is pivotal, optimal taxation implies a constant transfer rate from H:

where the superscript indicates that this is M’s preferred rate for H. If M chooses the optimal rate, there is no relationship between top-end inequality and redistribution.Footnote 4 The reason is that higher income of H always compensates M optimally through higher transfers, without changing the rate at which H is taxed. Note, however, that H will pay more into the public purse and M will consequently see transfers rise as a share of its own income, as H’s relative income rises:

This prediction stands in contrast to arguments that the rich enjoy increasing influence over policies as they become richer. If that was true, H’s and M’s transfer rates should fall as high-end inequality rises.
In the New Tax Responsiveness approach, the H-transfer rate is a direct measure of the power to tax high incomes, but unlike the optimal taxation approach, it does not make any predictions about how the transfer rate changes in response to top-end inequality. This will depend on the capacity of the rich to find ways to shift income to lower-taxed assets versus the capacity, administrative and political, of the state to close such opportunities. In this formulation, a constant H transfer rate is an expression of constant middle-class power, but the prediction of a constant transfer rate follows only from complementary arguments about democracy and the power to tax, which we reviewed earlier.
Social insurance follows a distinct logic. M may well want to spend money on social insurance, which we can think of as guarantees against the risk of losing income and falling into the L group. This could be because of unemployment, illness, or just bad luck (such as being in an industry or profession facing falling demand and wages). Those with high incomes tend to be less exposed to such risks (Moene and Wallerstein Reference Moene and Wallerstein2001; Rehm Reference Rehm2011), and they also tend to have better access to private insurance (Busemeyer and Iversen Reference Busemeyer and Iversen2020). For M, on the other hand, insurance against labor market and other social risks is usually seen as a critically important motive for supporting public spending, and it has been documented to matter greatly in historical accounts (Baldwin’s Reference Baldwin1990; Esping-Andersen Reference Esping-Andersen1990; Mares Reference Mares2003); it is implied by economic models (Barr Reference Barr2001, Reference Barr2012; Boadway and Keen Reference Boadway, Keen, Atkinson and Bourguignon2000); and it has been shown to matter for government spending and demand for such spending (Iversen and Soskice Reference Iversen and Soskice2001; Moene and Wallerstein Reference Moene and Wallerstein2001; Rehm Reference Rehm2011). This may be particularly true in an intergenerational perspective, where health insurance and old-age care help alleviate worries about older parents and where concerns about downward mobility of children give cause to support policies that ensure a decent living even for those at the bottom.
Because the demand for social insurance is proportional to risk times the loss if that risk is realized, bottom-end inequality should increase the transfer rate for L (see Appendix 3.A, eq. A6):

In the Lupu-Pontusson (Reference Lupu and Pontusson2011) model, low-end inequality instead increases “social distance,” which undermines the solidarity or affinity M feels with L. Since this is not a strictly material incentive, it is outside our model and both motives could matter. In the end, it is therefore an empirical matter.
Preferences for public goods should follow a very similar pattern because L (and H) share in spending on in-kind goods, such as infrastructure, primary and secondary schooling, policing, postal services, and so on, which are typically guaranteed as a citizen right. No person will be required to show proof of income to be admitted to, say, the local school or public library. If utility for such goods is concave, the demand function will look very similar to that for insurance, and for some in-kind services like hospitals, the distinction between insurance and public goods is blurred (see Busemeyer and Iversen Reference Busemeyer and Iversen2020).
Our focus has been on the policy interests of M because of the centrality of the middle class in standard arguments about the welfare state. But we have implicitly assumed the interests of L and H, and they can be easily summarized: L would want to tax M and H at the maximum rate and transfer everything to L; H would want to cut taxes and transfers to zero, or perhaps a positive but low number that reflects its demand for public goods and social insurance that cannot be purchased in the private market (the private market is preferable for H because it involves no redistribution).
If M cannot govern alone, the outcome will reflect a coalition bargain, which can be conceived as a policy vector of taxes and transfers to and from each class based on the above set of interests. Because the interests of L and H are diametrically opposed, it stands to reason that LH coalitions are rare. For the two other feasible coalitions, an LM coalition is expected to benefit L more, and hurt H more, than an MH coalition. Depending on bargaining power within the coalition, which we approximate in the empirical analysis as the share of right cabinet seats minus the share of left cabinet seats, M can ordinarily ensure that it will emerge as a net beneficiary. Of course, this is also ultimately an empirical matter.
As is true for the pure M model, government partisanship only matters if the power of democratic governments is not subverted by money or by the structural power of capital. If H is powerful, despite not being a majority, it will be reflected in a lower (absolute) H transfer rate. We have already suggested that if “money talks” in politics, we should expect rising upper-end inequality to be associated with lower transfer rates to M and L. The same is true if rising incomes at the top lead to more tax shifting, which is not counter-balanced by government revisions of the tax code. The argument that mobile capital undermines redistribution is readily captured in the optimal taxation model as an increase in the efficiency costs of taxation (alpha in the formal representation in Appendix 3.A). If capital moves offshore in response to higher taxation, it reduces the optimal tax rate:
 .
.In the embedded capitalism interpretation, which implies that the state is strong, neither rising inequality nor increasing globalization of capital should affect the transfer rate to M.
Empirics
Estimating Equation
We can put our hypotheses to a test using a simple encompassing regression model, where the transfer rate to M (measured either relative to H’s or M’s income) is the dependent variable:

where the first two terms measure the direct effects of relative income on the transfer rate to M; Mobility refers to widely used measures of the internationalization of capital; and Government partisanship captures the relative influence of Right versus Left parties in government (measured by cabinet shares). The relative income of M to L is included to test for social insurance motives for spending at the bottom.
Data
For the main part of the analysis, we use a new dataset that relies on household income data from the Luxembourg Income Study (LIS), supplemented by OECD and Eurostat data on spending on services and transfers, taxation of property, capital, and consumption. LIS provides a cross-national database of harmonized household income surveys going back to the 1970s. We restrict our sample to eighteen advanced democraciesFootnote 5 for which data are recorded at more than one point in time between 1974 and 2016, and we confine the sample to households that have positive market and disposable incomes. Market income inequality and transfers are greatly exaggerated when including nonworking households, the far majority of which are retirees. This is particularly true of countries with generous public pension benefits, where many do not save for their old age and will therefore appear as “poor” (Huber and Stephens Reference Huber and Stephens2001). Another sizable group is students, who we would not ordinarily think of as poor since they have high expected future income.
We measure market income as the sum of labor, cash, and capital income plus private transfers, and disposable income as total cash income minus income taxes and social contributions. Following LIS standards, market and disposable incomes are equivalized by the square root of the number of household members, and they are bottom- and top-coded at one percent of the mean equivalized income and ten times the median unequivalized income. We use market income to calculate inequality indices and divide households into deciles.
The LIS household income surveys account for cash transfers but not for in-kind services (public goods in the theoretical discussion). To include the value of services, we rely on estimates of the combined value of education, healthcare, social housing, elderly care, and early childhood education and care. The estimates are from the OECD/EU database on the distributional impact of in-kind services and are, to the best of our knowledge, the only available data (OECD 2011: Ch. 8). We also rely on an allocation key from this database to distribute the gross value of services to each income decile’s disposable cash income.Footnote 6 The exact procedure we used is explained in Appendix 3.B.
Before estimating the transfer rate, we allocate the costs of transfers and services to the income deciles’ disposable income. Transfers and services are financed by tax revenues that mainly come from taxation of income, capital, property, and consumption. The LIS data capture the income tax burden of each income decile. Business taxes are treated as neutral with respect to income classes and simply added to government revenues. The rest is financed by (i) property and wealth taxes, which are paid almost exclusively by those in the top few percentiles and therefore added to the tax burden of the top income decile, and (ii) consumption taxes, which we assume are paid in proportion to each income decile’s consumption share. Further details are provided in Appendix 3.B.
The sum of disposable cash income and the net value of in-kind services is called the net “extended” income of each income decile. Subtracting market income from net extended income yields net transfers received. Following the theoretical expectations discussed earlier, the rate of transfers to M is net transfers received by the 5th income decile divided by the net extended income of the top income decile. To account for the value of insurance, we add (in some models) the transfer rate to L weighted by the sum of the unemployment and involuntary part-time employment rates (the mean weight is .1).Footnote 7 We also calculate transfer rates for all three groups expressed as a share of their own net extended income and use these as dependent variables in some models.
Variation in Transfer Rates
Figure 3.1 shows net transfers to M as a share of the net extended income of H (top panel) and M (bottom panel) with and without accounting for insurance (left and right panels). The gray lines are country-specific local polynomial smoothers and the black line describes the entire sample of countries and years.
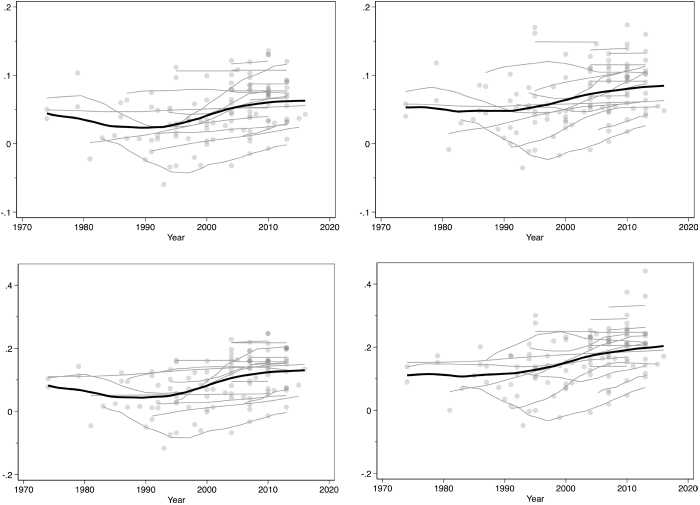
Figure 3.1 Net transfers to M as a share of the net extended income of H and M
Notes: N = 110. The figure shows net transfers to M as a share of the net extended income of H (top panel) and M (bottom panel) excluding and including the value of social insurance (left and right panels). The grey lines are country-specific local polynomial smoothers and the black line describes the entire sample of countries and years.
The panels illustrate that there is considerable spatial variation in the rate of transfers to M. The highest average values are observed in Ireland, Luxembourg, and Sweden and the lowest in the Netherlands and Germany. The average transfer rate to M is .05, ranging from –.06 in the Netherlands in 1993 to .14 in Ireland in 2010 (top left panel). The negative values imply that the 5th income decile is a net contributor to spending in a few country years. That is the case in Germany in the 1990s, in Netherlands in the 1990s and 2000s, and in Australia in 1981.
Accounting for insurance increases the rate of transfers to M on average by .022 and makes the 5th income decile a net beneficiary of spending in Germany already in the mid-1990s and in the Netherlands in the mid-2000s (top right panel). However, we may significantly underestimate the value of insurance. The calculation is based on the twin assumptions that people are mildly risk-averse (RRA = 1) and that the risk of falling into the L group is equal to the rate of unemployment and underemployment.Footnote 8 If people are more risk-averse (as empirical estimates suggest), if there are risks of falling into the L group for other reasons (such as illness or divorce), or if concerns about downward intergenerational mobility matter, the value of insurance will increase. More accurately accounting for the value of insurance is an important task for future research. Our substantive results are robust to increasing the weight of L’s transfer rate all the way to 50 percent (models are reported in Table 3.C1 in Appendix 3.C).
The lower panels show that transfers and services account for a substantial part of M’s extended income. On average, 9.3 percent of M’s extended income comes from transfers and services, topping at 25 percent in Ireland in 2010. Adding the value of insurance increases the average to 16 percent, with a maximum of 44.1 percent in Spain in 2013.
Turning to the trends in the top panel of Figure 3.1, we see that during the last forty years, a period of sharply rising inequality, the rate of transfers to M has been remarkably stable if not slightly increasing. This is consistent with (H1) and suggests that M’s transfer rate is unrelated to the relative income of H to M. It serves as a first indication that increased inequality has not weakened the power of the middle class to tax and redistribute income from the rich. Given that the rate of transfers from H to M is stable, it follows directly that net transfers to M have increased over time when expressed as a share of M’s own extended income. This is shown in the bottom panels of Figure 3.1, and it corroborates (H2).Footnote 9
In Figure 3.2, we show net transfer rates for all ten income deciles (net transfers for each decile as a share of the net income of H). We only show period averages (for 2010) because the rates are very stable over time, with only a slight increase in the transfer from the top decile to the other groups. What stands out is the overall redistributive effect of the tax and spending system (including transfers and public services) and the extent to which those in the top decile are net contributors. One might infer that the bottom end are the greatest beneficiaries, but it must again be kept in mind that if public spending serves insurance purposes, bottom-end transfers are also benefits for the middle. The overall picture that emerges is consistent with standard arguments about the redistributive effects of democracy, and there is no hint that the rich can skirt contributing to the system or that they are better able to do so today than fifty years ago.Footnote 10
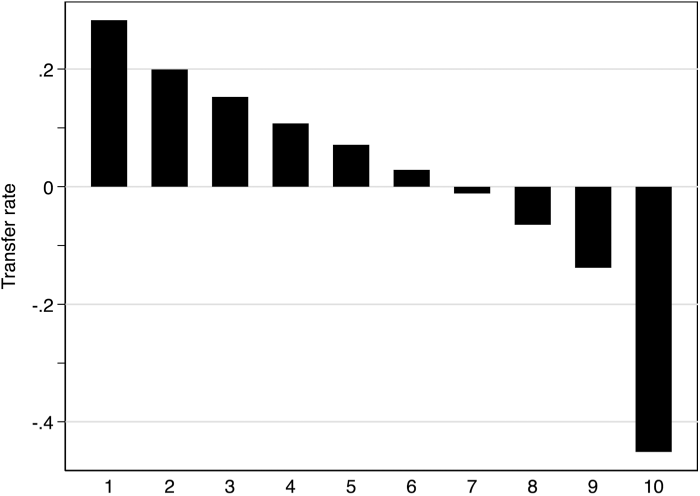
Figure 3.2 Net transfers by income decile
What Drives Transfers to and from Different Classes?
To put the descriptive results to a stricter test, we regress in Table 3.1 the rate of transfers to M on market income inequality, capital mobility, and partisanship of the government (using the previous estimating equation). Capital mobility is measured by Chinn and Ito’s (Reference Chinn and Ito2006, Reference Chinn and Ito2008) capital account openness variable and we also include trade openness as a measure of globalization (it is the sum of imports and exports as a share of GDP).Footnote 11 Partisanship of the government is a twenty-year moving average of the share of government-controlled parliamentary seats held by Right parties minus the share of government-controlled seats held by Left parties (based on Armingeon et al. Reference Armingeon, Wenger, Wiedemeier, Isler, Knöpfel, Weisstanner and Engler2018).Footnote 12 In addition, we include controls for labor force participation rates, unemployment, and real GDP growth.
Table 3.1 Determinants of net transfers to M as a percentage of H’s net income
| (1) | (2) | (3) | (4) | |
|---|---|---|---|---|
| Transfer rate M (%) | Transfer rate M incl. insurance (%) | |||
| P90/P50 | 0.84 | 2.62 | 0.26 | 1.99 |
| (3.33) | (4.16) | (3.29) | (4.07) | |
| P50/P10 | 1.79* | 1.34+ | 2.59* | 2.23* |
| (0.78) | (0.76) | (0.70) | (0.75) | |
| Trade openness (ln) | 2.40 | 0.71 | 1.82 | 0.61 |
| (1.93) | (2.79) | (1.93) | (2.80) | |
| Capital market openness | 1.16 | 2.04 | 0.22 | 1.03 |
| (2.21) | (2.10) | (1.93) | (2.03) | |
| Government partisanship (right) | −4.31* (1.46) | −3.67* (1.06) | −4.58* (1.55) | −4.07* (1.24) |
| Labor force participation | −0.23+ | −0.14 | −0.27* | −0.20 |
| (0.12) | (0.13) | (0.11) | (0.12) | |
| Unemployment | −0.05 | −0.02 | 0.15 | 0.16 |
| (0.14) | (0.12) | (0.11) | (0.10) | |
| Real GDP growth | −0.21 | −0.12 | −0.20 | −0.13 |
| (0.14) | (0.11) | (0.14) | (0.12) | |
| Trend | −0.27 | −0.22 | ||
| (0.19) | (0.20) | |||
| Trend2 | 0.01 | 0.00 | ||
| (0.00) | (0.00) | |||
| Constant | 3.66 | 3.33 | 9.53 | 7.77 |
| (9.01) | (18.23) | (8.58) | (17.78) | |
| R-squared | 0.38 | 0.42 | 0.49 | 0.52 |
| N | 110 | 110 | 110 | 110 |
Notes: *p < 0.05, +p < 0.1. Standard errors clustered by country in parentheses. All models include country fixed effects.
The results of Table 3.1 show that there is no association between top-end market income inequality and the rate of transfers to the middle class, providing further supportive evidence of (H1). In fact, the coefficients are positive, although they are always insignificant. The coefficients are also positive, and significant, for bottom-end inequality (the P50/P10 ratio). It is tempting to interpret this result from a Lupu-Pontusson (Reference Lupu and Pontusson2011) perspective to imply that a greater economic “distance” to the poor causes more resources to be concentrated in the middle. Yet, we will see later that the P50/P10 ratio is also positively related to L’s transfer rate (the skew has no effect). It appears that a middle class with a higher relative position in the income distribution has more political clout to redistribute to itself, which also brings L up in the process. Perhaps a higher P50/P10 ratio signals a more educated and politically efficacious middle class, but this is speculation – we do not know the mechanisms behind this effect. It stands up to a variety of controls, so it is not the result of any obvious omitted variable bias.
Capital mobility, whether measured by capital account openness or trade openness, has no impact on the rate of transfers to the middle class. The most obvious interpretation is that trade and foreign direct investment do not undermine, and may reinforce, specialized local knowledge clusters, which are not themselves mobile and therefore leave the state in a position to tax. Nothing in our data suggests that globalization has undermined the position of the middle class, which is consistent with (H4).
Instead, distributive politics seems to depend strongly on partisanship. In model (1), the coefficient for partisanship of the government suggests that stronger Left party participation in government is associated with higher rates of transfers to the middle class. And the size of the effect is substantial. A one standard deviation increase in left (right) partisanship of the government is associated with a 0.74 percentage points increase (decrease) in the rate of transfers to M.
In model (2), we add a time trend to the specification to ensure that our results are not driven by temporal trends. The results are robust to this alternative specification. The time-trend variables themselves are also not indicating any significant decline in transfer rates over time, as would be expected if governments were increasingly limited by capital mobility (in case these are not fully captured by the Chinn and Ito or the trade measures) or by new high-income veto players.
In models (3) and (4), we include insurance as part of the transfer rate to M. Overall, the results are very similar to those of models (1) and (2). Top-end inequality and capital mobility are not related to the transfer rate, while bottom-end inequality is. The effect size of partisanship remains stable. All in all, accounting for insurance increases the transfer rate to the middle class but the associations between the transfer rate, inequality, capital mobility, and government partisanship remain stable.
In Table 3.2, we show the results for the rate of transfers to L and to H, defined as the bottom and top deciles, respectively. For L, the results largely mirror those for M: there is little-to-no effect of top-end inequality, of capital openness, or of trade whereas left partisanship and bottom-end inequality increase transfers, as expected. For partisanship, a one standard deviation increase in right (left) partisanship decreases (increases) the transfer rate to L by 0.5 percentage points. For the P50/P10 ratio, a one standard deviation increase raises transfers to L substantially by 5.5 percent of L’s net income. It appears that as the distance between L and M increases, M becomes increasingly concerned about the risk of downward mobility and therefore supports more transfers to L. This result is consistent with (H3).
Table 3.2 Determinants of net transfers to L and H as a percentage of own net income
| (1) | (2) | (3) | (4) | |
|---|---|---|---|---|
| Transfer rate L (%) | Transfer rate H (%) | |||
| P90/P50 | −6.07 | −13.69+ | −20.00+ | −15.50 |
| (5.03) | (7.67) | (10.17) | (14.29) | |
| P50/P10 | 9.11* | 9.47* | −2.56 | −2.22 |
| (1.40) | (1.36) | (2.34) | (2.54) | |
| Trade openness (ln) | 5.06 | 3.03 | 14.92* | 19.41* |
| (3.68) | (3.36) | (6.57) | (8.02) | |
| Capital market openness | 7.44+ | 4.54 | 12.66 | 14.07 |
| (3.59) | (3.45) | (7.68) | (11.06) | |
| Government partisanship (right) | −2.89+ | −3.16* | 14.07 | 13.34+ |
| (1.66) | (1.48) | (8.49) | (7.65) | |
| Labor force participation | 0.33* | 0.15 | 0.28 | 0.32 |
| (0.14) | (0.16) | (0.36) | (0.47) | |
| Unemployment | −0.21 | −0.16 | −0.48 | −0.57 |
| (0.16) | (0.18) | (0.35) | (0.38) | |
| Real GDP growth | −0.11 | −0.07 | 0.38 | 0.20 |
| (0.17) | (0.22) | (0.46) | (0.57) | |
| Trend | 0.35+ | 0.08 | ||
| (0.19) | (0.77) | |||
| Trend2 | −0.00 | −0.00 | ||
| (0.00) | (0.01) | |||
| Constant | 5.48 | 38.13+ | −85.02* | −115.50* |
| (16.08) | (20.97) | (28.88) | (51.30) | |
| R-squared | 0.80 | 0.80 | 0.23 | 0.24 |
| N | 110 | 110 | 110 | 110 |
Notes: *p < 0.05, +p < 0.1. Robust standard errors in parentheses. All models include country fixed effects.
The results for H show that right partisanship improves top-end net income by reducing transfers away from H (although the effect is only marginally significant at the 0.1 level). So, apparently, does trade, which hints of a globalization effect. Capital market openness is, however, never significant. Perhaps most surprisingly, top-end inequality is associated with a rise in transfers from H to other groups (a negative sign means that H retains less of its income). The result is, however, only borderline significant in model (3), and it does not hold up when including the time trends in model (4), but there is clearly no support in our data for the notion that the rich have become politically more powerful as their market income has risen.
Overall, the results indicate that the power of the middle class is stable over time, despite the sharp rise in top-end inequality. The rich are becoming richer, but this wealth is not translated into greater influence over fiscal policy; the political power of capital and the rich over redistribution is only as great as their electoral strength (via Right parties).
A potential objection to this conclusion is that the rising incomes of H before taxes and transfers have come at the expense of M and L. This could reflect declining unionization, rising monopsony power in labor markets, rising monopoly power in product markets, skill-biased technological change, or a combination. There is ample evidence that the earnings distribution has widened, but how this affects the net income distribution, and relative welfare after accounting for public services, is not obvious. As the top earners gain, some of those gains are shared with the middle and the bottom. Iversen and Soskice (Reference Iversen and Soskice2019, ch. 1) suggest a simple test of this broader notion of power, which is to examine the position of the middle class in the overall income distribution over time. If a fall in earnings in the middle – what is sometimes referred to as a hollowing-out or polarization effect (Goos and Manning Reference Goos and Manning2007) – outweighs middle-class power over government spending policies, it will show up as a decline in median-to-mean net incomes.
We test this possibility in Figure 3.3. The figure displays median-to-mean disposable income ratios for nineteen countries around 1985 and 2010 (i.e., the value of in-kind benefits and indirect taxes are not included in disposable income). This is the period with the sharpest rise in market income inequality, yet the figure shows that the median disposable income relative to the mean disposable income has been largely stable (the average change is not significantly different from zero).Footnote 13 There is some modest variance around the 45-degree line: Spain, Greece, and Ireland have all seen increases of 4.4–6.5 percent, while Australia, Canada, Finland, New Zealand, the United Kingdom, and the United States have all experienced declines of 3.5–6.8 percent. It is not an accident that much of the literature proclaiming a declining middle class comes from the liberal market economies because this is where we observe some erosion.Footnote 14 Still, even in these cases, the relative drop (4.8 percent on average) is greatly outpaced by the rise in mean (and median) incomes (an average of 34 percent). It is also noteworthy that the relative income of the median falls within a narrow band of 0.83 to 0.93, with the Nordic countries somewhat higher and the UK and United States somewhat lower than the rest.
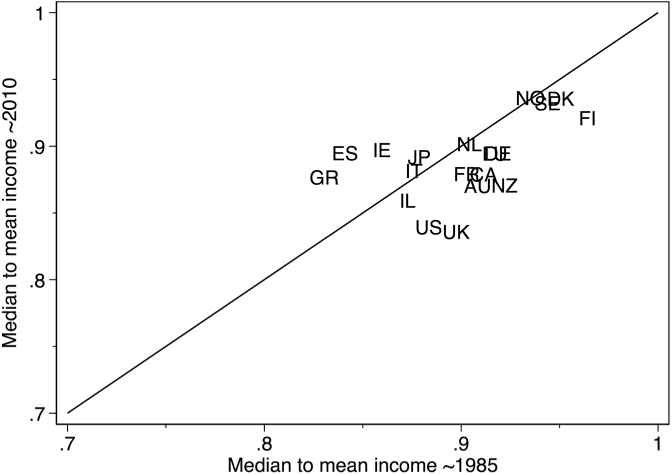
Figure 3.3 The median net income relative to mean net income, 1985–2010
Notes: The measures for AU, CA, DK, FI, FR, DE, IE, IL, IT, LU, NL, NO, ES, UK, and the US are the disposable income of the median relative to the mean (working households) from the LIS database (authors’ calculations). For GR, JP, NZ, and SE, the measures are the disposable income of the median relative to the mean (working-age population) from the OECD income distribution database. The start and end points of the countries are AU: 1985–2010, CA: 1987–2010, DK: 1987–2010, DE: 1984–2010, ES: 1985–2010, FI: 1987–2010, FR: 1984–2010, GR: 1986–2010, IE: 1987–2010, IL: 1986–2010, IT:1986–2010, JP: 1985–2009, LU: 1985–2010, NL: 1983–2010, NO: 1986–2010, NZ: 1985–2009, SE: 1983–2010, UK: 1986–2010, US: 1986–2010.
These findings may seem surprising against the evidence of a hollowing-out effect of skill-biased technological change, but those most affected by SBTC are clerical jobs and manual jobs in manufacturing, which are typically somewhat below the median. The middle class has generally been able to either acquire new skills to retain a foothold in the knowledge economy, or it has been able to rely on government transfers and generous provision of public services (and insurance) to defend its living standards. This should not be taken to mean that the political upheaval over rising inequality and fear of middle-class decline is not real. To the contrary, such upheaval is precisely the political expression of a middle class striving to defend its position.
Distribution of Macroeconomic Growth
Although Figure 3.3 shows that median household income has been fairly stable relative to the mean in most countries, it does not capture how overall macroeconomic growth has been distributed to income classes. A common way of doing so is to compare median equivalized household income growth with GDP per capita growth. Yet even though this approach is widely adopted by both scholars and political pundits, it has significant limitations.
First, disposable household income accounts for cash income, cash transfers, and direct taxes, but it does not account for indirect taxes, the value of in-kind benefits or public goods, or economic activity in other sectors than the household sector. Consequently, disposable household income is a far narrower concept than GDP, which is a measure of the overall economic output of a country. Second, to account for economies of scale, household income is usually equivalized by the square root of the number of household members, whereas GDP is measured per capita. This difference is important because changes in family structures will directly affect equivalized household income even if the underlying (personalized) income distribution is constant. Falling marriage rates and rising divorce rates have increased the number of single-member households and this has caused a relative decline in equivalized median disposable household income in many countries. Indeed, Nolan, Roser, and Thewissen (Reference Nolan, Roser, Thewissen and Nolan2018, 95) find that “[h]ousehold size is the most important factor on average across countries, accounting for 45 percent of the overall discrepancy [between median equivalized household income and GDP per capita]; it is also the most consistent factor in terms of the scale and direction of its effects, since average household size declined in most countries.” For these reasons, it is problematic to assess the distribution of macroeconomic growth by comparing growth in median equivalized household income to GDP per capita growth. Instead, one needs estimates that are directly comparable and consistent with macroeconomic aggregates.
As part of the development of the WID, Piketty, Saez, and Zucman (Reference Piketty, Saez and Zucman2018) were the first to provide such estimates. Using a combination of survey, tax, and national accounts data for the United States, they distribute total national income (GDP minus capital depreciation plus net foreign income) to individuals across the income distribution. These distributional national accounts series are consistent with macroeconomic aggregates, which enables a direct examination of the distribution of economic growth to different groups. Thanks to the work of Blanchet, Chancel, and Gethin (Reference Blanchet, Chancel and Gethin2022), comparable estimates are now available for Europe.
The WID income measures differ in several respects from the LIS measures that we use to study the median-to-mean disposable income ratio earlier. First, and as discussed, disposable household income includes only cash income and transfers, and it subtracts only direct taxes. The WID measures are broader and account not only for cash income (including transfers) and direct income taxes, but also for in-kind transfers, public goods, and indirect taxes. Although the WID measures are broader than what individuals and households will be able to see on their bank accounts, it is widely seen as superior to the measure of cash disposable income as a measure of a household’s standard of living (Garfinkel, Rainwater, and Smeeding Reference Garfinkel, Rainwater and Smeeding2006). Second, as in most other studies that rely on household income surveys to study redistribution, we sought to exclude students and retirees by restricting the LIS samples to households with positive market and disposable incomes. The WID data, by contrast, include all individuals twenty years or older. Third, whereas disposable household income is equivalized using an equivalence scale, the WID individualizes income using an equal-split approach that divides income equally between spouses. Sharing between spouses is a real form of redistribution and therefore important to account for, but the equal-split approach also makes the WID estimates dependent on changes in the structure of families, as we will discuss later.
Overall, however, the WID data are superior to household income surveys when it comes to assessing the distribution of macroeconomic growth over recent decades, and we therefore rely on these data in the following analysis. We have data for sixteen European countries as well as the United States in the period 1980 to 2019.
Figure 3.4 displays the real extended income growth of the bottom and middle-income quintiles compared to the mean income growth in each of the seventeen countries included in the sample.Footnote 15 The figure shows that both the bottom and middle-income quintiles have experienced significant income growth in a wide range of European countries since 1980, and in most cases, the middle has kept up quite well with the overall expansion of the economy; in Belgium and Spain, its income growth has even outpaced that of the mean. Rather surprisingly, in several countries, the bottom quintile has experienced stronger income growth than both the middle and the overall economy. By contrast, in Greece and Italy, income growth has been meager overall, and both L and M have experienced close to zero percent income growth. In Europe as a whole, the income growth of both L and M has kept up reasonably well with the overall economy (see the graph for the European average): their income growth is within five percentage points of the mean income growth of 59 percent. Because this pattern has been driven in large part by fiscal transfers and in-kind government spending, we see it as a sign of well-functioning democratic systems.
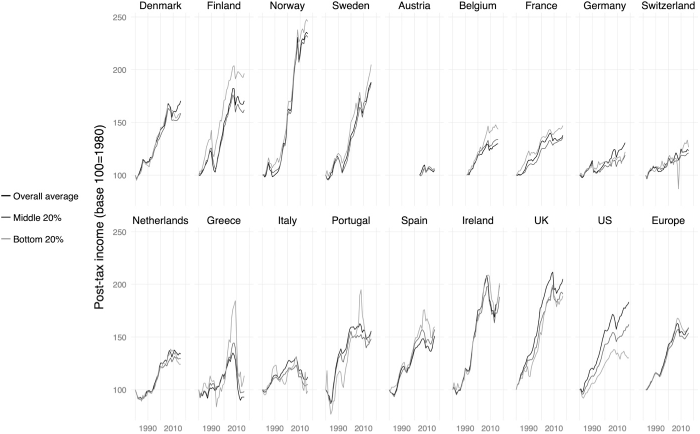
Figure 3.4 Real extended income growth in 17 Europe and the United States, 1980–2019
Notes: In Austria, Belgium, and Switzerland, the base 100 is 2004, 1991, and 1982. The graph for Europe includes all the European countries except Austria and Belgium and has base 100 in 1982.
The United States is a major outlier, however. While the overall economy has expanded by 77 percent between 1980 and 2016, the bottom quintile has experienced an extended income growth of just 33 percent. Moreover, a significant part of L’s income growth is due to increases in public goods provision. When we change the distribution of public goods from an equal lump sum to being proportional to disposable income (except for health), thereby assuming that public goods (other than those related to health) are neutral with respect to redistribution, bottom-end incomes have grown just 13 percent in real terms since 1980. With a real extended income growth of 56 percent, the middle has done better than the bottom and experienced income growth at comparable levels to the overall European average, but it is still significantly lagging the mean (as opposed to L, M’s income growth declines only slightly to 51 percent when we change the allocation of public goods). The United States is the only advanced democracy in which greater economic prosperity has been distributed so unequally. Comparing the LIS data to the WID data thus exposes the United States as a large outlier, while the results for other countries are very consistent across datasets. What explains this finding?
Part of the reason appears related to race and changes in family structure. The theoretical model assumes that redistributive politics is governed by class, but racism is a widely recognized dimension of American politics in general, and redistributive politics in particular (Alesina and Glaeser Reference Alesina and Glaeser2004; Cramer Reference Cramer2016; Gilens Reference Gilens2009). Even though racism has been a constant feature of American politics, it might affect our results dynamically for two reasons. First, rising poverty and risk of poverty have been concentrated among minorities, which has undermined the demand for insurance among the majority. Second, a declining marriage rate has been a source of inequality and the decline has been more pronounced among poor minorities. Single black mothers – Reagan’s “welfare queens” – get little sympathy among the white majority. European countries have seen a similar decline in marriage rates, but the state has compensated for the implied rise in inequality through increased family allowances and other transfers. This conjecture finds direct support in the WID data because if each spouse is given his or her own labor income, instead of dividing income equally between spouses, the evolution of real extended income, for especially the bottom, pulls much closer to the mean income line (see Figure 3.C1 in Appendix 3.C). Still, redistribution within the household is real, and the puzzle remains of why the government has not compensated for lower within-household redistribution.
Conclusion
The rise in income inequality over the past four decades has created concerns that democracy is being undermined by the rich, by footloose capital, or both. These concerns have been backed by alarming recent evidence that public policies – especially those pertaining to taxes, social spending, and redistribution – are being dictated by the rich or by the rising structural power of capital. This chapter does not assuage the concern over rising inequality, but it does challenge the notion that democratic governments are no longer responsive to majority demands, and in particular to those of the middle classes.
Using macro evidence for transfer rates, we find consistently that policies are well aligned with the distributive interests of the middle class, and the transfer rate (including the value of services) to the middle class as a share of high incomes has remained constant or even slightly risen during a period when top-end inequality grew notably. This is not consistent with a view that accords greatly increasing influence to the rich. Indeed, since we measure transfer rates as a share of the net income of the rich, it is unambiguously the case that net transfers as a share of middle incomes have risen over time. This finding is unacknowledged in the current literature, but it is very much in accordance with long-standing traditions in the field, which emphasize the pivotal role of the middle class.
Our results are thus reassuring about the continued importance of democracy for distributive politics. But there are several qualifications to this broad conclusion. Although transfer rates are stable, if we consider the position of the middle in the overall disposable income distribution, we see some erosion in majoritarian, liberal market economies from the mid-1980s. The drop in relative position is small compared to increases in real incomes in the same period, but it is noteworthy nonetheless. Also noteworthy is that real extended income growth has grown increasingly unequal in the United States, which stands out as a major outlier among advanced democracies.
Perhaps more fundamentally, it is important to keep in mind that democratic politics does not guarantee that inequality is adequately addressed. One of the misleading assumptions in some of the contemporary literature is that a working democracy will compensate for inequality, implying that when we see a rise in inequality, we should also expect to see more redistribution. That is not implied by majority rule. Distributive politics is multidimensional, and political alliances determine who benefit and who do not. Since the middle class and its representatives usually stand at the center of the political coalition game, middle-class interests are generally well-attended to. But the poor depend on being invited into government coalitions or else on the generosity of the middle class. The trend since the 1990s toward center-right governments has hurt the poor, and bifurcation of risks and any drop in mobility between the middle and the bottom will undermine insurance motives in the middle class to support bottom-end redistribution. Precisely because democratic governments are so important for redistribution, explaining partisanship and middle-class preferences remains an important task for political economy.


 Open access