
Book contents
- Frontmatter
- Dedication
- Contents
- Figures
- Preface
- 1 Learning from Data, and Tools for the Task
- 2 Generalizing from Models
- 3 Multiple Linear Regression
- 4 Exploiting the Linear Model Framework
- 5 Generalized Linear Models, and Survival Analysis
- 6 Time Series Models
- 7 Multilevel Models, and Repeated Measures
- 8 Tree-Based Classification and Regression
- 9 Multivariate Data Exploration and Discrimination
- Appendix A The R System: a Brief Overview
- References
- References to R Packages
- Index of R Functions
- Index of Terms
- References
References to R Packages
Published online by Cambridge University Press: 11 May 2024

Book contents
- Frontmatter
- Dedication
- Contents
- Figures
- Preface
- 1 Learning from Data, and Tools for the Task
- 2 Generalizing from Models
- 3 Multiple Linear Regression
- 4 Exploiting the Linear Model Framework
- 5 Generalized Linear Models, and Survival Analysis
- 6 Time Series Models
- 7 Multilevel Models, and Repeated Measures
- 8 Tree-Based Classification and Regression
- 9 Multivariate Data Exploration and Discrimination
- Appendix A The R System: a Brief Overview
- References
- References to R Packages
- Index of R Functions
- Index of Terms
- References
Summary
A summary is not available for this content so a preview has been provided. Please use the Get access link above for information on how to access this content.
- Type
- Chapter
- Information
- A Practical Guide to Data Analysis Using RAn Example-Based Approach, pp. 508 - 513Publisher: Cambridge University PressPrint publication year: 2024
References
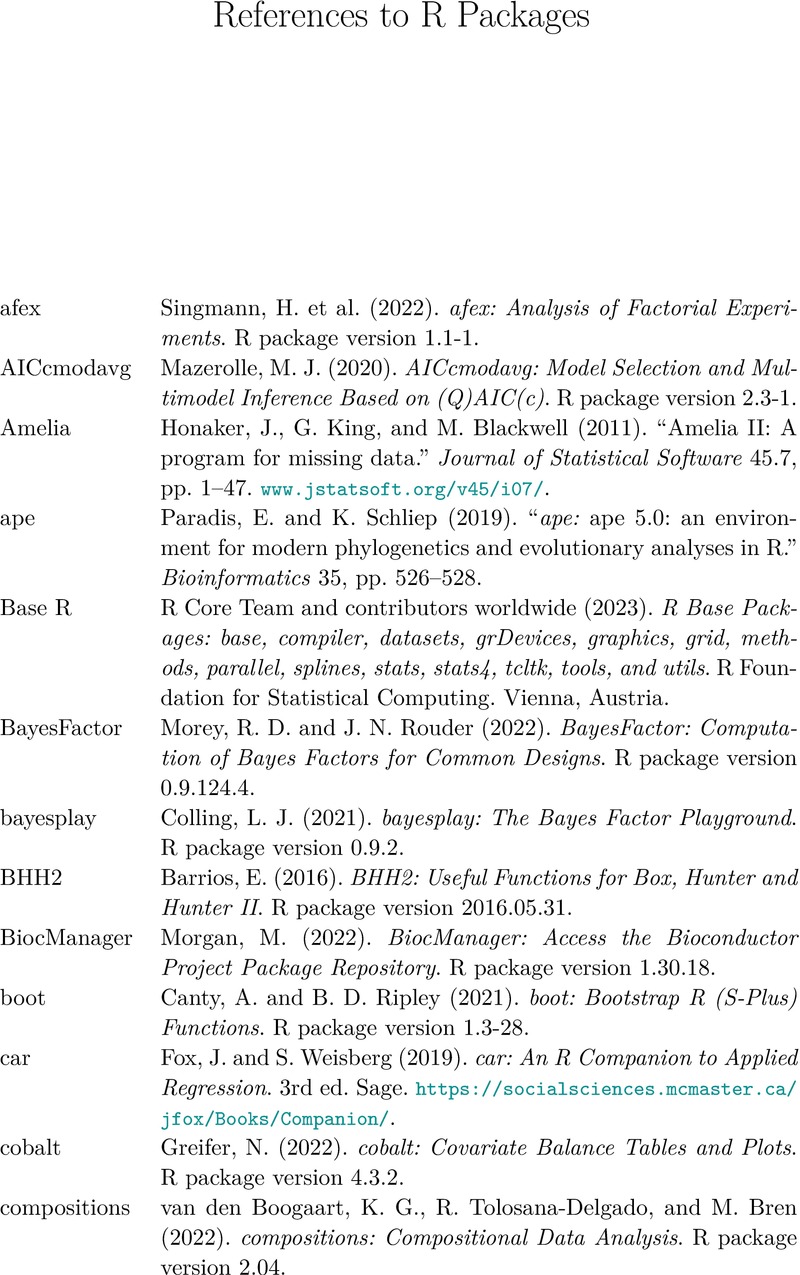
References to R Packages
Singmann, H. et al. (2022). afex: Analysis of Factorial Experiments. R package version 1.1-1.Google Scholar
Mazerolle, M. J. (2020). AICcmodavg: Model Selection and Multimodel Inference Based on (Q)AIC(c). R package version 2.3-1.Google Scholar
Honaker, J., King, G., and Blackwell, M. (2011). “Amelia II: A program for missing data.” Journal of Statistical Software 45.7, pp. 1–47. www.jstatsoft.org/v45/i07/.CrossRefGoogle Scholar
Paradis, E. and Schliep, K. (2019). “ape: ape 5.0: an environment for modern phylogenetics and evolutionary analyses in R.” Bioinformatics 35, pp. 526–528.CrossRefGoogle ScholarPubMed
R Core Team and contributors worldwide (2023). R Base Packages: base, compiler, datasets, grDevices, graphics, grid, methods, parallel, splines, stats, stats4, tcltk, tools, and utils. R Foundation for Statistical Computing. Vienna, Austria.Google Scholar
Morey, R. D. and Rouder, J. N. (2022). BayesFactor: Computation of Bayes Factors for Common Designs. R package version 0.9.124.4.Google Scholar
Colling, L. J. (2021). bayesplay: The Bayes Factor Playground. R package version 0.9.2.Google Scholar
Barrios, E. (2016). BHH2: Useful Functions for Box, Hunter and Hunter II. R package version 2016.05.31.Google Scholar
Morgan, M. (2022). BiocManager: Access the Bioconductor Project Package Repository. R package version 1.30.18.Google Scholar
Canty, A. and Ripley, B. D. (2021). boot: Bootstrap R (S-Plus) Functions. R package version 1.3-28.Google Scholar
Fox, J. and Weisberg, S. (2019). car: An R Companion to Applied Regression. 3rd ed. Sage. https://socialsciences.mcmaster.ca/jfox/Books/Companion/.Google Scholar
Greifer, N. (2022). cobalt: Covariate Balance Tables and Plots. R package version 4.3.2.Google Scholar
van den Boogaart, K. G., Tolosana-Delgado, R., and Bren, M. (2022). compositions: Compositional Data Analysis. R package version 2.04.Google Scholar
Maindonald, J. H. and Braun, W. J. (2011). DAAG: Data analysis and graphics using R. An Example-Based Approach. 3rd ed. The DAAG package was created to support this text. Cambridge University Press.Google Scholar
Maindonald, J. (2017). DAAGbio: Data Sets and Functions, for Demonstrations with Expression Arrays and Gene Sequences. R package version 0.63-3.Google Scholar
Hartig, F. (2022). DHARMa: Residual Diagnostics for Hierarchical (Multi-Level / Mixed) Regression Models. R package version 0.4.5.Google Scholar
Lumley, T. (2022). dichromat: Color Schemes for Dichromats. R package version 2.0-0.1.Google Scholar
Wickham, H. et al. (2022). dplyr: A Grammar of Data Manipulation. R package version 1.0.9.Google Scholar
Meyer, D. et al. (2022). e1071: Misc Functions of the Department of Statistics, Probability Theory Group (Formerly: E1071), TU Wien. R package version 1.7-11.Google Scholar
Fox, J. and Weisberg, S. (2018). “effects: Visualizing fit and lack of fit in complex regression models with predictor effect plots and partial residuals.” Journal of Statistical Software 87.9, pp. 1–27. https://doi.org/10.18637/jss.v087.i09.CrossRefGoogle Scholar
Ben-Shachar, M. S., Lüdecke, D., and Makowski, D. (2020). “effectsize: Estimation of effect size indices and standardized parameters.” Journal of Open Source Software 5.56, p. 2815. https://doi.org/10.21105/joss.02815.CrossRefGoogle Scholar
Hyndman, R. et al. (2022). forecast: Forecasting functions for time series and linear models. R package version 8.16. https://pkg.robjhyndman.com/forecast/.Google Scholar
Fortran code by Alan Miller, T. l. based on (2020). leaps: Regression Subset Selection. R package version 3.1.Google Scholar
Rigby, R. A. and Stasinopoulos, D. M. (2005). “gamlss: Generalized additive models for location, scale and shape (with discussion).” Applied Statistics 54, pp. 507–554.Google Scholar
Barrett, M. (2022). ggdag: Analyze and Create Elegant Directed Acyclic Graphs. R package version 0.2.6.Google Scholar
Wickham, H. (2016). ggplot2: Elegant Graphics for Data Analysis. Springer-Verlag. https://ggplot2.tidyverse.org.CrossRefGoogle Scholar
Brooks, M. E. et al. (2017). “glmmTMB: glmmTMB balances speed and flexibility among packages for zero-inflated generalized linear mixed modeling.” The R Journal 9.2, pp. 378–400. https://journal.r-project.org/archive/2017/RJ-2017-066/index.html.CrossRefGoogle Scholar
Warnes, G. R. et al. (2022). gmodels: Various R Programming Tools for Model Fitting. R package version 2.18.1.1.Google Scholar
Auguie, B. (2017). gridExtra: Miscellaneous Functions for “Grid” Graphics. R package version 2.3.Google Scholar
Maindonald, J. H. and Burden, C. J. (2005). “hddplot: Selection bias in plots of microarray or other data that have been sampled from a high-dimensional space.” In Proceedings of 12th Computational Techniques and Applications Conference CTAC-200). Ed. by May, R. and Roberts, A. J.. Vol. 46, pp. C59–C74. journal.austms.org.au/V46/CTAC2004/Main/home.html.Google Scholar
Moritz, S. and Bartz-Beielstein, T. (2017). “imputeTS: Time series missing value imputation in R.” The R Journal 9.1, pp. 207–218. https://doi.org/10.32614/RJ-2017-009.CrossRefGoogle Scholar
Greenwell, B. M. and Kabban, C. M. S. (2014). “investr: An R package for inverse estimation.” The R Journal 6.1, pp. 90–100. https://doi.org/10.32614/RJ-2014-009.CrossRefGoogle Scholar
Wand, M. (2021). KernSmooth: Functions for Kernel Smoothing Supporting Wand & Jones (1995). R package version 2.23-20.Google Scholar
Xie, Y. (2023). knitr: A General-Purpose Package for Dynamic Report Generation in R. R package version 1.42. https://yihui.org/knitr/.Google Scholar
Sarkar, D. (2008). lattice: Lattice: Multivariate Data Visualization with R. Springer. http://lmdvr.r-forge.r-project.org.Google Scholar
Sarkar, D. and Andrews, F. (2022). latticeExtra: Extra Graphical Utilities Based on Lattice. R package version 0.6-30.Google Scholar
Ritchie, M. E. et al. (2015). “limma: limma powers differential expression analyses for RNA-sequencing and microarray studies.” Nucleic Acids Research 43, e47. https://doi.org/10.1093/nar/gkv007. (Install using Bioconductor::install().)CrossRefGoogle ScholarPubMed
Bates, D. et al. (2015). “lme4: Fitting linear mixed-effects models using lme4.” Journal of Statistical Software 67.1, pp. 1–48. https://doi.org/10.18637/jss.v067.i01.CrossRefGoogle Scholar
Zeileis, A. and Hothorn, T. (2002). “lmtest: Diagnostic checking in regression relationships.” R News 2.3, pp. 7–10.Google Scholar
Efron, B., Turnbull, B., and Narasimhan, B. (2015). locfdr: Computes Local False Discovery Rates. R package version 1.1-8.Google Scholar
Venables, W. N. and Ripley, B. D. (2002). MASS: Modern Applied Statistics with S. 4th ed. Springer. www.stats.ox.ac.uk/pub/MASS4/.CrossRefGoogle Scholar
Ho, D. E. et al. (2011). “MatchIt: Nonparametric preprocessing for parametric causal inference.” Journal of Statistical Software 42.8, pp. 1–28. https://doi.org/10.18637/jss.v042.i08.CrossRefGoogle Scholar
Martin, A. D., Quinn, K. M., and Park, J. H. (2011). “MCMC-pack: Markov Chain Monte Carlo in R.” Journal of Statistical Software 42.9, p. 22. https://doi.org/10.18637/jss.v042.i09.CrossRefGoogle Scholar
Bates, D., Maechler, M., and Bolker, B. (2019). MEMSS: Data Sets from Mixed-Effects Models in S. R package version 0.9-3.Google Scholar
Fasiolo, M. et al. (2018). “Scalable visualisation methods for modern generalized additive models.” Arxiv preprint. https://arxiv.org/abs/1809.10632.Google Scholar
van Buuren, S. and Groothuis-Oudshoorn, K. (2011). “mice: Multivariate imputation by chained equations in R.” Journal of Statistical Software 45.3, pp. 1–67. https://doi.org/10.18637/jss.v045.i03. www.gerkovink.com/miceVignettes/.Google Scholar
Robitzsch, A. and Grund, S. (2023). miceadds: Some Additional Multiple Imputation Functions, Especially for ‘mice’. R package version 3.16-18.Google Scholar
Audigier, V. and Resche-Rigon, M. (2021). micemd: Multiple Imputation by Chained Equations with Multilevel Data. R package version 1.8.0.Google Scholar
Stekhoven, D. J. and Buehlmann, P. (2012). “missForest: Miss-Forest – non-parametric missing value imputation for mixed-type data.” Bioinformatics 28.1, pp. 112–118. https://academic.oup.com/bioinformatics/article/28/1/112/219101?.CrossRefGoogle ScholarPubMed
Braun, W. J. and MacQueen, S. (2022). MPV: Data Sets from Montgomery, Peck and Vining. R package version 1.58.Google Scholar
Hess, K. and Gentleman, R. (2021). muhaz: Hazard Function Estimation in Survival Analysis. R package version 1.2.6.4.Google Scholar
Pollard, K. S., Dudoit, S., and van der Laan, M. J. (2005). “Multiple testing procedures: R multtest package and applications to genomics.” In Bioinformatics and Computational Biology Solutions Using R and Bioconductor. Springer. (Install using Bioconductor::install().)Google Scholar
Genz, A. et al. (2021). mvtnorm: Multivariate Normal and t Distributions. R package version 1.1-3.Google Scholar
Pinheiro, J., Bates, D., and R Core Team (2022). nlme: Linear and Nonlinear Mixed Effects Models. R package version 3.1-158.Google Scholar
Venables, W. N. and Ripley, B. D. (2002). nnet: Modern Applied Statistics with S. 4th ed. Springer. www.stats.ox.ac.uk/pub/MASS4/.CrossRefGoogle Scholar
Venables, W. N. and Hornik, K. (2016). oz: Plot the Australian Coastline and States. R package version 1.0-21. S original by Bill Venables, R port by Kurt Hornik.Google Scholar
Wickham, H. (2011). “plyr: The split-apply-combine strategy for data analysis.” Journal of Statistical Software 40.1, pp. 1–29. www.jstatsoft.org/v40/i01/.CrossRefGoogle Scholar
Fasiolo, M. et al. (2021). “qgam: Bayesian nonparametric quantile regression modeling in R.” Journal of Statistical Software 100.9, pp. 1–31. https://doi.org/10.18637/jss.v100.i09.CrossRefGoogle Scholar
Maindonald, J. H. (2021). qra: Quantal Response Analysis for Dose-Mortality Data. R package version 0.2.7.Google Scholar
Liaw, A. and Wiener, M. (2002). “randomForest: Classification and regression by randomForest.” R News 2.3, pp. 18–22.Google Scholar
Fox, J. and Bouchet-Valat, M. (2022). Rcmdr: R Commander. R package version 2.8-0. https://socialsciences.mcmaster.ca/jfox/Misc/Rcmdr/.Google Scholar
Held, L., Micheloud, C., and Pawel, S. (2021). “ReplicationSuccess: The assessment of replication success based on relative effect size.” The Annals of Applied Statistics 16.2, pp. 706–720. https://doi.org/10.1214/21-AOAS1502.Google Scholar
Wickham, H. (2007). “reshape2: Reshaping data with the reshape package.” Journal of Statistical Software 21.12, pp. 1–20. www.jstatsoft.org/v21/i12/.CrossRefGoogle Scholar
Murdoch, D. and Adler, D. (2021). rgl: 3D Visualization Using OpenGL. R package version 0.108.3.Google Scholar
Maechler, M. et al. (2022). robustbase: Basic Robust Statistics. R package version 0.95-0. http://robustbase.r-forge.r-project.org/.Google Scholar
Therneau, T. and Atkinson, B. (2022). rpart: Recursive Partitioning and Regression Trees. R package version 4.1.16.Google Scholar
Milborrow, S. (2022). rpart.plot: Plot ‘rpart’ Models: An Enhanced Version of ’plot.rpart’. R package version 3.1.1.Google Scholar
Rundel, C. et al. (2021). statsr: Companion Software for the Coursera Statistics with R Specialization. R package version 0.3.0.Google Scholar
Therneau, T. M. and Grambsch, P. M. (2000). Modeling Survival Data: Extending the Cox Model. Springer.CrossRefGoogle Scholar
Andrews, J. L. et al. (2018). “teigen: An R package for model-based clustering and classification via the multivariate t distribution.” Journal of Statistical Software 83.7, pp. 1–32. http://doi.org/10.18637/jss.v083.i07.CrossRefGoogle Scholar
Trapletti, A. and Hornik, K. (2022). tseries: Time Series Analysis and Computational Finance. R package version 0.10-51.Google Scholar
Meyer, D., Zeileis, A., and Hornik, K. (2022). vcd: Visualizing Categorical Data. R package version 1.4-10.Google Scholar
Yee, T. W. (2023). VGAM: Vector Generalized Linear and Additive Models. R package version 1.1-8.Google Scholar
Arel-Bundock, V. (2022). WDI: World Development Indicators and Other World Bank Data. R package version 2.7.7.Google Scholar
Dahl, D. B. et al. (2019). xtable: Export Tables to LaTeX or HTML. R package version 1.8-4.Google Scholar
Zeileis, A. and Grothendieck, G. (2005). “zoo: S3 infrastructure for regular and irregular time series.” Journal of Statistical Software 14.6, pp. 1–27. https://doi.org/10.18637/jss.v014.i06.CrossRefGoogle Scholar