

Many policy makers and business experts have expressed concern about the deteriorating savings and retirement readiness of older Americans. The Federal Reserve 2015 Survey of Household Economics and Decisionmaking states that “Thirty-one percent of non-retired respondents report that they have no retirement savings, including 27 percent of non-retired respondents age 60 or older.” Measurements from the Boston College National Retirement Risk Index show “52 percent of households are ‘at risk’ of not having enough to maintain their living standards in retirement.”1 Fidelity Investments notes that “More than half of Americans [are] at risk of not covering essential expenses in Retirement.”2
Several factors may be contributing to the growing financial challenges facing older Americans, including reduced pensions, increasing debt, and low savings. In previous generations, retirees relied on defined benefit plans offered by larger employers and Social Security to cover retirement expenses. Yet today “only half of American workers have access to an employer-based retirement plan.”3 As well, Social Security is facing its own financial challenges, and many experts are proposing an increase in the retirement age.4
At the same time that the coverage of pension plans is shrinking, debt among the elderly and near elderly is growing. According to researchers at the Federal Reserve Bank of New York,5 “Debt held by borrowers between the ages of 50 and 80 … increased by roughly 60 percent (between 2003 and 2015).” See Figure 9.1.
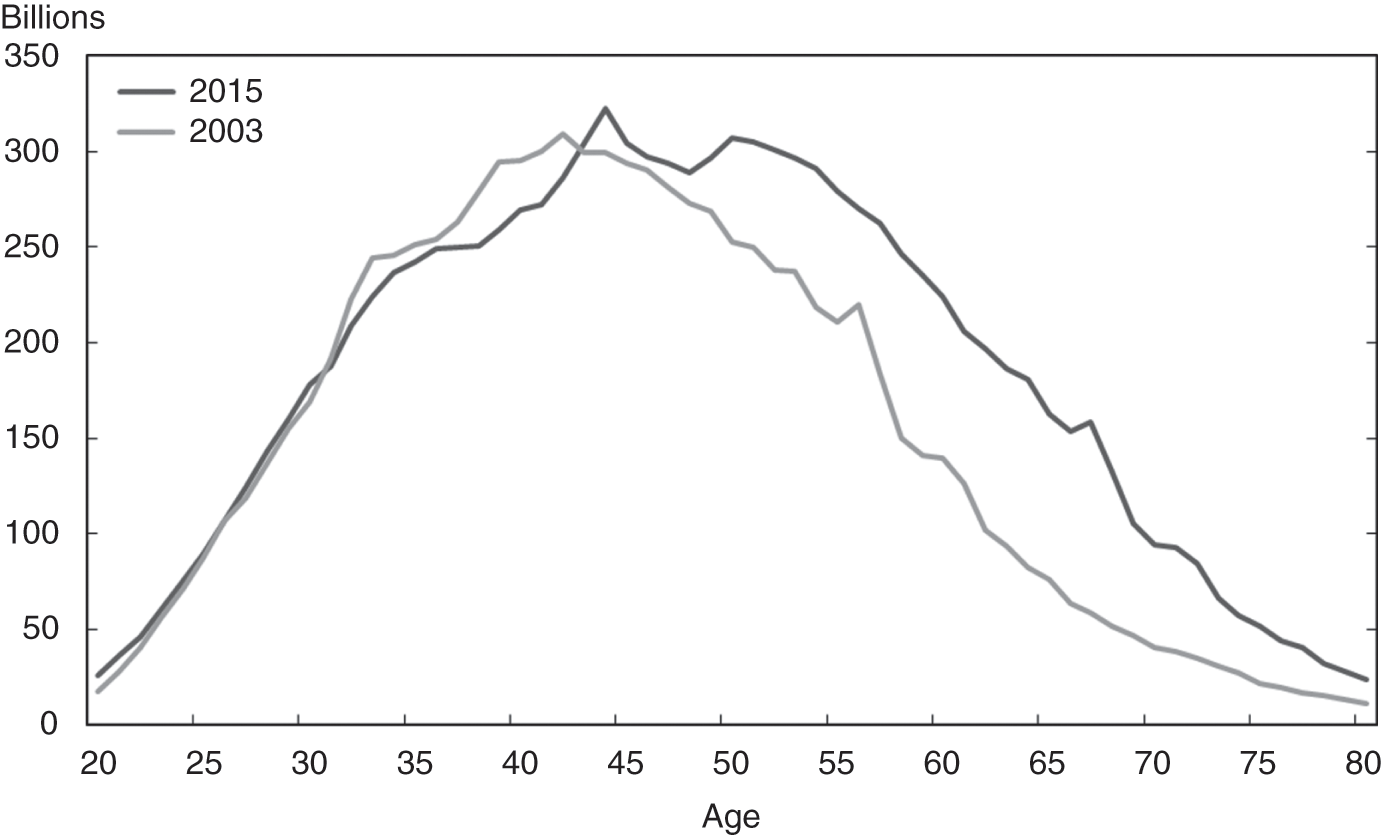
Figure 9.1 Total Debt Balance by Age of Borrower
The predominant factor driving increased debt was mortgages taken out in the 2000s; credit card debt actually fell over the same period for older households.6 This result is not surprising. After all, Greenspan and Kennedy (Reference Greenspan and Kennedy2005) pointed out that homeowners extracted $564 billion of home equity per year from 2001 to 2005.
Unfortunately, as debt is rising, most Americans of retirement age still have low balances of financial assets. According to the U.S. Census Bureau, median net worth excluding home equity in 2011 for the elderly aged 65 to 69 was only $43,921 (Figure 9.2).
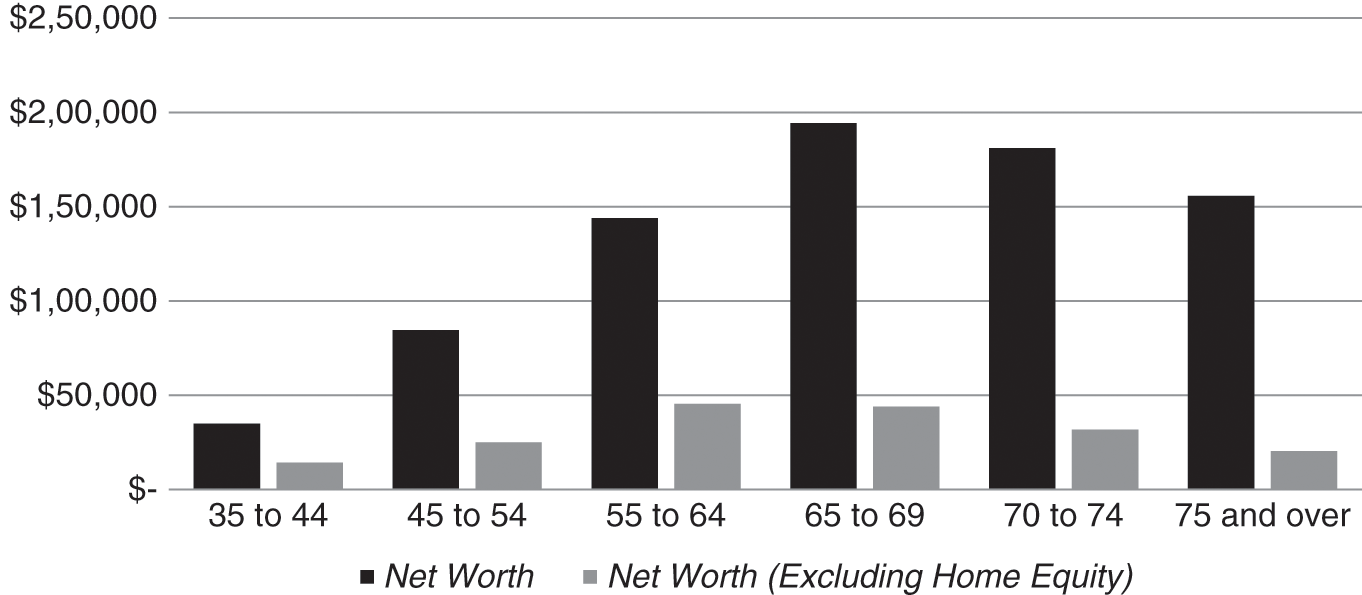
Figure 9.2 Median Net Worth in 2011
Thus it is not surprising that Poterba and colleagues (Reference Poterba, Venti and Wise2011) show that “Even if households used all of their financial assets … to purchase a life annuity, only 47 percent of households between the ages of 65 and 69 in 2008 could increase their life-contingent income by more than $5,000 per year.” Savings are not large enough at this point to address the growing needs of the elderly.
For older households struggling to finance retirement, owning a home may explain how many retirees are able to successfully get by.7 As shown in Figure 9.3, the share of elderly households owning their home increased by about five percentage points from 1982 to 2012 to a peak of nearly 84 percent of those aged 70 to 74. Since that time, the rate has fallen a bit (to 81 percent), but the vast majority of the elderly own their primary residence today. Owning a home can substantially reduce expenses and risk associated with retirement (Sinai and Souleles Reference Sinai and Souleles2005).
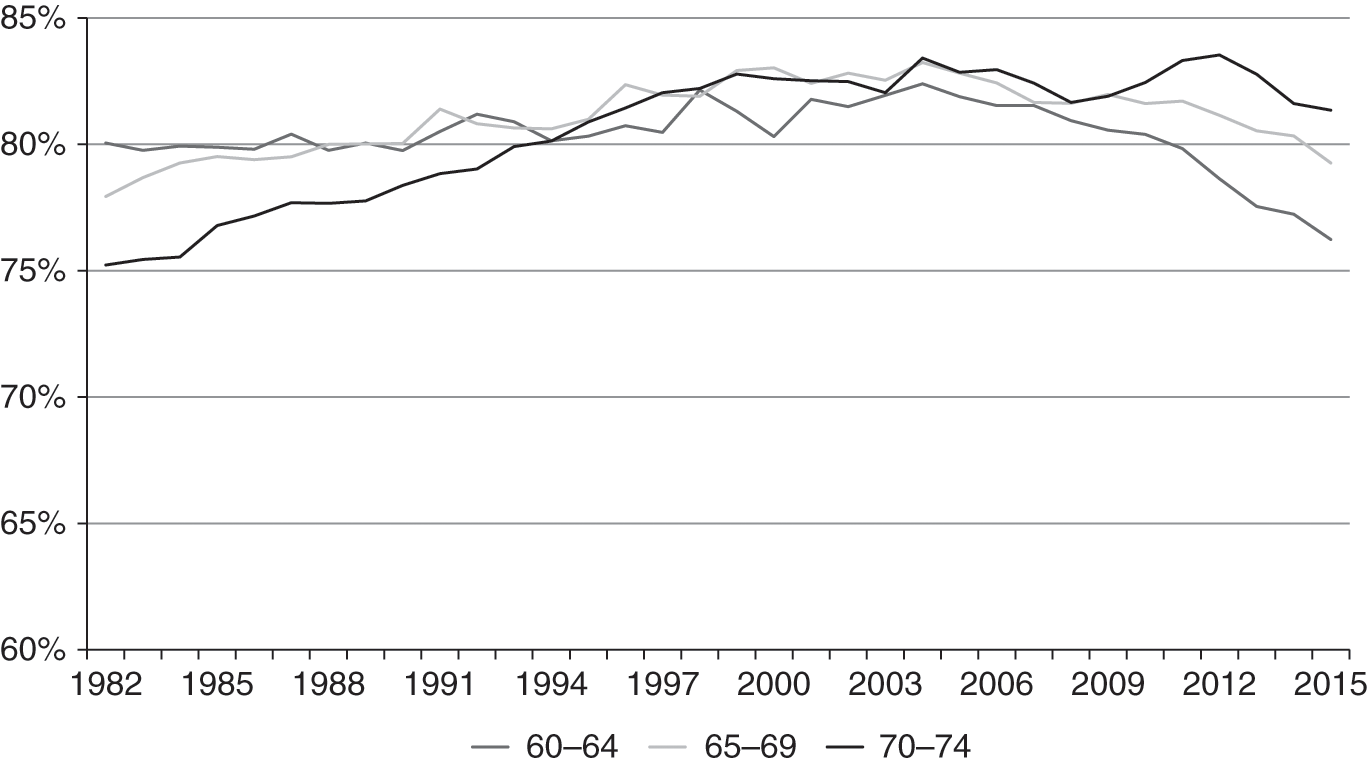
Figure 9.3 Homeownership Rate for Elderly Households, 60–74 Years Old
Homeowners appear more prepared for retirement than renters in almost every way. Census data show that median net worth including home equity is considerably larger than without (Figure 9.2) – almost $195,000 for households aged 65 to 69 in 2011. Poterba and colleagues (Reference Poterba, Venti and Wise2011) show that housing and real estate wealth exceeds the total of financial assets and personal retirement accounts for households of the same age. Even more striking, the authors show that real estate represents almost 80 percent of the present value of Social Security income.
In what follows, I examine the growth in mortgage debt and home equity for the elderly using the Survey of Consumer Finances (SCF) and consider how retirees are able to manage debt and utilize home equity in retirement with data from the Health and Retirement Survey (HRS). Previous academic research often examines home equity as a share of net worth without considering the amount of mortgage debt.8 Indebtedness is important to consider in its own right given the way many households now pay for their costs in retirement, predominantly financing expenditures from cash flow rather than spending down their stock of assets. As Poterba and colleagues (Reference Poterba, Venti and Wise2011) point out, the typical household appears to treat home equity and non-annuitized wealth like precautionary savings, which they spend only very late in life.
The data show a striking increase in mortgage debt at or near retirement age since 1992. For example, about 40 percent of households age 66–71 have a mortgage in 2013, up from 25 percent two decades earlier. At the same time, the average amount of mortgage debt (in 2013$) has almost tripled from less than $20,000 to more than $55,000. By contrast, real home equity in 2013 is at about the same level as it was almost 15 years earlier for most older homeowners. These data make clear that the growth of housing debt in the boom prior to the Great Recession remains on the balance sheets of many older households today.
Next I consider the evolution of mortgage debt versus financial assets over time. Debt is not necessarily a problem if homeowners have more assets to pay back the debt. Unfortunately, not only has debt increased as a share of home values, it has also increased relative to financial assets. About 40 percent of homeowners with a mortgage aged 65–69 had more mortgage debt than the sum total of all of their financial assets in 2012, up from about 28 percent in 1992.
Having established the growth in housing debt, I examine data from previous cohorts of older homeowners to examine how these households have historically managed mortgage debt and spent down home equity and financial assets over time. This analysis builds on a pair of papers by Poterba and colleagues (Reference Poterba, Venti, Wise and Wise2012, Reference Poterba, Venti and Wise2015) that examine the net worth of the elderly in the year just prior to death as well as examining the evolution of assets from retirement age to just before death.9
The evidence shows that few homeowners spend down home equity until very late in life. For a sample of borrowers first observed at age 53–63 in 1994 and who die within 18 years, the share without home equity increased slightly from 31 percent to 34 percent. For elderly first observed over age 70 in 1992 and who die within 15 years, the share without home equity doubled from 22 percent to 44 percent.10 Even for the oldest households in the sample, however, the majority own a home in the year prior to death.
Next I examine the link between home equity and financial assets. Poterba and colleagues (Reference Poterba, Venti and Wise2015) show that for households entering retirement with assets, most of those assets remain unspent unless the household has a disruption in family composition or a member with an important medical event. I expand on their analysis by separating assets into home equity and financial assets. The results show that most older households only spend down home equity in the years just prior to death when they enter assisted living. By contrast, households spend down 30 percent to 40 percent of financial assets. Homeowners with larger amounts of financial assets are slightly less likely to reduce home equity, potentially because they have the resources to age in place in their home rather than selling the home and moving to assisted living.
Putting these results together, my findings suggest that the prognosis for financial stability in retirement is getting worse because more households are entering retirement age with greater amounts of debt. This trend is likely to continue as younger cohorts are nearing retirement age with more debt than previous cohorts, whether measured in real dollars or as a share of home value (loan-to-value ratios are also rising). While many elderly have large amounts of home equity (which often exceeds other financial assets, including retirement accounts), most do not use that home equity to fund retirement.
This chapter has two empirical sections. The first examines the Survey of Consumer Finances to determine changes in household balance sheets and borrowing when heading into retirement. The second examines data from the Health and Retirement Survey to study how households spend down home equity and financial assets. This chapter concludes with ideas about a future policy and research agenda.
Housing Debt in Retirement
To begin, I examine data from the Survey of Consumer Finances to track homeownership and borrowing by families at or near retirement age. The analysis is conducted by age as well as by following cohorts of borrowers in six-year age intervals from 1992 to 2013. The six-year age intervals were designed to allow the reader to compare housing behavior of some cohorts.
Data Description
The Survey of Consumer Finances (SCF) is sponsored by the Federal Reserve Board in cooperation with the Department of Treasury. It is a cross-sectional survey of families in the United States that has taken place every three years since 1983. I start with the 1992 survey, which was the first date that the SCF was built to provide a nationally representative sample, using waves in 1992, 1995, 1998, 2001, 2004, 2007, 2010, and the latest published wave in 2013. The survey collects information on assets, liabilities, pensions, income, and demographics. About 6,500 families participate in each wave of the survey, which means that it can be difficult to separate into smaller groups of elderly without some sampling error. The yearly survey data were downloaded directly from the Federal Reserve website. Dollar-denominated variables are reported in 2013($) to allow comparisons across years. The primary variables used are X14 (age), X805 (balance still owed on first mortgage), X808 (mortgage payment), X701 (homeownership), X809 (payment frequency), X5729 (income), and X507 (value of primary residence). Sample weights (X4200) were applied throughout the data.
The term “family” is defined in the SCF by examining a household unit and dividing into a primary economic unit (PEU) – the family – and everyone else in the household (Board of Governors of the Federal Reserve System 2014). The PEU is intended to be the economically dominant single person or couple (whether married or living together as partners) and all other persons in the household who are financially interdependent with that economically dominant person or couple. In this regard, the definition of families in the SCF is more comparable to the definition of households in other government surveys.
The data are analyzed in four six-year age groups beginning in 1992 and based on the age of the head of the family: 54–59, 60–65, 66–71, and 72–77-year-olds. The cohorts were then aged every six years, the same intervals that align with years that cohorts are observed in the SCF. While the SCF takes place every three years, the data are aggregated into six-year age intervals to ensure a large enough sample for appropriate inferences. In the last year of study, the oldest cohort went from being 42–47 in 1992 to 72–77 years in 2013.
Analysis
To start, I examine changes in housing debt, homeownership, and home equity by age. Table 9.1 reports the share of families without a mortgage in the various age groups. Families with a mortgage in retirement may be at greater risk of losing their homes without working or obtaining additional income above and beyond Social Security.
Table 9.1: Percent of Households with No Mortgage by Age
| 1992 | 1995 | 1998 | 2001 | 2004 | 2007 | 2010 | 2013 | |
|---|---|---|---|---|---|---|---|---|
| 54–59 | 41% | 42% | 42% | 42% | 41% | 35% | 37% | 39% |
| 60–65 | 56% | 53% | 55% | 57% | 54% | 47% | 46% | 48% |
| 66–71 | 75% | 72% | 70% | 68% | 69% | 61% | 59% | 59% |
| 72–77 | 90% | 82% | 83% | 83% | 80% | 76% | 67% | 70% |
The data show a consistent downward trend in the share of homeowners with a paid-off home entering retirement age. For families whose head was over age 65 (in this case, age 66–71), the share without a mortgage fell from a high of 75 percent in 1992 to 69 percent in 2004, just prior to the financial crisis. By 2007, the percentage without a mortgage had fallen to 61 percent and remained around 59 percent in 2010 and 2013. Families with a head aged 72–77 years old exhibit a similar large decline in the share of borrowers without mortgages. Older borrowers appear to have strongly contributed to the growth in borrowing during the mid-2000s. By contrast, the share of borrowers aged 54 to 59 without a mortgage has remained relatively stable at between 35 percent and 42 percent. Thus the increase in debt appears to be a result of borrowers not paying off their mortgage as they approach and enter retirement age.
One possible explanation for the decline in the share of families with fully paid-off mortgages is that the homeownership rate was rising for older families during this same time period. As a result, some families who might have been renters in previous years became homeowners. Although these “new” homeowners may not have fully paid off their mortgage, they might have accumulated enough home equity to make retirement more financially stable than if they had not owned a home at all. Table 9.2, in fact, documents that the homeownership rate was rising over this time period for families whose head is age 66 and above.11
Table 9.2: Homeownership Rate by Age
| 1992 | 1995 | 1998 | 2001 | 2004 | 2007 | 2010 | 2013 | |
|---|---|---|---|---|---|---|---|---|
| 54–59 | 76% | 83% | 77% | 77% | 80% | 79% | 70% | 69% |
| 60–65 | 76% | 79% | 78% | 79% | 77% | 81% | 76% | 74% |
| 66–71 | 74% | 76% | 76% | 75% | 78% | 78% | 78% | 79% |
| 72–77 | 75% | 78% | 75% | 76% | 78% | 74% | 75% | 77% |
One way to address this issue is to examine the share of families with some housing payment.12 In this case, a homeowner with a mortgage might be treated similarly to a renter, at least from the perspective that both groups may require additional income relative to a homeowner with a fully paid-off mortgage. In fact, data from the Joint Center for Housing Studies of Harvard (2014) documents that about 30 percent of elderly households with a mortgage pay more than one-half of their income in housing expenses, a similar share as elderly renters. Thus mortgage payments could present an appreciable burden on elderly retirees just as rental payments might.
The data in Table 9.3 show that after 2007, a sharply higher share of families whose head is over the age of 65 fall into the category of owners with mortgage payment or renters. While in 2004, 47 percent of those aged 66 to 71 had some housing payment, by 2010 that number had risen to 54 percent. For the oldest families (with a head aged 72 to 77), the share rose from 38 percent to 50 percent. While the data in 2013 show a small decline in the share of elderly with a mortgage, the overall pattern documents that housing payments have become much more common among retirement-age families after the financial crisis.
Table 9.3: Percent with Housing Payments by Age
| 1992 | 1995 | 1998 | 2001 | 2004 | 2007 | 2010 | 2013 | |
|---|---|---|---|---|---|---|---|---|
| 54–59 | 69% | 65% | 67% | 67% | 67% | 72% | 74% | 73% |
| 60–65 | 57% | 58% | 57% | 55% | 58% | 62% | 65% | 64% |
| 66–71 | 44% | 45% | 47% | 49% | 47% | 52% | 54% | 53% |
| 72–77 | 33% | 36% | 38% | 37% | 38% | 44% | 50% | 45% |
Next, I examine the amount of mortgage debt held by families in this age group who own a home. Table 9.4 shows the average mortgage debt by age for homeowners with a mortgage and documents an appreciable rise over time in the amount of mortgage debt held by older borrowers.
Table 9.4: Real Mortgage Amount (2013$) by Age among Homeowners with a Mortgage
| 1992 | 1995 | 1998 | 2001 | 2004 | 2007 | 2010 | 2013 | |
|---|---|---|---|---|---|---|---|---|
| 54–59 | $ 32,610 | $ 39,559 | $ 44,860 | $ 52,574 | $ 62,471 | $ 68,561 | $ 67,174 | $ 69,954 |
| 60–65 | $ 23,118 | $ 28,023 | $ 43,512 | $ 47,562 | $ 63,578 | $ 69,082 | $ 69,099 | $ 71,418 |
| 66–71 | $ 18,304 | $ 23,342 | $ 31,997 | $ 40,180 | $ 43,219 | $ 66,052 | $ 54,790 | $ 54,828 |
| 72–77 | $ 16,419 | $ 23,359 | $ 34,113 | $ 34,662 | $ 47,338 | $ 36,677 | $ 46,892 | $ 40,360 |
Overall real mortgage debt among 66–71-year-olds increased from about $18,000 in 1992 (in 2013 dollars) to about $55,000 in 2010 and 2013. This is a sharp growth in borrowing for an age group that is at or near retirement. At first glance, it is surprising that the amount of borrowing grew throughout the 1990s and early 2000s, in seeming contradiction of the Greenspan and Kennedy (Reference Greenspan and Kennedy2005) result showing a much sharper increase in mortgage borrowing in the early 2000s than the 1990s. However, the data on the share of homeowners with a mortgage can reconcile this seeming contradiction. Table 9.3 shows that the share of families without a mortgage fell from 2001 to 2007. This suggests that the mortgage excesses of the 2000s resulted in increases in mortgage debt on both the intensive and extensive margins; not only did borrowers take on more housing debt, but a larger share of older borrowers had a mortgage than in previous years.
Of course, families may have seen an increase in home values that offset the larger overall borrowing amounts. Table 9.5 reports loan-to-value (LTV) ratios for the same age groups, once again conditioned on having an outstanding mortgage.13 While mortgage debt grew steadily prior to 2007, the overall LTVs for these age groups only increased slightly between 1998 and 2007. This suggests that the typical family increased its borrowing roughly in proportion with the overall rise in home prices. However, after the housing crash, LTVs exhibited a large increase. By 2013, the typical older borrower over age 65 had an LTV of almost 50 percent, up more than 10 percentage points from 1998. The data suggest that mortgage debt for older families increased when home values rose, but that borrowers did not decrease their mortgage debt when prices fell.
Table 9.5: Mean Loan-to-Value (LTV) Ratio among Homeowners with a Mortgage
| 1992 | 1995 | 1998 | 2001 | 2004 | 2007 | 2010 | 2013 | |
|---|---|---|---|---|---|---|---|---|
| 54–59 | 32% | 40% | 43% | 43% | 43% | 42% | 56% | 59% |
| 60–65 | 29% | 36% | 37% | 43% | 39% | 40% | 52% | 58% |
| 66–71 | 22% | 33% | 34% | 36% | 38% | 41% | 50% | 48% |
| 72–77 | 17% | 32% | 37% | 37% | 43% | 40% | 41% | 49% |
While the SCF data from 2016 are not yet available, it is possible that the trend of increasing LTVs might reverse itself. Between 2013 and 2016, home values have risen about 20 percent according to the Case and Shiller National Home Value Index.14 Thus LTVs today would be close to their historical average of 40 percent as long as mortgage balances have not gone up for elderly borrowers, which would be consistent with data showing the overall size of mortgage borrowing has been flat over this time period.15
Finally, I examine overall home equity. Table 9.6 reports home equity in real 2013 dollars for all families who own a home. Not surprisingly, given the data on LTVs, home equity has been relatively stable around $100,000 since the early 2000s for families aged 66–71, with the exception of a large increase in 2007 followed by a decline in 2010.16 This is consistent with studies finding that owners have large amounts of home equity, even those older homeowners with a mortgage.
Table 9.6: Home Equity (Real 2013$) among All Homeowners
| 1992 | 1995 | 1998 | 2001 | 2004 | 2007 | 2010 | 2013 | |
|---|---|---|---|---|---|---|---|---|
| 54–59 | $ 101,904 | $ 98,258 | $ 104,718 | $ 123,660 | $ 145,815 | $ 162,934 | $ 120,013 | $ 119,124 |
| 60–65 | $ 80,939 | $ 77,683 | $ 117,603 | $ 109,922 | $ 163,279 | $ 170,605 | $ 133,546 | $ 122,818 |
| 66–71 | $ 83,006 | $ 70,088 | $ 94,357 | $ 110,136 | $ 114,036 | $ 162,783 | $ 109,641 | $ 114,094 |
| 72–77 | $ 97,417 | $ 73,644 | $ 92,530 | $ 93,666 | $ 110,457 | $ 92,719 | $ 114,158 | $ 82,193 |
The data from this section show that a growing number of families are entering retirement age with mortgage debt that will not be paid off for many years to come. The increasing amounts of mortgage debt will likely challenge retirement stability for some homeowners.
Spending Home Equity and Financial Assets in Retirement
Next, I turn to the questions of how mortgage debt has evolved relative to assets for older homeowners, as well as how these homeowners spend down their assets in retirement. Here, this chapter uses information in the Health and Retirement Survey (HRS), following closely the analysis in Poterba and colleagues (Reference Poterba, Venti and Wise2015). These authors take advantage of the panel feature of the HRS to identify assets in the last wave prior to death and compare them to assets that the same household had when it first entered the HRS up to 20 years earlier. The point of the analysis is to understand how households spend down assets, including both housing and other financial assets in typical retirement years. An important advantage of the HRS for this analysis is the opportunity to observe a large sample of respondents in the very late stages of life.
Data Description
The University of Michigan Health and Retirement Study is a nationally representative survey of Americans over the age of 50. The survey has interviewed a sample of approximately 20,000 individuals every two years since its inception in 1992. Eleven waves of the study are included in this dataset.
Two of the six age cohorts of the HRS are included in our dataset. They are the base HRS cohort and the AHEAD cohort. The HRS cohort includes individuals born from 1931 to 1941 and are ages 51 to 61 in 1992. The AHEAD cohort began as part of a different study (The Study of Assets and Health Dynamics among the Oldest Old) in 1993 and includes individuals born before 1924. The AHEAD cohort was interviewed once more in 1995 before being added to the general HRS interview for the 1998 study. For the purposes of this study, the 1993 AHEAD cohort responses are added to the 1994 HRS study responses (wave 2) and the 1995 AHEAD cohort responses are added to the 1996 HRS study responses (wave 3). I drop the first wave of the HRS (1992 sample) due to data problems, so the sample begins with wave 2. The data file used is the RAND HRS Data (Version O) file. The RAND HRS Data file is a cleaned version with derived variables of all the core interviews of all waves of the HRS. All data are listed under the respondent level, but wealth variables are collected on the household level and can be identified through a household ID (HHID).
As I am predominantly interested in assets at end of life, responses for this study are limited only to respondents who died during the survey time period (after 1993 and prior to 2012). The data choices that follow closely track those in Poterba and colleagues (Reference Poterba, Venti and Wise2015). Respondents with spouses who are not eligible for the HRS due to their age, and any respondents who left for reasons other than death are also dropped. When looking at the change in assets up to the year prior to death, the analysis is limited to respondents who joined the study at the beginning (i.e., 1994 for HRS and 1993 for AHEAD). This includes the majority of respondents from these years (wave 2). Variables indicating which survey year the respondent enters the survey (FYO – First Year Observed) and when the respondent last fully completes the survey (LYO – Last Year Observed) are created. The LYO variable can range from only a few months to two years before the time the respondent dies. On average, given that the HRS is conducted every two years, the LYO is about a year before death. The HRS provides separate codes for respondents who exit the sample due to death versus attrition; I consider only those who died in determining LYO.
Wealth assets are computed in multiple categories and converted into 2012 dollars using the Consumer Price Index. Housing wealth comes from housing equity (home value net of mortgage debt). Other wealth is made up of non-housing real estate equity, vehicles, business, and second home equity minus other debt. Annuity wealth includes both the respondent’s and their spouse’s pension and Social Security wealth. Financial wealth is made up of IRA accounts, stocks, checking accounts, CDs, bonds, and other financial assets.
Health variables for specific conditions are dummies that indicate whether a condition appears from the FYO to the LYO. The general health variable is a percentile index created as described in Poterba and colleagues (Reference Poterba, Venti and Wise2013) with a range from one to 100, with one being the lowest. For all health conditions and dummies, the value is made positive if either the respondent or their spouse reports the issue. This way, the respondent-level health data more closely resemble the household-level wealth data.
Education variables are constructed by years of education. Family pathway variables are constructed using the marriage status variable. The family pathways indicate whether the respondent stays single, stays married, or goes from married to single. There were too few responses for single to married to be included in the study.
Analysis
To start, I examine additional metrics describing the ability of borrowers to retire their mortgage. Figure 9.4 uses all waves of the HRS starting in 1998 along with sample weights to compare the amount of mortgage debt relative to financial assets. The goal is to determine whether households have enough financial assets to pay off their mortgages if they chose to do so. In 1998, only 25 percent of those with a mortgage had a larger mortgage balance than financial assets. In other words, about three-quarters of mortgage borrowers could retire their mortgage if they chose to do so.17 However, the share unable to retire their mortgage has been steadily increasing, up to 40 percent in 2012.
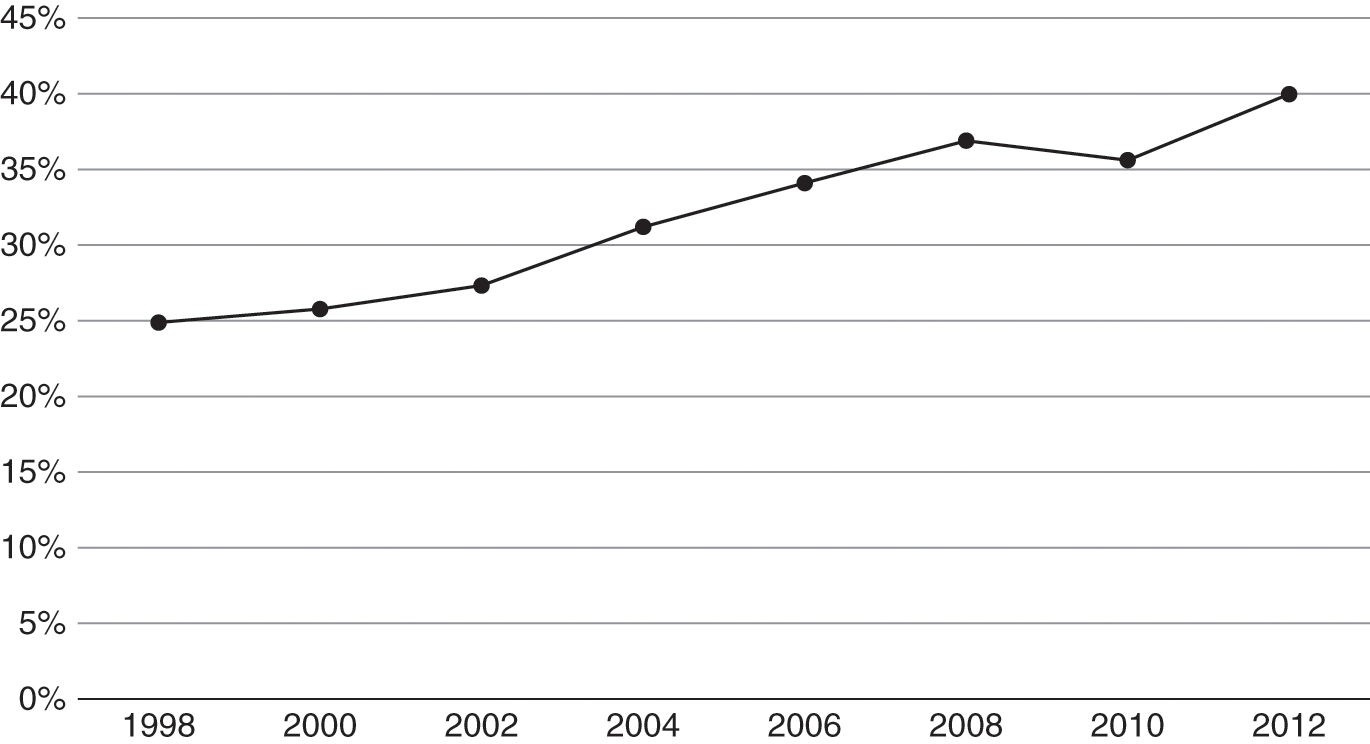
Figure 9.4 Percent of Homeowners with a Mortgage Aged 60–69 with More Mortgage Debt than Financial Assets
Another way to consider the burden associated with carrying a mortgage is to examine the extent to which borrowers who start with a mortgage end up paying it off before passing away. To do this, Table 9.7 reports data on mortgage amounts for all households in first and last year observed for the AHEAD and HRS samples. The data suggest that the bulk of borrowers who start retirement age with a mortgage do not fully pay it off by the time of their death. Among the younger HRS borrowers who enter the sample at ages 53 to 63 in 1994, the share with a mortgage increases from 62.5 percent to 71.8 percent. In other words, of the 37.5 percent with a mortgage, only about one-quarter of households (9.3 percent) pay off their mortgage up to the year prior to death. Not surprisingly, the bulk of those that pay off the mortgage appear to be borrowers with mortgage debt under $50,000 in 1994. In the AHEAD group of borrowers entering the sample at age 70 and above, a much higher share of borrowers start the sample without debt (89 percent) and more than 40 percent of the remainder pay off their mortgage prior to death. In both cohorts, however, most borrowers who enter retirement age with a mortgage will have at least some mortgage payments up to the year prior to passing away.
Table 9.7: Mortgage Debt
| HRS | AHEAD | |||
|---|---|---|---|---|
| First Year Observed | Last Year Prior to Death | First Year Observed | Last Year Prior to Death | |
| < = 0 | 62.5% | 71.8% | 89.0% | 93.4% |
| $1–$50k | 19.7% | 11.3% | 2.4% | 1.2% |
| $50,001–$100k | 8.7% | 9.0% | 5.1% | 2.7% |
| $100,001–$250k | 7.8% | 6.8% | 2.2% | 1.5% |
| $250,001–$500k | 1.2% | 1.1% | 1.2% | 1.1% |
| > 500k | 0.1% | 0.0% | 0.1% | 0.2% |
| Total | 100.0% | 100.0% | 100.0% | 100.0% |
HRS Sample: Respondents age 51–61 in 1992 who died prior to 2012
AHEAD Sample: Respondents age 70+ in 1993 who died prior to 2012
Next, I examine the amount of home equity and compare it to financial assets. The goal is to examine whether the type of asset is related to the likelihood that a household liquidates the asset over time to help fund retirement. Tables 9.8 and 9.9 compare the distribution of home equity and financial assets for those in the HRS sample (age 53–63 in 1994) and the AHEAD sample (over age 70 in 1993).
Home Equity vs. Financial Assets, AHEAD Sample (respondents aged 70+ in 1993 who died prior to 2012).
Panel 1. Responses in 1993
| Total Financial Assets | |||||||||
|---|---|---|---|---|---|---|---|---|---|
| < = 0 | $1–$10k | $10,001–$50k | $50,001–$100k | $100,001–$250k | $250,001–$500k | >500k | Total Financial | ||
| < = 0 | 6.2% | 5.0% | 6.1% | 1.5% | 1.9% | 0.9% | 0.6% | 22.2% | |
| $1–$10k | 0.5% | 0.4% | 0.9% | 0.0% | 0.1% | 0.0% | 0.0% | 1.9% | |
| Total | $10,001–$50k | 2.4% | 2.2% | 4.5% | 1.2% | 1.3% | 0.6% | 0.2% | 12.4% |
| Home | $50,001–$100k | 2.2% | 2.1% | 7.5% | 3.2% | 4.2% | 2.6% | 1.2% | 23.0% |
| Equity | $100,001–$250k | 1.9% | 1.9% | 5.6% | 4.8% | 8.1% | 5.0% | 4.2% | 31.5% |
| $250,001–$500k | 0.2% | 0.2% | 0.8% | 0.9% | 2.0% | 1.2% | 1.9% | 7.2% | |
| > 500k | 0.0% | 0.0% | 0.5% | 0.0% | 0.1% | 0.2% | 1.1% | 1.9% | |
| Total Home | 13.4% | 11.8% | 25.9% | 11.6% | 17.7% | 10.5% | 9.2% | 100.0% | |
Note: All data reported in $2012; N = 5,581
22.9 percent of respondents have less than 50k in financial wealth and more than 50k in home equity
8.3 percent of respondents have less than 50k in home equity and more than 50k in financial assets
Panel 2. Responses in Last Year in Sample Prior to Death
| Total Financial Assets | |||||||||
|---|---|---|---|---|---|---|---|---|---|
| < = 0 | $1–$10k | $10,001–$50k | $50,001–$100k | $100,001–$250k | $250,001–$500k | >500k | Total Financial | ||
| < = 0 | 12.7% | 10.8% | 8.4% | 3.2% | 4.1% | 2.2% | 2.3% | 43.7% | |
| $1–$10k | 0.4% | 0.4% | 0.5% | 0.1% | 0.1% | 0.0% | 0.0% | 1.5% | |
| Total | $10,001–$50k | 1.9% | 2.1% | 3.2% | 1.1% | 0.9% | 0.4% | 0.4% | 10.0% |
| Home | $50,001–$100k | 1.7% | 2.6% | 4.5% | 2.3% | 2.8% | 1.4% | 1.3% | 16.6% |
| Equity | $100,001–$250k | 1.0% | 1.6% | 4.0% | 2.9% | 5.0% | 3.2% | 3.3% | 21.0% |
| $250,001–$500k | 0.2% | 0.4% | 0.6% | 0.8% | 1.1% | 0.8% | 1.7% | 5.6% | |
| > 500k | 0.0% | 0.1% | 0.1% | 0.1% | 0.2% | 0.2% | 1.2% | 1.9% | |
| Total Home | 17.9% | 18.0% | 21.3% | 10.5% | 14.2% | 8.2% | 10.2% | 100.0% | |
Note: All data reported in $2012; N = 5,581
16.80 percent of respondents have less than 50k in financial wealth and more than 50k in home equity
14.80 percent of respondents have less than 50k in home equity and more than 50k in financial assets
Home Equity vs. Financial Assets, HRS Sample (respondents aged 53–63 in 1994 who died prior to 2012).
Panel 1. Responses in 1994
| Total Financial Assets | |||||||||
|---|---|---|---|---|---|---|---|---|---|
| < = 0 | $1–$10k | $10,001–$50k | $50,001–$100k | $100,001–$250k | $250,001–$500k | >500k | Total Financial | ||
| < = 0 | 15.2% | 6.5% | 4.9% | 1.0% | 1.7% | 1.0% | 0.4% | 30.7% | |
| $1–$10k | 1.3% | 0.7% | 0.7% | 0.2% | 0.2% | 0.0% | 0.0% | 3.1% | |
| Total | $10,001–$50k | 4.7% | 3.9% | 4.8% | 1.9% | 1.9% | 0.6% | 0.4% | 18.2% |
| Home | $50,001–$100k | 3.7% | 3.5% | 5.7% | 2.8% | 3.1% | 1.3% | 0.7% | 20.8% |
| Equity | $100,001–$250k | 1.3% | 1.5% | 3.4% | 2.6% | 6.0% | 3.6% | 3.5% | 21.9% |
| $250,001–$500k | 0.1% | 0.1% | 0.3% | 0.6% | 1.2% | 0.9% | 1.2% | 4.4% | |
| > 500k | 0.0% | 0.0% | 0.0% | 0.0% | 0.0% | 0.0% | 0.7% | 0.7% | |
| Total Home | 26.3% | 16.2% | 19.8% | 9.1% | 14.1% | 7.4% | 6.9% | 100.0% | |
Note: All data reported in $2012
N = 2,154
19.6 percent of respondents have less than 50k in financial wealth and more than 50k in home equity
9.3 percent of respondents have less than 50k in home equity and more than 50k in financial assets
Panel 2. Responses in Last Year in Sample Prior to Death
| Total Financial Assets | |||||||||
|---|---|---|---|---|---|---|---|---|---|
| < = 0 | $1–$10k | $10,001–$50k | $50,001–$100k | $100,001–$250k | $250,001–$500k | > 500k | Total Financial | ||
| < = 0 | 15.5% | 8.3% | 6.0% | 1.1% | 1.6% | 0.6% | 0.5% | 33.6% | |
| $1–$10k | 0.6% | 0.6% | 0.8% | 0.0% | 0.1% | 0.0% | 0.0% | 2.1% | |
| Total | $10,001–$50k | 4.1% | 3.0% | 4.7% | 1.5% | 1.4% | 0.8% | 0.2% | 15.7% |
| Home | $50,001–$100k | 2.6% | 2.1% | 5.2% | 2.7% | 3.0% | 1.1% | 0.7% | 17.4% |
| Equity | $100,001–$250k | 1.5% | 1.6% | 3.9% | 3.2% | 4.6% | 2.8% | 3.8% | 21.4% |
| $250,001–$500k | 0.3% | 0.1% | 0.8% | 1.0% | 1.4% | 1.3% | 2.2% | 7.1% | |
| > 500k | 0.0% | 0.0% | 0.1% | 0.1% | 0.4% | 0.0% | 1.8% | 2.4% | |
| Total Home | 24.6% | 15.7% | 21.5% | 9.6% | 12.5% | 6.6% | 9.2% | 100.0% | |
Note: All data reported in $2012; N= 2,154
18.20 percent of respondents have less than 50k in financial wealth and more than 50k in home equity
7.80 percent of respondents have less than 50k in home equity and more than 50k in financial assets
First consider the older AHEAD respondents. Panel 1 in Table 9.8 shows that households over age 70 in 1993 held significant amounts of home equity; on average 48 percent had more than $100,000 ($2012) and another 23 percent had more than $50,000.18 In fact, housing wealth represents the bulk of wealth for households. Almost 23 percent of respondents had more than $50,000 in home equity and less than $50,000 in financial assets, whereas only 8.3 percent had the opposite – more than $50,000 in financial assets and less than $50,000 in home equity. Alternatively, about 44 percent of respondents had home equity that was at least one category higher than financial assets, whereas 39 percent had at least one more category of financial assets. At the top end of the wealth distribution, there is an appreciable proportion of households (17 percent) that have more than $250,000 in financial assets, but less in home equity. Thus for the elderly with high net worth, housing is less important as a share of total assets, whereas at the lower end of the wealth distribution, home equity is much more important.
Of particular interest with the HRS (and AHEAD sample) is the ability to look at respondents just prior to death at much older ages than would be possible with other data. Panel 2 in Table 9.8 shows the same comparison of home equity and financial assets in the last wave observed prior to death.
One striking feature is the sharp increase in households who appear to have liquidated their home and own no home equity. More than 43 percent of respondents report having no home equity versus 22 percent in the first year surveyed (1993) from Panel 1. As well, another 15 percent of respondents report having less than $50,000 in home equity and more than $50,000 in financial assets. Overall, almost one-half now report having at least one more bucket of financial assets relative to home equity (26.5 percent have at least one category more of home equity).
It is also striking just how many respondents hit the last stage of their life having completely exhausted their financial assets (a point first made by Poterba et al. Reference Poterba, Venti, Wise and Wise2012). Almost 36 percent have less than $10,000 in financial assets and another 21 percent have less than $50,000 in financial assets. Two-thirds of those with less than $10,000 of financial assets (23.5 percent) also have no home equity. These households are ill-prepared to fund unreimbursed medical expenses and other costs. Many of these elderly will end up on Medicaid in addition to Medicare, with the government funding all of the costs associated with the last stages of their lives.19
Table 9.9 repeats this same analysis using younger households in the HRS sample (age 53–63 in 1994). The HRS respondents appear to head into retirement age in similar circumstances as AHEAD households (Panel 1). The younger HRS respondents with low net worth still hold portfolios disproportionately concentrated in home equity, whereas the respondents with higher net worth have a more balanced portfolio. Almost 20 percent have more than $50,000 ($2012) in home equity and less than $50,000 in financial assets, whereas only 9 percent have the reverse situation. However, unlike their older AHEAD counterparts, few HRS respondents have liquidated their housing equity in the year prior to death. In their last year observed, about two-thirds still own their home. About 18 percent have more than $50,000 ($2012) in home equity and less than $50,000 in financial assets, versus less than 8 percent in the reverse situation. And nearly 32 percent have at least one category more in home equity than financial assets as in Table 9.9. The comparison with the AHEAD cohort seems to suggest that households do not spend down home equity until they reach much older ages. The oldest respondents in the HRS sample would have died by age 81, whereas the AHEAD cohort has been observed into much older ages.20
To better understand how households spend housing and financial wealth as they age, I examine the determinants of assets in the last year observed as a function of assets when households are first surveyed plus demographic and health controls. The regressions in Table 9.10 follow the same format and include the same control variables as in Poterba and colleagues (Reference Poterba, Venti and Wise2015), tables 3.1 and 3.2.21 However, I make two adjustments. First, the regressions address skewness in observed wealth data by removing the top and bottom 3 percent of the dependent variable. Trimming the data results in more consistent estimates in the following regressions, although the overall findings are little changed. Second, I decompose assets in the form of home equity and financial wealth. The goal is to determine whether the type of asset has an impact on the likelihood that a household liquidates that asset to pay for expenses in retirement. Given that home equity is much less liquid than financial assets, it would not be surprising that households spend down these assets at different rates.22
Determinants of Assets in Last Year Observed, HRS Sample (respondents aged 53–63 in 1994 who died prior to 2012); AHEAD Sample (respondents aged 70+ in 1993 who died prior to 2012)
Panel 1. Regression of Net Worth in Last Year Observed
| Dependent Variable: Net Worth – Last Year Observed | ||||
|---|---|---|---|---|
| (1) HRS | (2) HRS | (3) AHEAD | (4) AHEAD | |
| Net Worth – First Year Observed | 1.078*** | 1.022*** | 1.058*** | 1.005*** |
| Health Controls | N | Y | N | Y |
| Demographics | N | Y | N | Y |
| Household Type Controls | N | Y | N | Y |
| Time between First/Last Observed | N | Y | N | Y |
| Constant | 37946.0*** | −35902.7 | 22452.0*** | −5994.8 |
| Number of Observations | 1414 | 1414 | 2526 | 2526 |
| R-Squared | 0.676 | 0.690 | 0.674 | 0.683 |
* p < 0.05, ** p < 0.01, *** p < 0.001
Panel 2. Regression of Home Equity in Last Year Observed, Separate Controls for Home Equity and Financial Assets
| Dependent Variable: Home Equity – Last Year Observed | ||||
|---|---|---|---|---|
| (1) HRS | (2) HRS | (3) AHEAD | (4) AHEAD | |
| Home Equity – First Year Observed | 0.69*** | 0.614*** | 0.81*** | 0.78*** |
| (29.30) | (25.16) | (53.58) | (50.49) | |
| Financial Assets – First Year Observed | 0.083*** | 0.077*** | 0.021*** | 0.016*** |
| (18.08) | (17.22) | (5.15) | (3.84) | |
| Health Controls | N | Y | N | Y |
| Demographics | N | Y | N | Y |
| Household Type Controls | N | Y | N | Y |
| Time between First/Last Observed | N | Y | N | Y |
| Constant | 27853*** | –25029.9** | 3022 | –1635 |
| Number of Observations | 1414 | 1414 | 2526 | 2526 |
| R-Squared | 0.578 | 0.617 | 0.575 | 0.592 |
* p < 0.05, ** p < 0.01, *** p < 0.001
Panel 3. Regression of Financial Assets in Last Year Observed, Separate Controls for Home Equity and Financial Assets
| Dependent Variable: Financial Assets – Last Year Observed | ||||
|---|---|---|---|---|
| (1) HRS | (2) HRS | (3) AHEAD | (4) AHEAD | |
| Home Equity – First Year Observed | 0.39*** | 0.31*** | 0.57*** | 0.53*** |
| (8.04) | (6.09) | (21.00) | (19.38) | |
| Financial Assets – First Year Observed | 0.77*** | 0.74*** | 0.64*** | 0.62*** |
| (37.97) | (35.04) | (47.71) | (43.81) | |
| Health Controls | N | Y | N | Y |
| Demographics | N | Y | N | Y |
| Household Type Controls | N | Y | N | Y |
| Time between First/Last Observed | N | Y | N | Y |
| Constant | 11632** | –47736.5** | –2830 | –51074.9*** |
| Number of Observations | 1414 | 1414 | 2526 | 2526 |
| R-Squared | 0.614 | 0.63 | 0.608 | 0.618 |
* p < 0.05, ** p < 0.01, *** p < 0.001
The results in the basic regression in Panel 1 of Table 9.10 are surprising at first blush – household assets in the last year observed are very similar to or slightly larger than assets in the first year observed. In other words, households do not appear to spend down assets, even by the year prior to death. These results remain whether looking at the younger HRS sample or the older AHEAD cohort, with coefficients on beginning of sample assets between 1.02 and 1.08. In Panel 1, and in the remaining two panels, the R-squared increases modestly with the inclusion of time between first and last year observed, as well as demographic, health, and household type variables. Many of these control variables are statistically significantly different from zero with the expected sign. However, the inclusion of these control variables does not change the interpretation of the regressions, although it slightly reduces the size and significance of the coefficient on beginning of sample asset balances.
The next two panels present separate regressions using a dependent variable for first year observed home equity (Panel 2) and financial assets (Panel 3). These results suggest it is important to examine the type of asset when considering changes in asset balances over time.
The home equity regressions show that respondents decrease home equity from the beginning of sample values, as we found in Tables 9.8 and 9.9, with coefficient estimates around 0.65 (HRS) and 0.8 (AHEAD). However, the extent to which the elderly reduce home equity does not appear to depend nearly as much on first-year observed financial assets, with coefficients of only 0.08 (HRS) to 0.02 (AHEAD). All of these coefficients are strongly statistically different than zero.
To better understand these findings, I examine where households live if they have no home equity in the year prior to life. More than two-thirds of borrowers with no home equity are living in a nursing home or assisted living in the last year observed. Thus, rather than selling the home to utilize the assets to support the costs of retirement, most people appear to sell their home as a result of a health care event. The fact that the coefficient on home equity prior to death is well below 1.0 seems to be predominantly a function of when or if a household moves into assisted living. In fact, most households remain homeowners throughout their lives and do not access their housing wealth prior to death. The fact that home equity is partly related to financial assets might be explained by wealthier households having resources to live longer at home.
By contrast, the last year observed financial assets in Panel 4 is highly correlated with the first year observed home equity, with coefficients of about 0.35 (HRS) to approximately 0.55 (AHEAD). This result appears consistent with those in Panel 2. After all, if most homeowners sell their home due to a medical event and move into assisted living, the remaining home equity would be converted into financial assets when the home is sold. This interpretation is consistent with the coefficient on home equity being larger for the AHEAD sample, as the oldest households are more likely to sell a home and move into assisted living.
The pattern of spending down beginning of period financial assets, by contrast, shows an opposite pattern with coefficients around 0.75 (HRS) and 0.6 (AHEAD). Again, it is not surprising that older households spend down financial assets more quickly than younger households. Younger households who die may do so unexpectedly early and thus be left with more assets, whereas older households may be more willing to spend down assets. Nonetheless, households have more than one-half of their first year observed assets in the year prior to death.
Decomposing asset types shows that the mix of assets is an important determinant of the extent to which a household spends assets later in life. While the initial regression that combines assets together suggests that there is little spend down of wealth by the elderly, separating the behavior of housing assets and financial assets gives a much more nuanced view. Households have a much greater propensity to spend financial assets, but not housing wealth.
Conclusion
The relationship between housing wealth, mortgages, and retirement readiness is taking on increasing importance as many more households enter retirement age without defined benefit retirement accounts and are thus reliant on assets to support their lifestyle. Home equity is the largest asset for the vast majority of retirement-age households. According to the U.S. Census, in 2011, median net worth including home equity for 65–69-year-olds was $194,000, whereas median net worth without home equity was only $44,000.
This chapter presents some new evidence to better understand the challenges facing near retirees. First, this chapter separately examines changes over time in the movement of mortgage debt, homeownership, and home equity. Often in previous research, the existence of growing mortgage debt is hidden in computations of home equity, which has remained roughly steady over the past 15 years, even as real home prices have risen. Second, I reexamine how households spend down assets up to the year prior to death, separately analyzing home equity and financial assets rather than combining them into a single measure of net worth.
For households with a head aged 66 to 71 and thus of traditional retirement age, the results suggest twin challenges – a large increase in mortgage debt at the same time that more households are paying a mortgage. Real mortgage debt ($2012) rose from $18,000 in 1992 to almost $55,000 in 2013 in this age group. At the same time, the share of households with a mortgage has risen from 25 percent to 41 percent. The combined effect is that more households face a larger debt burden. However, real home equity has remained roughly flat since 2001 at about $110,000, although it is up about $30,000 since 1992. Loan-to-value ratios are up from 22 percent to 48 percent. By any measure, older homeowners today are facing more financial challenges than in previous decades.
Historically, retiring without mortgage debt has been key to financial stability. Homeowners older than age 65 who are paying off a mortgage appear nearly as financially constrained as renters. The Joint Center for Housing Studies of Harvard (2014) reports that 30 percent of owners with a mortgage pay more than one-half of their income in housing costs, leaving few resources available to cover other basic expenses and health care. Similarly, about 30 percent of all older renters pay 50 percent of more of their income in housing expenses.23
A second question is whether homeowners can leverage existing home equity or financial assets to help cover their mortgage or other retirement expenses. Here I examine past behavior of elderly homeowners.
The data show, historically speaking, that most households entering retirement age with a mortgage do not fully retire the mortgage debt in retirement. In fact, only about 25 percent to 35 percent of older homeowners with a mortgage in 1992 had paid off their mortgage by the year prior to death. As well, the bulk of homeowners entering retirement age do not appear to spend down home equity, except when they move out of their home to enter assisted living. The elderly appear more willing to spend financial assets while living independently, although households have more than one-half of financial assets remaining in the year prior to death. Unfortunately, about 40 percent of all homeowners with a mortgage have more mortgage debt than financial assets.
In response to these challenges, many households report that they will work longer. The Federal Reserve 2015 Survey of Household Economics and Decisionmaking reports that more than one-half of respondents expect to either retire after age 65 or to never retire.24 The plan to work longer is a recent phenomenon and appears to be driven more by financial necessity than a longer life expectancy. The Employee Benefit Research Institute (Helman et al. Reference Helman, Copeland and VanDerhei2015) has been surveying individuals for 25 years about their retirement preparedness and expectations. The share of respondents stating that they expected to work after age 65 has grown from 11 percent in 1991 to 23 percent in 2000, to 46 percent by 2015.25 See Figure 9.5.
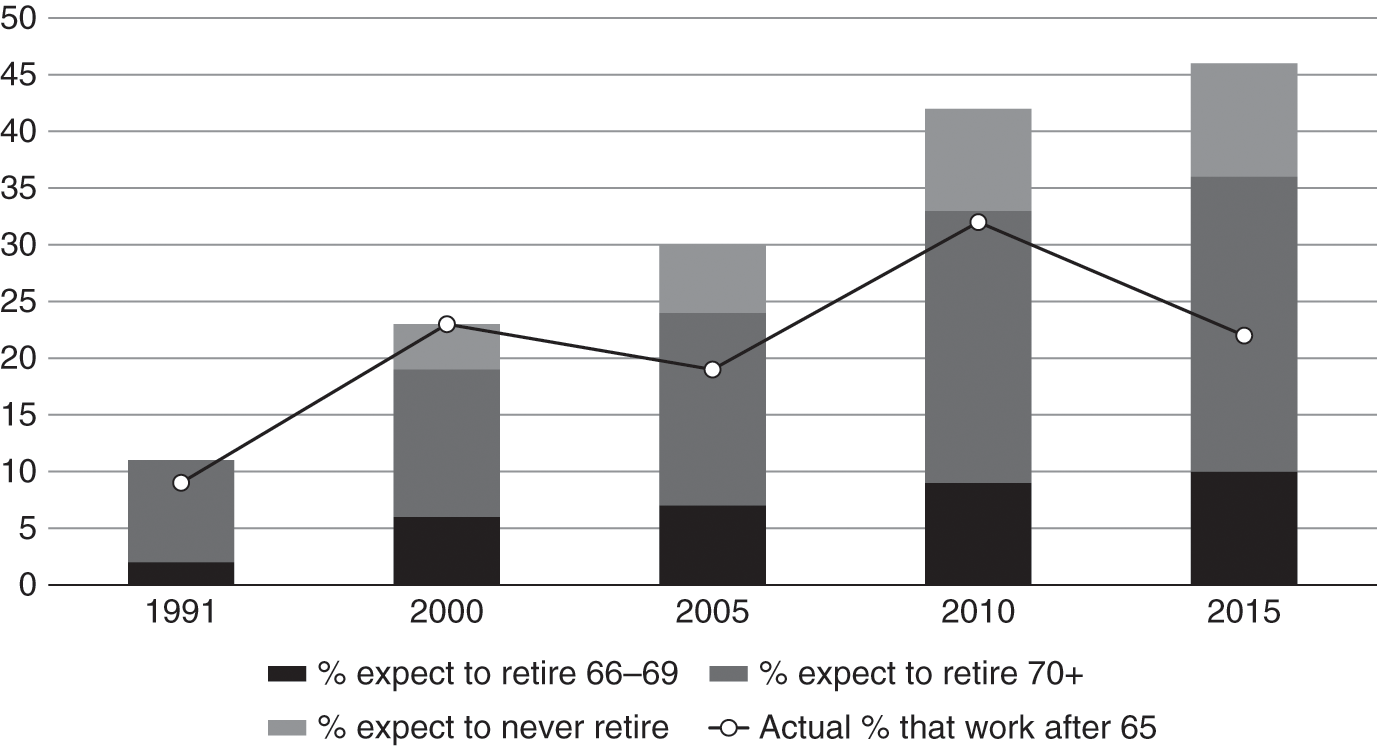
Figure 9.5 Late Retirement Expectations vs. Actual Retirement Age
Similarly, the EBRI data point out that borrowers who have debt or lack a retirement plan are much less confident in their ability to have enough money to fund retirement.
The problem with working longer, however, is that it may not be feasible for many of the elderly, either due to health problems or the inability to keep or obtain a job, especially for the middle-income or low-income households that this study shows have the largest increase in housing debt. In the EBRI survey, the share of people actually working after age 65 (22 percent) is about one-half as large as the share who say they intend to work after age 65 (46 percent).26 This is a striking change from 15 years ago, when worker expectations about working longer seemed to match the reality in the data. A recent Pew study27 showed that 19 percent of people aged 65 and above are working full- or part-time, up from 13 percent in 2000. This share of the elderly who are working has grown steadily, but the largest increases are in high-income professions like management, sales, and legal, whereas three of the four largest declines are in low-paid professions like food preparation, construction, and production.
Despite these apparent challenges, the elderly poverty rate remains near record lows, so many elderly are getting by with what they have. Of course, the traditional measurement of poverty does not consider asset or debt balances, and the measurement of health care expenses is difficult. Future research should examine the implications of growing debt in retirement and how households manage home equity. How are households paying this debt? Will poverty rates continue to grow? And how do these trends impact taxpayers? Are indebted households more likely to tap Medicaid to pay for at home or nursing home care?
Policy makers and business leaders have proposed a number of solutions to address these challenges. Some propose reform in the type of advice given to workers, the cost of delivering retirement products, and/or the creation of greater incentives for workers to save. Others suggest the development of new or more cost-effective financial products to tap home equity without selling the home28 or to annuitize existing savings. Nonetheless, the results in this chapter suggest something will need to change in order for many older Americans to have a more comfortable and satisfying retirement.
Author’s Note
The opinions, analysis, and conclusions of this chapter are those of the author. Monica Clodius provided excellent research assistance. This chapter benefited from the help of Jim Poterba and Steve Venti, who shared programs and insights from their previous analysis of the Health and Retirement Survey; Stephanie Moulton, who added helpful suggestions; and Luigi Zingales, who provided great thoughts as the discussant. The research was supported by the Paul Milstein Center for Real Estate at Columbia Business School. Christopher Mayer is CEO of Longbridge Financial, a start-up reverse mortgage lender. Any errors are those of the author.


 Open access