


The incidence rates of colorectal cancer (CRC) vary greatly across the world( 1 ), with high-income countries such as Norway having the highest incidence rates (Norway, age-standardised (world) incidence rate 2012: 35·8/100 000)( 1 ). Lifestyle factors such as eating habits are believed to influence the risk of CRC( Reference Aleksandrova, Pischon and Jenab 2 , 3 ). The World Cancer Research Fund International/American Institute for Cancer Research has reported that, based on current evidence, it is ‘probable’ that dairy products decrease the risk of CRC( 3 ). As milk consumption accounts for a large proportion of dairy product consumption in most countries, this finding for dairy products may, to a large extent, be driven by milk consumption( Reference Vieira, Abar and Chan 4 ). Milk intake has been found to be inversely associated with the risk of CRC when analysing both sexes combined in meta-analyses, but not when women have been studied alone( Reference Vieira, Abar and Chan 4 – 6 ). No association has been found in meta-analyses when investigating milk intake and the risk of colon cancer among women, whereas different results have been found when investigating milk intake and the risk of rectal cancer among women( Reference Vieira, Abar and Chan 4 – 6 ).
Different mechanisms for an association between the consumption of dairy products and the risk of CRC have been examined, including mechanisms involving Ca, vitamin D and properties of fermented dairy products( Reference Norat and Riboli 7 – Reference Rafter 11 ). Milk also contains other constituents, such as conjugated linoleic acid and sphingomyelin, which may affect the risk of CRC( Reference Kelley, Hubbard and Erickson 12 , Reference Parodi 13 ). However, the main hypothesis for the observed association between dairy products and the risk of CRC relates to Ca( Reference Vieira, Abar and Chan 4 ).
The per capita milk intake in Europe is high (>150 kg/capita per year)( 14 ), but the milk intake in Norway almost halved between 1989 (175 kg/capita per year) and 2013 (92 kg/capita per year)( 15 , 16 ). Norwegian women used to have one of the highest intakes of cow’s milk in Europe (177 g/d)( Reference Hjartaker, Lagiou and Slimani 17 ) and large variation in intake (0–>270 g/d)( Reference Hjartaker, Thoresen and Engeset 18 ). The Norwegian Women and Cancer (NOWAC) Cohort Study has repeated measurements on dietary information for many of its participants. The aim of our study was to examine the association between milk intake and the risk of CRC, colon cancer and rectal cancer among women based on data from the NOWAC Cohort Study. We did this by applying two different analytical approaches: one that included repeated measurements to account for changes in milk intake and one that, concurrent to the main body of the existing literature, included baseline data only.
Methods
The Norwegian Women and Cancer Cohort Study and study sample
Between 1991 and 2007, approximately 172 000 women were enrolled in the NOWAC Study, a nationwide prospective cohort study. The women have been sampled randomly from the National Registry in Norway. All study participants completed a self-administered questionnaire at enrolment, and follow-up questionnaires are mailed approximately every 6th year thereafter. As questionnaires sent before 1996 did not include a detailed FFQ, only the 98 355 NOWAC participants who answered a questionnaire between 1996 and 2005 (set as the baseline questionnaire in the present study) were eligible for inclusion in the present study. Some of these women also completed a similar questionnaire approximately 6 years later, which was set as the follow-up questionnaire.
Informed consent was obtained from all participants in the NOWAC Study, and the study has been approved by the Norwegian Data Inspectorate and the Regional Committee for Medical Research Ethics. The NOWAC Study and a number of validation studies have been described earlier( Reference Borch, Ekelund and Brage 19 – Reference Hjartaker, Lund and Bjerve 25 ).
We excluded participants with a history of invasive cancer (except non-melanoma skin cancer) at baseline (n 4345), as well as those with International Classification of Diseases for Oncology (ICD-O) tumour code 9 (malignant, uncertain whether metastatic or primary site) (n 19), ICD-O code 6 (malignant, metastatic site) (n 1) and those with a daily energy intake of <2·5 MJ (n 1581) or >15·0 MJ (n 226) at baseline or follow-up. We further excluded women with missing information on the following variables at baseline: milk intake (n 1302), all six questions about spread/cold cut intake on bread (n 694), yogurt intake (n 1030) and self-reported height (n 729). We then excluded women with missing information at baseline or follow-up on self-reported weight (n 2789) or smoking duration (n 650). Finally, we excluded those with uncertainty about smoking duration (n 3288) and those with a BMI <13·0 kg/m2 (n 4) or >60·0 kg/m2 (n 22) at baseline or follow-up. Thus, the final study sample with baseline information consisted of 81 675 women.
Follow-up data on dietary intake and other exposure variables were available for 49 274 women, but censoring owing to incident cancer/emigration/death (n 1691) left 47 583 women at follow-up. The reasons for lack of follow-up data were as follows: not all of the women had participated long enough to be invited to complete a follow-up questionnaire, and some of the eligible women did not complete the follow-up questionnaire or they had missing information on dairy product variables (milk, hard white cheese or yogurt) at follow-up. Fig. 1 shows the flow chart of the participants in the study.
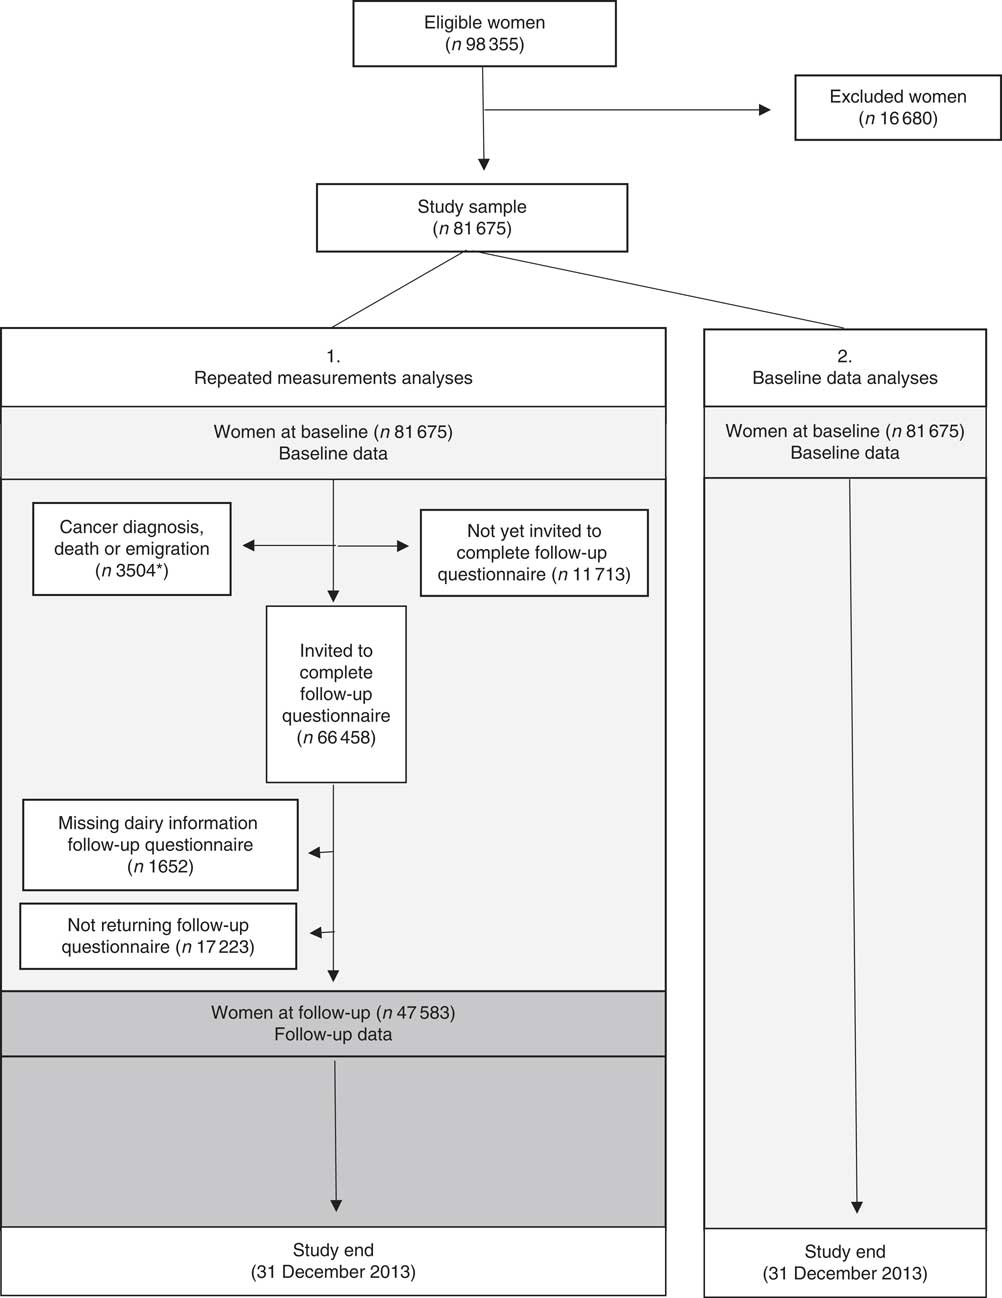
Fig. 1 Flow chart of women included in the present analyses. * n 1691 of these women had baseline and follow-up data.
Assessment of milk intake and other variables
Age was extracted through linkage to the National Registry in Norway. Other information was taken from the baseline and follow-up questionnaires. Self-reported height and weight, both of which have been validated( Reference Skeie, Mode and Henningsen 24 ), were used to calculate BMI. The variable of smoking duration was created by combining information on smoking history and smoking status. Self-reported physical activity level (global score including physical activity at home, work, exercise, walking and so on) was reported on a 10-point scale, which has been found valid to rank physical activity level in the NOWAC Study( Reference Borch, Ekelund and Brage 19 ). Information on education was taken from the NOWAC enrolment questionnaire.
Dietary information was taken from the semi-quantitative FFQ included in the NOWAC questionnaires. The FFQ aimed at recording usual food intake. Average consumption of foods during the last year was reported in the FFQ by ticking fixed frequencies that were chosen to fit the Norwegian diet. Portion sizes were reported in household units (e.g. tablespoons), decilitres or natural units (e.g. an orange). According to a validation study including 238 women, the NOWAC FFQ’s ability to rank participants was good for foods eaten frequently( Reference Hjartaker, Andersen and Lund 20 ). A validation study involving fatty acids and marine foods has also been performed in the NOWAC Study( Reference Hjartaker, Lund and Bjerve 25 ), and a test–retest reproducibility study found that the level of reproducibility was within the range found for similar FFQ( Reference Parr, Veierød and Laake 23 ). The calibration coefficientFootnote 1 between four repeated 24-h dietary recalls and the FFQ was 0·96 for milk intake from a glass (unpublished results). We multiplied portion size by the mean intake frequency to calculate the consumption of each food in grams. The lowest value in the frequency option was used for the uppermost category of a food (e.g. a frequency option of ‘4+’ was categorised as consumption of ‘4’ in our analyses). In these calculations, a Norwegian Weight and Measurement Table( 26 ) was used. Daily intake of nutrients and energy was computed based on the Norwegian Food Composition Table( 27 ). Missing portion sizes were treated as the smallest portion unit option in the questionnaire, and missing frequencies were treated as no consumption. We used a program developed for SAS at the Institute of Community Medicine, UiT The Arctic University of Norway, to calculate daily intakes of foods, energy and nutrients per participant.
In this study, milk intake was assessed as milk consumed from a glass (milk intake). The FFQ did not distinguish between fermented and non-fermented milk. Other types of milk consumption (e.g. milk used when cooking, milk in coffee) were not considered in our calculation of milk intake. Participants reported how many glasses of each type of milk (whole-fat milk, semi-skimmed milk, extra semi-skimmed milk and skimmed milk) they consumed on average during the last year (no/seldom, 1–4 glasses/week, 5–6 glasses/week, 1 glass/d, 2–3 glasses/d and ≥4 glasses/d). The question on extra semi-skimmed milk (vitamin-D-fortified) was included in the questionnaire from the year 2000, when it was introduced on the market. Women who reported a milk intake of ‘no/seldom’ were categorised as non-consumers. One glass of milk was estimated to weigh 210 g (based on unpublished results from a validation study( Reference Hjartaker, Andersen and Lund 20 )).
Some dietary questions have been added to the FFQ over the years owing to new products being available on the market, improvements of the questionnaire and specific hypotheses. Consumption of red meat included chops, steak and roast meat (beef, mutton, pork), reindeer meat and lean sandwich meat. Consumption of processed meat included meatballs, hamburgers, sausages, liver pate, processed sandwich meats and bacon. Some of the questionnaires did not contain questions on bacon and reindeer meat.
Classification of colorectal cancer cases and vital status
The unique national identification number given to all Norwegian citizens was used to link study participants to the Cancer Registry of Norway for cancer and to the National Registry in Norway for vital status (alive, dead, emigrated). The Cancer Registry of Norway classified CRC cases according to the International Classification of Diseases, Seventh Revision (ICD-7). The CRC cases were classified according to anatomic subsite: CRC (ICD-7 code 153.0–154.0); colon cancer (ICD-7 code 153.0–153.9: caecum, appendix, ascending and transverse colon, hepatic and splenic flexures, descending and sigmoid colon, recto-sigmoid junction and unspecified location); and rectal cancer (ICD-7 code 154.0). Cancers with ICD-7 code 154.1 (anal canal tumours) were not included in the analyses. Furthermore, only cancer with ICD-O tumour code 3 (malignant, primary site) were regarded as CRC.
Statistical analysis
Descriptive characteristics of the study participants at baseline and at follow-up are presented as percentages or median values and 5th and 95th percentiles. The associations between milk intake and the risk of CRC, colon cancer and rectal cancer were investigated by Cox proportional hazards regression models with age as the time scale, using two different analytical approaches. One approach consisted of measurements from two points in time when available (repeated measurements analyses). In the other approach, we investigated whether running the same models using baseline measurements only (baseline data analyses) affected the results. All models were stratified by baseline questionnaire subcohort (i.e. whether baseline questionnaire was in the form of the NOWAC enrolment questionnaire or of the first NOWAC follow-up questionnaire). Hazard ratios (HR) and 95 % CI were calculated.
The same study sample (n 81 675) was used for repeated measurements analyses and baseline data analyses.
In the repeated measurements analyses, we used baseline data on dietary and non-dietary information until follow-up, and follow-up data on dietary and non-dietary information thereafter. That is, we used baseline data until the diagnosis of any incident cancer (except for non-melanoma skin cancer), emigration, death, follow-up, whichever occurred first. After that, follow-up data for milk intake and all potential confounders except education were used in the analysis until the diagnosis of any incident cancer (except for non-melanoma skin cancer), emigration, death or the end of the study (31 December 2013), whichever occurred first. Participants without follow-up data (not yet invited to complete follow-up questionnaire, not returning follow-up questionnaire or missing information on dairy product variables in follow-up questionnaire) were censored at follow-up. In the repeated measurements analyses, person-years were calculated from the start of the study to the end of the study (31 December 2013), diagnosis of any cancer (except non-melanoma skin cancer), death or emigration or no follow-up data, whichever occurred first.
In baseline data analyses, we used baseline data for milk intake and all the other variables until diagnosis of any incident cancer (except for non-melanoma skin cancer), death, emigration or the end of the study (31 December 2013), whichever occurred first. Person-years were calculated in the same way as in the repeated measurements analyses, with the exception that no one was censored at follow-up.
Three Cox proportional hazards regression models (age-adjusted model, multivariable model and energy-adjusted multivariable model) were established with milk intake as the exposure. In the multivariable model, we adjusted for predefined potential confounders for CRC that we identified through a literature review (BMI, smoking, yogurt, hard white cheese, fibre from foods, processed meat, red meat and alcohol). In the energy-adjusted multivariable model, we adjusted for everything in the multivariable model plus energy intake.
Physical activity level has been found to decrease the risk of CRC( 3 ). However, HR for CRC, colon cancer or rectal cancer hardly changed in the age-adjusted or the multivariable model (in both repeated measurements analyses and baseline data analyses) when adjusting for physical activity level among those with this information available (n 72 071). Owing to this, the frequency of missing information on physical activity level (n 9604) and the moderate power of our study, this variable was not included in the multivariable model.
Milk intake was calculated as the sum of the four different milk types in grams. Milk intake was modelled categorically; those reporting no/seldom intake made up one group (no/seldom intake group), and the rest were divided into three groups (tertiles): low milk intake group, >no/seldom to ≤165 g/d; medium milk intake group, >165 to ≤240 g/d; and high milk intake group, >240 g/d. Furthermore, the following variables were modelled categorically: smoking (never, smoking<30 years, smoking≥30 years), duration of education (<10, 10–12, >12 years), hard white cheese (quartiles), yogurt (no/seldom, <50 g/d, ≥50 g/d) and traditional whey cheese (no/seldom, <15 g/d, ≥15 g/d). Finally, the following variables were modelled continuously: physical activity level (on a ten-point scale), BMI (kg/m2), fibre from foods (g/d), processed meat intake (g/d), red meat intake (g/d), Ca from foods other than dairy products (yogurt, hard white cheese, milk) (mg/d), vitamin D intake from cod liver oil and from foods except extra semi-skimmed milk (vitamin-D-fortified) (µg/d), alcohol consumption (g/d) and energy intake (kJ/d).
When investigating the associations between milk intake and risk of CRC, colon cancer and rectal cancer, the predefined models (age-adjusted, multivariable, energy-adjusted multivariable) were used. The robustness of the associations for CRC, colon cancer and rectal cancer were investigated by running the multivariable model plus one possible confounder identified through a literature review (traditional whey cheese, Ca from foods except dairy products (yogurt, hard white cheese, milk), vitamin D from cod liver oil and from foods except vitamin-D-fortified milk). We also ran analyses using the multivariable model less one variable (BMI, smoking, yogurt, hard white cheese, processed meat, red meat, fibre from foods, alcohol consumption). Moreover, we investigated whether adjustment for duration of education (excluding women with >29 years of education (n 23), <7 years of education (n 314) and women with missing information on education (n 4132)) in the multivariable model affected the risk estimates. To eliminate the influence of pre-existing disease on the risk estimates, we excluded all CRC cases that occurred 1 year or less from baseline and from the start of follow-up (in the multivariable model and the energy-adjusted multivariable model). Finally, in the subsample of women with complete repeated measurements (i.e. complete baseline and follow-up data) (n 49 274), we analysed the data using repeated measurements analyses and baseline data analyses.
We found only minor effects on the estimated HR of milk intake in the multivariable model for CRC, colon cancer and rectal cancer when the continuous variables were modelled as categorical variables. Owing to this finding and moderate power in our study, these variables were used as continuous variables in the analyses. Possible correlations between the variables included in the Cox proportional hazards regression models were investigated by the variance inflation factor and Spearman’s correlation coefficient at baseline. The proportional hazards assumption was investigated by a log-log survival plot and Schoenfeld residuals. Possible predefined interaction effects (milk v. processed and read meat, respectively( Reference Oostindjer, Alexander and Amdam 28 )) were examined in the multivariable model for CRC and colon cancer using the likelihood ratio test comparing the multivariable model including a product term and the multivariable model. To examine linear trends in risk, we made a continuous variable by calculating the average intake of milk within each milk intake group and including this continuous variable in the analyses. A P value of less than 0·05 was considered statistically significant.
STATA (StataCorp) version 14.0 was used in the analyses.
Results
Sample characteristics
In the repeated measurements analyses, there were 922 583 person-years of observation, and 617 (71 %) and 255 (29 %) incident cases of colon cancer and rectal cancer, respectively. In the baseline data analyses, there were 1 059 797 person-years of observation, and 771 (71 %) and 313 (29 %) incident cases of colon cancer and rectal cancer, respectively. Median time under study was 10 (range 1–17) and 15 (range 1–17) years, and the median age at CRC diagnosis was 62 (range 43–85) and 63 (range 43–86) years, in repeated measurements analyses and baseline data analyses, respectively.
The median and mean milk intake was 165 and 212 g/d at baseline and 75 and 171 g/d at follow-up, respectively. Furthermore, the median and mean total Ca intake from foods (including milk) was 704 and 753 g/d at baseline and 661 and 715 g/d at follow-up, respectively. At baseline, the median age (51 years, range: 41–70 years) and the median BMI was the same in all milk intake groups (Table 1). The median milk intake at baseline was 0, 75, 210 and 525 g/d in the no/seldom, low, medium and high milk intake groups, respectively. At follow-up, median milk intake declined among those with medium and high milk intake at baseline, whereas median milk intake among those in the no/seldom and low intake group at baseline was the same at follow-up. In all, 53 % of the women did not change milk intake group between baseline and follow-up, whereas 33 % changed to a lower and 14 % to a higher milk intake group (Table 2). The median intake of Ca from foods was higher among those drinking more milk at baseline. The Spearman’s correlation coefficient was 0·67 between milk intake and Ca from foods at baseline. The median age at baseline was higher among the CRC cases than in the total study sample (Table 3), whereas median BMI was the same in the total study sample and among the CRC cases at baseline. Women diagnosed with CRC had shorter duration of education when compared with the total study sample.
Table 1 Selected characteristics of the study sample by milk intake at baseline (1996–2005) in the Norwegian Women and Cancer Cohort Study, n 81 675(Medians and 5th–95th percentiles; numbers; percentages)
* Milk intake group: no/seldom: 0 (no/seldom); low: >no/seldom to ≤165 g/d; medium: >165 g/d to ≤240 g/d; high: >240 g/d.
† n 72 071 at baseline.
‡ n 77 206 at baseline.
§ Milk is included in Ca from foods.
|| Dairy products=total milk+hard white cheese+yogurt.
¶ Vitamin D from cod liver oil is included in vitamin D from foods.
Table 2 Percentage of women in the milk intake groupsFootnote * at baseline and follow-up (n 47 583) in the Norwegian Women and Cancer Cohort Study

* Milk intake group: no/seldom: 0 (no/seldom); low: >no/seldom to ≤165 g/d; medium: >165 g/d to ≤240 g/d; high: >240 g/d.
Table 3 Selected characteristics of the study sample (n 81 675) and colorectal (CRC), colon and rectal cancer cases at baseline (1996–2005) in the Norwegian Women and Cancer Cohort Study(Medians and 5th–95th percentiles; numbers of cases; percentages)
* n 72 071 at baseline.
† n 77 206 at baseline.
‡ Milk is included in Ca from foods.
§ Dairy products=total milk+hard white cheese+yogurt.
|| Vitamin D from cod liver oil is included in vitamin D from foods.
Main analyses
When examining the associations between milk intake and risk of CRC, colon cancer and rectal cancer, a weak inverse association may be indicated between milk intake and risk of colon cancer (Table 4). For rectal cancer, and hence CRC, different results were found depending on the analytical approach. We found no association between milk intake and risk of rectal cancer in the repeated measurements analyses, whereas a weak protective effect may be indicated in baseline data analyses. Energy-adjusted multivariable models in repeated measurements and baseline data analyses showed HR for CRC of 0·85 (95 % CI 0·69, 1·05, P trend 0·14) and 0·78 (95 % CI 0·64, 0·94, P trend <0·01), respectively, when comparing the high with the no/seldom milk intake group. When performing the same comparisons in energy-adjusted multivariable models, the HR for colon and rectal cancer were 0·80 (95 % CI 0·62, 1·03, P trend 0·07) and 0·97 (95 % CI 0·67, 1·42, P trend 0·92) in the repeated measurements analyses, respectively, and in the baseline data analyses the HR were 0·81 (95 % CI 0·64, 1·01, P trend 0·03) for colon cancer and 0·71 (95 % CI 0·50, 1·01, P trend 0·03) for rectal cancer. The HR for milk intake in the multivariable model were not substantially different from the HR in the energy-adjusted multivariable model for CRC, colon cancer or rectal cancer in repeated measurements analyses or baseline data analyses.
Table 4 Risk of colorectal cancer (CRC), colon cancer and rectal cancer according to milk intake using repeated measurements analyses and baseline data analyses in the Norwegian Women and Cancer Cohort Study (n 81 675)(Hazard ratios (HR) and 95 % confidence intervals)
* Milk intake group: no/seldom: 0 (no/seldom); low: >no/seldom to ≤165 g/d; medium: >165 g/d to ≤240 g/d; high: >240 g/d.
† Age as the time scale and adjusted for BMI, smoking, processed meat, red meat, hard white cheese, yogurt, fibre from foods, alcohol.
‡ Age as the time scale and adjusted for BMI, smoking, processed meat, red meat, hard white cheese, yogurt, fibre from foods, alcohol, energy intake.
Additional analyses (robustness)
Performing analyses using the multivariable model plus one variable (traditional whey cheese, Ca from foods except dairy products, vitamin D from cod liver oil and from foods except vitamin-D-fortified milk), or less one variable (BMI, smoking, yogurt, hard white cheese, processed meat, red meat, fibre from foods, alcohol consumption), did not change the risk estimates substantially for CRC, colon cancer or rectal cancer in repeated measurements analyses or baseline data analyses, nor did the addition of education. Excluding all CRC cases that occurred within 1 year of baseline in baseline data analyses did not substantially alter the risk estimates for CRC, colon cancer or rectal cancer. The same was found when these cases plus all CRC cases that occurred within 1 year of follow-up were excluded from repeated measurements analyses. Thus, these CRC cases were included in the baseline and repeated measurements analyses, respectively. No effect modification by processed meat intake or red meat intake was found in the multivariable model for CRC or colon cancer in either the repeated measurements analyses or the baseline data analyses.
In the subsample (n 49 274) of women with complete baseline and follow-up information, the HR for colon cancer when comparing the high with the no/seldom intake group in the energy-adjusted multivariable model were 0·72 (95 % CI 0·53, 0·99, P trend 0·06) and 0·76 (95 % CI 0·56, 1·04, P trend 0·05) in repeated measurements analyses and baseline data analyses, respectively (Table 5). Comparing these same groups yielded HR for rectal cancer in the energy-adjusted multivariable model of 0·78 (95 % CI 0·49, 1·23, P trend 0·48) and 0·63 (95 % CI 0·40, 1·00, P trend 0·05) in repeated measurements analyses and baseline data analyses, respectively.
Table 5 Risk of colon and rectal cancer according to milk intake using repeated measurements analyses and baseline data analyses in a subsample in the Norwegian Women and Cancer Cohort Study (n 49 274)(Hazard ratios (HR) and 95 % confidence intervals)
* Milk intake group: no/seldom: 0 (no/seldom); low: >no/seldom to ≤165 g/d; medium: >165 g/d to ≤240 g/d; high: >240 g/d.
† Age as the time scale and adjusted for BMI, smoking, processed meat, red meat, hard white cheese, yogurt, fibre from foods, alcohol.
‡ Age as the time scale and adjusted for BMI, smoking, processed meat, red meat, hard white cheese, yogurt, fibre from foods, alcohol, energy intake.
Discussion
In this large cohort study of Norwegian women, we studied the association between milk intake and the risk of CRC, colon cancer and rectal cancer using both repeated measurements analyses and baseline data analyses. Our study indicates that there may be a weak inverse association between milk intake and risk of colon among women. For rectal cancer, and hence CRC, different results were found depending on the analytical approach. Our study suggests that further attention ought to be given to the use of single or repeated measurements when investigating the association between milk intake and the risk of CRC, colon and rectal cancer, as individuals may change their milk intake over time.
The main strengths of the study include its prospective design, the use of information on milk intake and many potential confounders from two time points for many of the participants, and almost complete information on the end points (cancer incidence, death, emigration) through linkage to national registries. The Cancer Registry of Norway has almost complete information on CRC cases and a high proportion of CRC are morphologically verified( Reference Larsen, Smastuen and Johannesen 29 ). Moreover, the FFQ used in this study has been validated( Reference Hjartaker, Andersen and Lund 20 , Reference Hjartaker, Lund and Bjerve 25 ), and milk intake in Norway has traditionally been high with a large variation. Furthermore, the calibration coefficient between 24-h dietary recalls and the FFQ for milk was 0·96 (unpublished results), and in a test–retest study of the FFQ the agreement for whole-milk intake it was 85 %( Reference Parr, Veierød and Laake 23 ). The NOWAC Study is a nationwide study with participants who were randomly sampled from the National Registry in Norway. Studies of external validity have shown a somewhat higher educational level among NOWAC respondents than among NOWAC invitees, but no major selection bias was found( Reference Lund, Kumle and Braaten 22 ).
There are also several limitations in our study. Exposure information is a potential weakness. In general, it is difficult to collect precise information about dietary intake. Although we measured milk intake at two time points, changes in milk intake between the measures or after the second dietary assessment are not registered, and measurement error owing to this cannot be excluded. Moreover, we only included milk consumption from a glass, and thus milk used in coffee or elsewhere was not included. We could not analyse non-fermented and fermented milk separately and did not have enough power to perform analyses on milk with different fat contents. Furthermore, we had a modest number of rectal cancer cases. We had information about vitamin D intake from cod liver oil, but lacked information on vitamin D from other supplements and Ca supplement use. Residual confounding from vitamin D and Ca can therefore not be excluded. As the present study is a prospective cohort study, we can rule out the most serious concerns of information and selection bias. Nevertheless, selection bias may have occurred, as not all of the women who were invited to complete a follow-up questionnaire returned it. However, we have no reason to believe that any association between milk intake and the risk of CRC differs between participants who return follow-up questionnaires and those who do not. Reverse causality owing to changes in food consumption before CRC diagnosis may have biased the estimates in either direction. However, analyses excluding CRC cases that occurred within 1 year of baseline, and, in the repeated measurements analyses, also excluding CRC cases occurring within 1 year of follow-up, hardly altered the risk estimates. We adjusted for many of the common risk factors for CRC, and the differences between the age-adjusted multivariable model and energy-adjusted multivariable model were mostly minor. Nevertheless, residual confounding owing to unknown or imprecisely assessed confounders cannot be ruled out. Physical activity is a risk factor for CRC( 3 ), and thus our information on physical activity level may be of particular concern, as it had the highest fraction of missing values.
In our study, almost half of the women with measurements from two points in time changed their milk intake, with 33 % moving to a lower milk intake group. This finding is in line with what has been observed in national diet surveys among adult Norwegian women( 30 , 31 ). In the surveys conducted in 1993–1994, 1997 and 2010–2011, the mean milk intake was 383, 332 and 187 g/d, respectively( 30 , 31 ). According to Food Disappearance Data, milk intake halved in Norway between 1953–1955 and 2011( 16 ).
Lack of repeated dietary measurements may contribute to inconsistency in the results of observational studies( Reference Wu, Willett and Fuchs 32 ). To the best of our knowledge, only a few studies have used information on milk intake from more than one point in time when investigating the association between milk intake and risk of CRC( Reference Wu, Willett and Fuchs 32 – Reference Martinez, Giovannucci and Colditz 34 ), and they did not use the same analytical approach as we did. As we lack information on milk intake from two points in time for a portion of the study sample, the number of CRC cases was higher in the baseline data analyses than in repeated measurements analyses. The higher statistical strength owing to more CRC cases is a benefit for our baseline data analyses. On the other hand, the fraction of women misclassified for milk intake in these analyses will increase over time owing to the change in milk intake. The advantage of repeated measurements analyses is that they better take into account changes in milk consumption. To the best of our knowledge, it is not known at what stage in the carcinogenic process milk intake may have the strongest impact on CRC development.
The analyses on colon cancer and rectal cancer in the subsample of women with complete data on milk intake from two points in time support the results that were observed in the total study sample. The advantages of performing the analyses in this subsample of women were that the follow-up time and number of colon and rectal cancer cases were the same in repeated measurements analyses and baseline data analyses; the disadvantage was that we did not use all the available information on milk intake or other variables, as not all the women in the study sample were included in these analyses.
Cohort studies on the association between milk intake and the risk of CRC have reported different results( Reference Lee, Shu and Yang 33 – Reference Simons, Leurs and Weijenberg 49 ). A Norwegian study found no association between milk intake and colon cancer among women( Reference Gaard, Tretli and Loken 47 ). A protective effect of milk on colon cancer was found for both sexes combined in a recent meta-analysis( Reference Vieira, Abar and Chan 4 ), but not when the analyses were restricted to women in this and in another meta-analysis( Reference Vieira, Abar and Chan 4 , Reference Ralston, Truby and Palermo 5 ). An inverse association between milk intake and colon cancer risk was found among women in an EPIC study( Reference Murphy, Norat and Ferrari 50 ); our results may indicate the same. When it comes to milk intake and the risk of rectal cancer, we found no association in repeated measurements analyses, but indications of an inverse association in baseline data analyses were observed. Different results regarding milk intake and the risk of rectal cancer have been found. A protective effect of milk on rectal cancer was found among women in one meta-analysis( Reference Vieira, Abar and Chan 4 ), but not in another( Reference Ralston, Truby and Palermo 5 ) or in the EPIC study( Reference Murphy, Norat and Ferrari 50 ). Different genetic features between colon and rectal cancers have been observed( Reference Frattini, Balestra and Suardi 51 ), and it has been suggested that the aetiological factors may differ between colon and rectal cancer( Reference Kapiteijn, Liefers and Los 52 ). It is possible that milk does not have the same effect on colon and rectal cancer risk( Reference Huncharek, Muscat and Kupelnick 53 ).
The Ca content in dairy products is the main hypothesis for the possible protective effect of dairy products on CRC( Reference Vieira, Abar and Chan 4 ). According to the World Cancer Research Fund International/American Institute for Cancer Research, there is probable evidence that Ca supplements decrease the risk of CRC( 3 ) and a recent review classified the association between Ca and CRC risk as highly suggestive( Reference Theodoratou, Timofeeva and Li 54 ). Both non-fermented and fermented milk are good sources of Ca( Reference Ralston, Truby and Palermo 5 , 55 ), and our results indicate that milk was an important source of Ca in our study. This is in line with the results from a national diet survey among Norwegian adults in 2010–2011( 31 ), in which milk accounted for 27 % of Ca from foods. It has been proposed that Ca affects proliferation, differentiation and apoptosis in the colon( Reference Newmark and Lipkin 56 – Reference Rogers, Hanly and Collins 58 ). Different levels of Ca( Reference Wu, Willett and Fuchs 32 , Reference McCullough, Robertson and Rodriguez 39 , Reference Pietinen, Malila and Virtanen 43 ), and threshold levels (approximately 1000–1400 mg/d)( Reference Larsson, Bergkvist and Rutegard 46 , Reference Cho, Smith-Warner and Spiegelman 59 ) of Ca, have been suggested to protect against colon cancer. In our study, the median intake of Ca from foods and Ca from milk in the high milk intake group was 1052 and 525 mg/d at baseline, respectively. We also adjusted for two other dairy products containing Ca (hard white cheese and yogurt), and Ca from foods other than milk, hard white cheese and yogurt, without this affecting the risk estimates. We could not adjust for Ca supplement use. However, in a subsample of women in the NOWAC Study, Ca was not among the three most popular supplement ingredients( Reference Skeie, Braaten and Hjartaker 60 ).
Vitamin D affects the absorption of Ca in the gut( Reference Pufulete 61 ) and there may be an inverse association between vitamin D and the risk of CRC( Reference Touvier, Chan and Lau 62 ). Owing to the links between Ca and vitamin D, we adjusted for vitamin D from cod liver oil (we had no information on vitamin D from other supplements) and from foods other than vitamin-D-fortified milk, but this did not affect the risk estimates for milk intake.
Milk also contains constituents other than Ca, which may have a role in cancer prevention( Reference Pufulete 61 , Reference Haug, Høstmark and Harstad 63 ), such as linoleic acid and sphingolipids( Reference Kelley, Hubbard and Erickson 12 , Reference Parodi 13 ). Constituents found in fermented milk may also affect carcinogenesis( Reference Elfahri, Vasiljevic and Yeager 10 , Reference Rafter 11 ). Owing to the differences in non-fermented and fermented milk, it is possible that these dairy products have different preventive effects against CRC( Reference Ralston, Truby and Palermo 5 ). However, based on our knowledge about Norwegian food habits and unpublished data from the 24-h dietary recalls performed in NOWAC in 2002( Reference Hjartaker, Andersen and Lund 20 ), we assume that most of the milk consumed in our study is non-fermented, and therefore we presume that non-fermented milk contributed most to the results in the present study.
The women in the present study have been randomly sampled from the entire Norwegian female population, and no major source of selection bias has been found that could seriously threaten generalisation of the results to the source population( Reference Lund, Dumeaux and Braaten 21 , Reference Lund, Kumle and Braaten 22 ). Generalisation of the results to female populations outside of Norway may be affected by, for instance, ethnicity( Reference Vieira, Abar and Chan 4 , Reference Ollberding, Nomura and Wilkens 64 ), age and level of milk intake. Generalisation of the results to men may be affected by sex differences.
Conclusion
The present study, which used two different analytical approaches (repeated measurements analyses and baseline data analyses), indicates that there may be a weak inverse association between milk intake and risk of colon among women. For rectal cancer, and hence CRC, different results were found depending on the analytical approach. Our study suggests that further attention ought to be given to the use of single or repeated measurements when investigating the association between milk intake and the risk of CRC, colon cancer and rectal cancer.
Acknowledgements
The authors thank all the participants of the NOWAC Study. The authors also thank the colleagues for useful discussions while working on this paper.
This research received no specific grant from any funding agency or from commercial or not-for-profit sectors.
E. L. collected the data and is the principal investigator of the NOWAC Study. T. Bakken, T. Braaten, A. O., A. H. and G. S. formulated the research question and contributed in methodological considerations. T. Bakken wrote the paper and performed the statistical analyses. T. Braaten gave statistical advice. T. Bakken, T. Braaten, A. O., A. H., E. L. and G. S. interpreted the data, revised the paper critically for intellectual content and approved the final version to be published.
None of the authors has any conflicts of interest to declare.


