


Obesity is a global health problem that affects individuals of every age, sex, ethnicity, race and socio-economic status, with 39·6 % of adults in the USA having obesity(Reference Hales, Fryar and Carroll1). Numerous combinations of energy restriction and increased exercise have shown moderate short-term success in producing clinically significant (≥ 5 %)(2) reductions in body weight(Reference Goodrick and Foreyt3–Reference Meckling, O’Sullivan and Saari6). However, regardless of the weight loss programme employed, preventing weight regain is difficult. In general, 50 % of individuals who initially lose weight will regain more than 45–75 % of the weight lost within 12–30 months from the end of treatment(Reference Foreyt and Goodrick4,Reference Barte, Ter Bogt and Bogers7–Reference Weiss, Galuska and Kettel Khan10) . A 2015 NIH working group(Reference MacLean, Wing and Davidson11) identified two primary reasons to explain the high rates of weight regain. First, that weight loss achieved by dieting induces a number of physiological and behavioural adaptations that collectively result in an elevation of appetite(Reference MacLean, Higgins and Wyatt12,Reference Cornier13) and enhance the incentive salience (rewarding value) of food(Reference Cameron, Goldfield and Cyr14,Reference Cornier, Salzberg and Endly15) resulting in greater preference for more palatable foods leading to food seeking and ingestive behaviours. Thus, weight loss may lead to increases in energy intake (EI) and decreases in the quality of an individual’s diet post-weight loss. Second, the behavioural strategies used to induce weight loss are commonly employed in a transient manner and adherence generally wanes as weight loss plateaus.
Exercise has been suggested to play an important role in the prevention of weight regain(Reference Jensen, Ryan and Apovian16). However, the clinical effectiveness of physical activity as a weight loss maintenance strategy, in the form of regimented exercise or increased moderate to vigorous physical activity (MVPA), has yet to be demonstrated. For example, recent work by our group demonstrated that higher levels of prescribed exercise did not prevent weight regain(Reference Washburn, Szabo-Reed and Gorczyca17). Increasing energy expenditure through increased physical activity can result in behaviours (performed consciously or unconsciously), such as changes in dietary intake (increased EI, decreased diet quality), that minimise the exercise-induced negative energy balance or, in some cases, even result in a positive energy balance (i.e. weight gain)(Reference Thomas, Bouchard and Church18–Reference Schubert, Desbrow and Sabapathy23). This topic is highly debated, and we are unaware of previous studies which have examined the role of exercise or MVPA on dietary intake in individuals attempting to maintain their weight loss.
The Midwest Exercise Trial for the Prevention of Weight Regain (MET-POWeR) was designed to evaluate the effectiveness of three levels of exercise (150, 225 or 300 min/week) on the prevention of weight regain over 12 months following clinically meaningful weight loss (≥ 5 %) in a sample of adult men and women with overweight and obesity. The previously published results for the primary outcome, weight change over 12 months, indicated no significant difference between randomised group (150 min/week (1·1 (sd 6·5) kg), 225 min/week (3·2 (sd 5·7) kg) or 300 min/week (2·8 (sd 6·9) kg) groups (P = 0·21)(Reference Washburn, Szabo-Reed and Gorczyca17). However, it should be noted that in all three groups, average weekly exercise minutes fell short of the recommendations, with participants randomised to the 150, 225 and 300 min/week groups only completing 129, 153 and 179 min/week, respectively. Data collected across the 12-month intervention on self-reported dietary intake (3-d food records) provided an opportunity to assess the impact of different volumes of exercise on change in EI and diet quality, as assessed by the Healthy Eating Index-2010 (HEI-2010), during a weight maintenance intervention. Additionally, accelerometer data collected across the 12-month intervention provided opportunity to assess the impact of cumulative MVPA, irrespective of group randomisation, on EI and diet quality.
Methods
Overview
A detailed description of the design and methods for MET-POWeR has been previously published(Reference Szabo, Washburn and Sullivan24). Briefly, 298 men and women initiated a 3-month behavioural weight loss intervention. The 235 participants who met the 5 % weight loss goal were randomised by sex and level of weight loss (i.e. 5–9·9 %, 10–14·9 %, ≥ 15 %) in a 1:1:1 allocation to one of three exercise groups (i.e. 150, 225 or 300 min/week of exercise) for a 12-month weight maintenance intervention. Participants were also asked to attend group behavioural sessions and follow dietary recommendations for weight maintenance. Approval for this study was obtained from the Human Subjects Committee at the University of Kansas-Lawrence. All participants provided written informed consent and were compensated monetarily for time and travel associated with outcome evaluations. For the present investigation, we have opted to explore the effect of different volumes of exercise and cumulative MVPA, irrespective of group randomisation, on EI and diet quality, as assessed by the HEI-2010, during the 12 month weight maintenance intervention only.
Participants
Participants were adults (BMI 25–44·9 kg/m2, aged 21–55 years) who were able to exercise and willing to be randomised to one of three exercise groups. Clearance from their primary care physician was required. Exclusion criteria included: participation in a research project involving weight loss or exercise in the previous 6 months; currently participating in a regular exercise programme, that is, > 2092 kJ/week (500 kcal/week) of planned activity assessed by questionnaire(Reference Taylor, Jacobs and Schucker25) not weight stable (±4·5 kg) for 3 months prior to intake; pregnant during the previous 6 months, lactating or planned pregnancy in the following 15 months; serious medical risk such as type 1 diabetes, cancer or recent cardiac event, that is, heart attack, angioplasty, etc.; eating disorder(Reference Garner, Olmsted and Bohr26); current treatment for psychological issues or taking psychotropic medications; taking medications known to affect weight; adherence to specialised diets; no access to grocery shopping and meal preparation, that is, military, college students with cafeteria plan, etc.
Diet recommendations
EI was prescribed as RMR estimated using the equation of Mifflin-St. Jeor multiplied by 1·2 to account for activities of daily living(Reference Matthews, Chen and Freedson30). Daily meal plans including suggested servings of grains, proteins, fruits, vegetables, dairy and fats, based on participants’ energy requirements and in compliance with the USDA/HHS Dietary Guidelines for Americans, were provided to all participants(Reference Trost, McIver and Pate31). Participants were recommended but not required to consume of two commercially available portion-controlled entrées (753–1130 kJ (180–270 kcal) each) or low-energy shakes, and five servings of fruits and vegetables per day. Participants were asked to purchase portion-controlled entrées and shakes with acceptable energy and macronutrient content available at local supermarkets from a list provided by the trial.
Exercise recommendations
Participants were randomised to prescribed exercise groups of 150, 225 or 300 min/week. Exercise progressed from 100 min/week at 70 % heart rate max (HRmax) at the end of weight loss to the prescribed goals of 150, 225 or 300 min/week at month 2 and remained at goal for the duration of the 12-month intervention. Exercise intensity was prescribed at 70 % of age-predicted maximal heart rate (HRmax = 220 – age in years). Participants were asked to exercise 5 d/week, with 3d under supervision by research staff at one of our dedicated exercise facilities which were open Monday through Friday, 06.00–10.00 and 16.00–20.00 hours to accommodate participants’ schedules. Treadmill walking was the primary mode of supervised exercise; however, 1 session/week of supervised exercise using an alternative mode (elliptical, bike, etc.) was permitted to provide variety and prevent overuse injuries. The duration and intensity of all exercise sessions (supervised + unsupervised) were verified by heart rate (HR) monitors (RS 400; Polar Electro). Each exercise session was preceded by a brief (5 min) warm-up following which participants were instructed to increase exercise intensity to reach their prescribed target HR prior to starting the HR monitor and to remain at the target intensity for the duration of each exercise session. Trained research staff monitored participants exercise HR to ensure that it remained at target during all supervised exercise sessions. A valid exercise session (supervised or unsupervised) was defined as a HR ± 4 beats/min of target HR for the prescribed exercise duration. Prior to each supervised exercise session (minimum of 3 sessions/week) research staff downloaded HR data from all unsupervised exercise sessions completed since the last exercise laboratory visit using the Polar HR Software. Research staff reviewed intensity and duration of the unsupervised exercise sessions. Participants not completing a valid exercise session were counselled to meet both the intensity and duration prescriptions. Participants who failed to meet the exercise recommendations were not dismissed from the trial.
Behavioural sessions
Participants attended 60-min group sessions based on social cognitive theory to promote adherence to diet and exercise recommendations(Reference Guenther, Casavale and Reedy28). Behavioural sessions were held weekly and in person during the first 3 months and twice per month over group phone call during the final 9 months of the maintenance intervention. Health educators delivered interactive 30–45-min lessons on topics such as meal planning, environmental control, eating on the go and behaviour change strategies for maintaining motivation for diet and exercise with the remaining time devoted to discussion and problem solving. Participants were asked to complete homework assignments designed to increase self-efficacy for both diet and exercise and to provide practice of behavioural skills and to self-monitor daily diet (study designed web form) and exercise (paper and pencil log) and weekly body weight.
Outcomes
All outcome assessments were completed by trained research staff in the Center for Physical Activity and Weight Management, Energy Balance Laboratories at either The University of Kansas-Lawrence or The University of Kansas Medical Center, Kansas City, Kansas. The assessment schedule was as follows: anthropometrics (weight/height) 0, 3, 6, 9 and 12 months; EI 0,3,6,9 and 12 months and total daily MVPA 0, 6 and 12 months. Minutes of prescribed exercise were assessed weekly across the 12-month intervention. Prior to baseline testing, participants completed a health history and demographic survey, that is, age, sex, household income and education.
Anthropometrics (weight/height)
Weight was obtained using a digital scale accurate to ± 0·1 kg (Befour Inc. Model #PS6600) between the hours of 06.00 and 10.00, after an overnight fast. Participants were weighed prior to breakfast and after attempting to void wearing a standard hospital gown. Height was measured using a stadiometer (Model PE-WM-60-84, Perspective Enterprises). BMI was calculated as weight (kg)/height (m2)
Dietary intake
Self-report 3-d food records (2 week days/1 weekend day) were used to assess EI and diet quality. Subjects were instructed on how to complete the records individually at their baseline testing appointment. Food record templates prompted for specific details regarding foods consumed and included location, time of meal/snack, generic food description, food description details and portion size. Subjects were provided an instruction sheet noting the level of detail desired and specific instructions related to food type and quantity and instructed to record this information immediately after each meal for all 3 d. Participants were asked to provide weight or household measurements (e.g. cups, tsp, etc.) when available; a measurement book was provided to increase the accuracy in portion size measurements and a food mapping grid was provided to ensure accurate descriptions on food descriptions. Upon receipt of the records, data were reviewed with participants by a registered dietitian to ensure completeness of records and to gather additional information on food details or amounts. Staff reviewing records did not have regular contact with participants during the intervention to reduce the likelihood of participants altering diet information to comply with the guidelines of their diet prescriptions. The Nutrition Data System for Research (NDS-R, version 2014) was used for determining nutrient content. Data were entered by research staff and checked by a registered dietitian with at least 1 year of experience using NDS-R. Diet outcome data were reviewed for plausibility and accuracy by the study team prior to analysis (e.g. records were excluded if they did not represent a typical day (holiday) or if the average daily EI across the 3 d was < 2092 kJ/d (500 kcal/d)). Data obtained from the food records were used to calculate diet quality index scores using the HEI-2010. The HEI-2010 was developed by the United States Department of Agriculture to assess conformance to the 2010 Dietary Guidelines for Americans(Reference Guenther, Kirkpatrick and Reedy27). The HEI-2010 assesses the intake of total fruit, whole fruit, total vegetables, dark green vegetables and beans, refined grains, whole grains, milk, meat and beans, seafood and plant protein, fatty acid ratio, Na and empty energy content and provides a point value based on how well a person meets the dietary guidelines (expressed as a percentage per 4185 kJ (1000 kcal))(Reference Guenther, Casavale and Reedy28). Point values for each category are summed to obtain the total HEI-2010, with 100 points representing the maximum score. The HEI-2010 was chosen over the more recent HEI-2015, as the diet recommendations for the study intervention were based on the 2010 dietary guidelines.
Physical activity
Participants were asked to wear a portable accelerometer (Actigraph GT3X, ArchiMed Inc.) on a belt over the non-dominant hip for 7 consecutive days. Accelerometer data were collected in 1-min epochs with a minimum of 8 h constituting a valid monitored day. Accelerometer data were processed using the protocol for adults used in the 2003–2004 and 2005–2006 cycles of NHANES(Reference Troiano, Berrigan and Dodd29,Reference Matthews, Chen and Freedson30) . The following intensity cut-points were used: sedentary (<1·0 MET; ≤ 100 counts/min), light (1·1–2·99 MET; 101–2019 counts/min), moderate (3·0–5·99 MET; 2020–5988 counts/min) and vigorous (≥6 MET; ≥ 5999 counts/min)(Reference Troiano, Berrigan and Dodd29,Reference Matthews, Chen and Freedson30) . Non-wear time was defined as at least 60 consecutive minutes of zero counts, with allowance for 1–2 min of counts between 0 and 100. Participants with less than 4 valid days were excluded from the accelerometer data analysis, as 4 d represents the minimum number of days to reliably estimate habitual physical activity(Reference Trost, McIver and Pate31).
Statistical analysis
Baseline measures and demographic characteristics were summarised using means and standard deviations for continuous variables, and frequencies and percentages for categorical variables. Linear mixed models were used to examine difference between randomised groups (group effects) changes over time (time effects) and group-by-time interactions for EI and HEI. The models were adjusted for age and sex and included a random intercept of each subject. All linear mixed models were fit with an autoregressive-1 correlation structure and degrees of freedom were estimated using the Satterthwaite approximation. Additionally, linear mixed models were used to examine the effect of total daily MVPA (accelerometer) on HEI-2010 total score and sub-scores irrespective of randomised group. MVPA was measured at every time point and is thus a time-varying covariate; to avoid using MVPA data from future observations to predict diet quality, we calculated the cumulative MVPA for each participant (MVPA at current time point plus MVPA at all previous time points) and included it as a covariate in the model. As a sensitivity analysis, most recent MVPA proceedings measurement of diet quality was used in the models instead of cumulative MVPA. This formulation assumes that any relationship between diet quality and MVPA is only dependent on the most recent exercise data (e.g. a cross-sectional relationship independent of previous MVPA). Linear mixed models were also used to assess the effect of cumulative and cross-sectional EI and cross-sectional HEI-2020 total and sub-scores on weight loss. All analyses were conducted using R.3.6.3; mixed models were fit using the nlme package(32,Reference Pinheiro, Bates and Debroy33) .
Results
Participants
Two hundred ninety-eight participants (fifty-three men, 245 women) initiated the 3-month weight loss intervention. During weight loss, forty-six participants volitionally left the trial (nine men, thirty-seven women) and seventeen participants (one man, sixteen women) did not achieve the 5 % weight loss criteria required for randomisation. Thus, 235 participants were randomised to one of the three exercise groups: 150 min/week, n 76, 225 min/week, n 80 and 300 min/week, n 79. This analysis is based on 224 participants (150 min/week, n 72, 225 min/week, n 77, 300 min/week, n 75) who had valid dietary data for at least one time point. Demographic characteristics of the participants at the start of the weight maintenance intervention are presented in Table 1.
Table 1. Demographic characteristics of adults who had previously lost ≥ 5 % weight and were randomised to either 150, 225 or 300 min/week of exercise during a 12-month weight maintenance intervention
(Number and percentages; mean values and standard deviations)
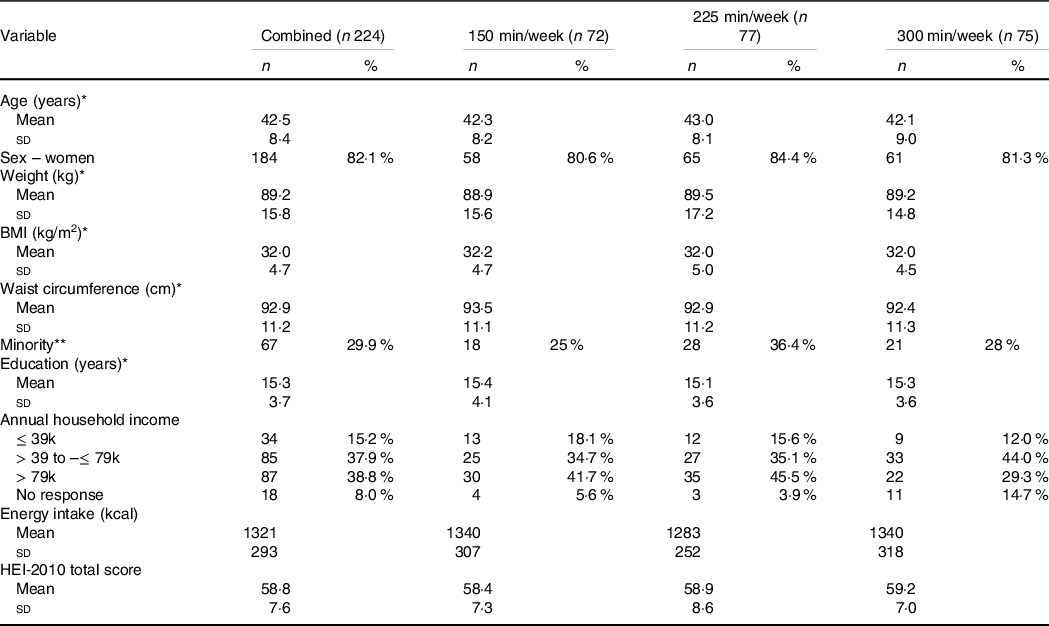
* Mean (standard deviation).
** Select a race other than non-Hispanic white.
Exercise completed
Participants randomised to the 150, 225 and 300 min/week groups completed 129 (sd 30), 153 (sd 49) and 179 (sd 62) min/week, respectively. Weekly exercise was higher in the 300 min/week group compared with 150 and 225 min/week groups, and in the 225 min/week compared with the 150 min/week group (all P < 0·0001). Weekly exercise minutes did not differ by sex (P = 0·63) and there was no evidence for a group by sex interaction (P = 0·67). The number of completed supervised (P = 0·16) or unsupervised exercise sessions (P = 0·054) did not differ by group. Approximately 60 % of weekly exercise minutes were completed under supervision. The average exercise intensity of all exercise sessions (supervised + unsupervised) was 76, 75 and 76 % in the 150, 225 and 300 min/week groups, respectively. Exercise session attendance across the 12-month intervention is presented in Fig. 1.

Fig. 1. Mean exercise session attendance in adults randomised to either 150, 225 or 300 min/week of exercise across a 12-month weight maintenance period. ![]() , 150 min/week;
, 150 min/week; ![]() , 225 min/week;
, 225 min/week; ![]() , 300 min/week.
, 300 min/week.
Behavioural sessions completed
Participants attended ∼67 % of the thirty scheduled behavioural sessions across 12 months: 150 min/week = 62 %, 225 min/week = 60 % and 300 min/week = 62 %. Behavioural session attendance did not differ by group (225 v. 150: P = 0·84; 300 v. 150: P = 0·26) and there was no impact of session attendance on EI (P = 0·87) or total HEI-2010 score (P = 0·75) at 12 months. Behavioural session attendance across the 12-month intervention is presented in Fig. 2.
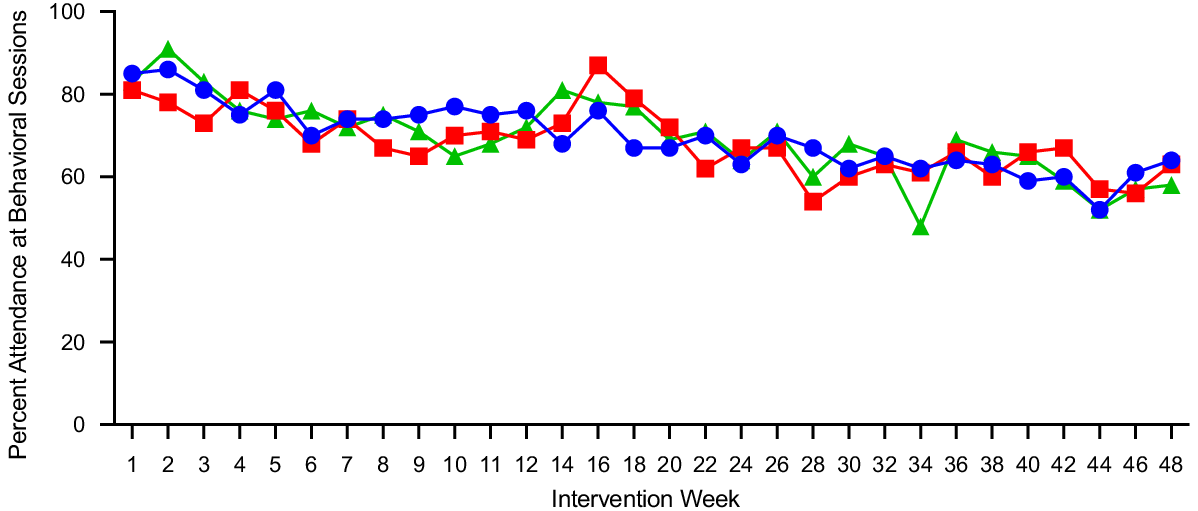
Fig. 2. Mean behavioural session attendance in adults randomised to either 150, 225 or 300 min/week of exercise across a 12-month weight maintenance period. ![]() , 150 min/week;
, 150 min/week; ![]() , 225 min/week;
, 225 min/week; ![]() , 300 min/week.
, 300 min/week.
Energy intake
Self-reported EI (kcal/d) over the 12-month intervention is presented in Figs. 3–4 and Table 2. Mixed modelling revealed that after adjusting for age and sex there was a time effect with EI increasing across time (β; 25·6; 95 % CI 16·3, 34·9; P < 0·0001). However, there was no evidence for group differences (225 min/week v. 150 min/week: –20·1; 95 % CI –160·6, 120·5; P = 0·77, 300 min/week v. 150 min/week: 25·3; 95 % CI –116·6, 167·1; P = 0·73) and only evidence for a group-by-time interaction in the 225 min/week group relative to 150 min/week group (225 v. 150: –12·9; 95 % CI –25·7, 0·22; P = 0·04, 300 min/week v. 150 min/week: –3·9; 95 % CI –16·8, 9·0; P = 0·55) in self-reported EI. However, when we combined all groups and examined the impact of cumulative MVPA assessed by accelerometer on changes in EI across time mixed modelling revealed that after adjusting for age, sex and group there was evidence for a time effect (20·4, P = 0·0002). While the estimate for the effect of cumulative MVPA on EI was positive, it was relatively small (1·08; 95 % CI 0·07, 2·1, P = 0·04).

Fig. 3. Changes in (a) weight (kg), (b) self-report energy intake (kcal/d), (c) HEI-2010 total score and (d) MVPA (min/d) in adults randomised to either 150, 225 or 300 min/week of exercise across a 12-month weight maintenance period. HEI-2010, Healthy Eating Index 2010; MVPA, moderate to vigorous physical activity. ![]() , 150 min/week;
, 150 min/week; ![]() , 225 min/week;
, 225 min/week; ![]() , 300 min/week.
, 300 min/week.
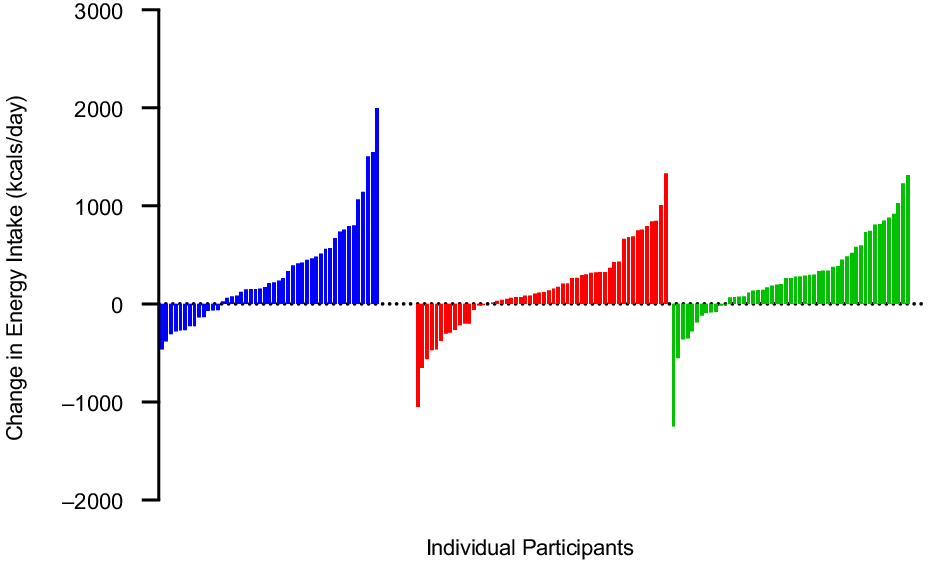
Fig. 4. Individual changes in self-report energy intake (kcal/d) from 0 to 12 months, in adults randomised to either 150, 225 or 300 min/week of exercise across a 12-month weight maintenance period. ![]() , 150 min/week;
, 150 min/week; ![]() , 225 min/week;
, 225 min/week; ![]() , 300 min/week.
, 300 min/week.
Table 2. Energy intake and HEI-2010 scores in adults randomised to either 150, 225 or 300 min/week of exercise across a 12-month weight maintenance period*
(Mean values and standard deviations)
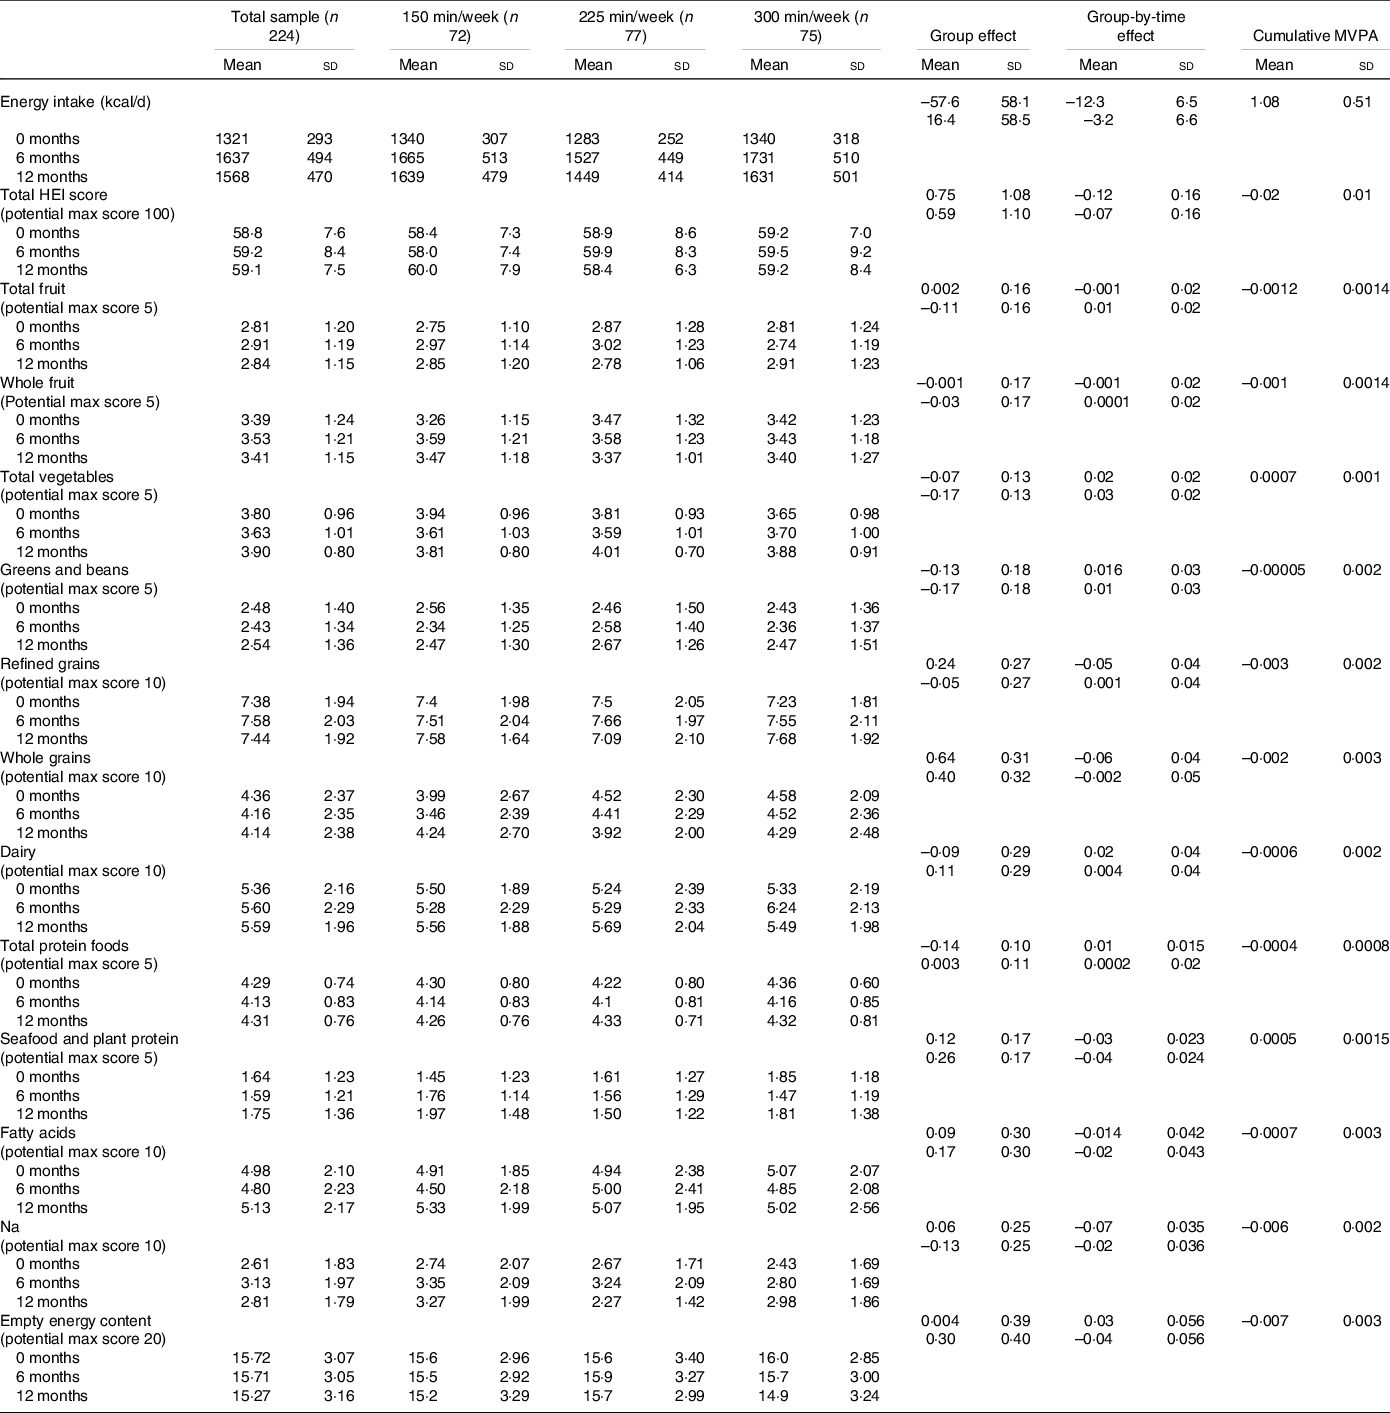
* Values for the group and group-by-time interaction are listed as first row (225 min/week relative to 150 min/week) and second row (300 min/week relative to 150 min/week). The models are adjusted for sex and age and have a random intercept for each subject.
Diet quality
Total Healthy Eating Index-2010 scores
Total HEI-2010 scores for the total sample and by group over the 12-month intervention are presented in Table 2. Mean baseline score for the total sample was 58·8 (sd 7·6). Mixed modelling revealed that after adjusting for age and sex there was no change in total HEI-2010 scores across the intervention (β: 0·08; 95 % CI 0·15, 0·32; P = 0·49). Additionally, there was no evidence for group differences (225 min/week v. 150 min/week: 0·75; 95 % CI −1·4, 2·9; P = 0·49, 300 min/week v. 150 min/week: 0·60; 95 % CI −1·6, 2·8; P = 0·58) or group-by-time interactions (225 min/week v. 150 min/week: −0·12; 95 % CI −0·42, 0·19; P = 0·44, 300 min/week v. 150 min/week: −0·07; 95 % CI −0·38, 0·24; P = 0·66). However, when we combined all groups and examined the impact of cumulative MVPA, assessed by accelerometer on changes in total HEI-2010 scores across time mixed modelling revealed that, after adjusting for age, sex, time, group and the group-by-time interaction there was evidence for an effect of cumulative MVPA (–0·02, P = 0·003). Although this effect was small, for every standard deviation increase in cumulative MVPA (∼ 46 min) we would expect HEI total score to decline by about 0·92 points (∼ 1·5 %).
Healthy Eating Index-2010 component scores
Each of the HEI-2010 components for the total sample and by group over the 12-month intervention is presented in Table 2. Mixed modelling revealed that after adjusting for age and sex there was no change in any of the HEI-2010 component scores across the intervention (all P > 0·05). Additionally, there was no evidence for group differences or group-by-time interactions for any of the component scores. When we combined all groups and examined the impact of cumulative MVPA, assessed by accelerometer, on changes in HEI-2010 cumulative scores across time, mixed modelling revealed that, after adjusted for age, sex, time, group and the group-by-time interaction there was evidence for an effect of cumulative MVPA on Na (–0·006, P = 0·002) and empty energy scores (–0·007, P = 0·004). Thus, for every standard deviation increase in cumulative MVPA (∼ 46 min) we would expect Na scores to decline by about 0·28 points (∼ 10 %) and empty energy scores to decline by 0·32 (∼2 %).
Impact of energy intake and Healthy Eating Index scores on change in weight
We examined the impact of cumulative EI, HEI-2010 total scores and HEI-2010 component scores on change in weight across the 12-month intervention. Mixed modelling revealed that after adjusting for age, sex, group randomisation and cumulative MVPA there was evidence of a relationship between cumulative daily EI and weight (β: 0·00187, 95 % CI 0·001, P = 0·003). There was no evidence for a relationship between HEI total score (β: −0·006, 95 % CI − 0·07, 0·06) or component scores (all P > 0·05) and change in weight across time.
Discussion
Participants increased their self-reported EI by ∼1255.2 kJ/d (∼300 kcal/d) and maintained their total HEI-2010 scores across the 12-month weight maintenance intervention. This increase in EI was expected since individuals had just completed a weight loss programme, which included reduced EI, and were recommended to increase their daily EI to levels appropriate for weight maintenance (∼1800 kcal/d). This change in EI is similar to an 18-month (6-month weight loss, 12-month weight maintenance) trial, conducted by our group, which utilised a similar diet intervention (e.g. portion control meals), an identical education curriculum, and compared phone to in-person weight management delivery in 295 individuals with overweight and obesity (BMI = 35·1 (sd 4·9), age = 43·8 (sd 10·2), minority = 39·8 %) and observed a mean EI increase of ∼837 kJ/d (∼200 kcal/d)(Reference Foright, Presby and Sherk21). Interestingly, in this previous study participants had a mean decrease of 8·9 points in total HEI-2010 scores across the 1-year weight maintenance period, while in the current study participants maintained their HEI scores across the 12-month intervention.
While the total sample demonstrated an increase in mean EI across the 12-month intervention, there was minimal evidence that exercise group randomisation influenced self-reported EI in individuals enrolled in a weight loss maintenance programme. The estimated group effects indicated self-reported EI in the 150 min/week group was higher than the 225 min/week group and lower than the 300 min/week group, providing additional evidence for the lack of a linear effect of group randomisation on self-reported EI. However, in all three groups, average weekly exercise minutes fell short of the recommendations, with participants randomised to the 150, 225 and 300 min/week groups only completing 129, 153 and 179 min/week, respectively. This range of exercise minutes (∼50 min/week) may have limited our ability to see group differences. To overcome this limitation and better examine the association between physical activity and diet intake, we combined all groups and examined the impact of cumulative MVPA, assessed by accelerometry, on self-reported EI. Our results suggest that increased MVPA is associated with a slight increase in EI over time. However, this association is small; for each standard deviation increase in cumulative MVPA (∼ 46 min) EI increased by 209 kJ/d (50 kcal/d;∼3 %). Additionally, this increase in EI was associated with minimal changes in weight, for example, for every standard deviation increase in daily EI (∼ 1787 kJ/d (427 kcal/d)) we would expect weight to increase by only 0·43 kg.
We are unaware of previous studies that included individuals who were enrolled in a weight loss maintenance programme, or which measured physical activity rather than exercise to be able to compare our results. Our findings are most comparable to the results by Martin et al.(Reference Martin, Johnson and Myers22) in 171 individuals with overweight or obesity (BMI = 31·5 (sd 4·7), age = 48·9 (sd 11), minority = 33·3 %) which reported individuals who exercised at levels that expended 33.5 and 83.7 kJ/kg per week had a 3·9 and 5·5 % increase in EI, assessed by doubly labelled water, across the 6-month intervention. However, the results of Martin et al. differ from previous randomised and non-randomised trials conducted by our group(Reference Snyder, Donnelly and Jabobsen34–Reference Washburn, Honas and Ptomey37) and others(Reference Cox, Burke and Morton38–Reference Martins, Kulseng and King45) which found no impact of increased exercise or physical activity on EI. These inconsistent findings may be due to a variety of study design differences including the measurement of exercise v. total daily physical activity, different exercise parameters (e.g. mode, frequency, intermittent v. continuous, time of day), participant characteristics (e.g. age, body weight/composition, race/ethnicity and aerobic capacity) and type of EI assessment (e.g. self-report, direct observation, doubly labelled water).
In the current study, there was no evidence of differences in HEI scores between group randomisation; however, there was an effect of cumulative MVPA on changes in total HEI-2010 scores as well as Na scores and empty energy content (a measure of the percentage of total energy content from added sugar and saturated fat). This suggests that individuals enrolled in a weight management intervention who engage in more MVPA may be more likely to consume slightly more empty energy content (i.e. added sugar and saturated fat) and Na. However, like EI, this association was small; a 36-min increase in MVPA was only associated with a 0·75 decrease in total HEI-2010 scores. Furthermore, there was no relationship between HEI and changes in weight, suggesting that any decrease in HEI that may be observed in relationship to increased MVPA does not impact weight. These results are in slight contrast with one previous study, by our group, which examined the effect of exercise training on changes in HEI-2010(Reference Washburn, Honas and Ptomey37). In the previous study, 141 previously sedentary, overweight/obese young adults were randomised to two levels of energy expenditure (supervised exercise, 5 days/week at 1674 and 2510 kJ/session) or a non-exercise control for 10 months. Dietary intake was assessed at baseline, 3·5, 7 and 10 months over 7-d periods of ad libitum eating in a university cafeteria using digital photography plus recall methodology(Reference Ptomey, Willis and Honas46). There were no significant between- or within-group differences in HEI-2010 scores in the total sample, or in men or women. The HEI-2010 score averaged across all time periods was 37·6 (sd 8·9), 35·6 (sd 8·4) and 36·7 (sd 8·5) for the 1674 kJ/session, 2510 kJ/session and control groups, respectively. However, participants were college students who were required to eat in a university cafeteria, and thus these results may not apply to the average adult population.
One major difference between the current study and previous studies is that participants were enrolled in a weight maintenance intervention and intentionally trying to maintain their body weight through their eating and exercise habits, whereas previous trials included individuals who had not previously lost clinically significant weight (≥ 5 %). Previous findings suggest that there may be physiological adaptations in response to weight loss that elevate appetite and may contribute to increased EI and subsequent weight regain(Reference MacLean, Higgins and Wyatt12,Reference Cornier13) . Compensatory physiological adaptations following diet-induced weight loss include decreases in energy expenditure, fat oxidation and anorexigenic hormone (e.g. leptin) levels and increases in appetite, craving and orexigenic hormone levels (e.g. ghrelin)(Reference Greenway47). Preclinical research in rat models suggests that increased exercise may counter the biological drive to increase EI in order to regain lost weight(Reference MacLean, Higgins and Wyatt12,Reference Foright, Presby and Sherk48) . Our results showed a small increase in EI (1255 kJ (300 kcal)) during a weight maintenance period, following weight loss > 5 % of body weight. Suggesting that a weight maintenance programme that includes increased MVPA may mitigate the increased EI and decreased diet quality typically associated with weight loss. However, all individuals in this trial were in an active weight management intervention and were only followed for 12 months; thus, our results need to be interpreted with caution.
Previous research also suggesting behavioural strategies used to induce weight loss is commonly employed in a transient manner and adherence generally wanes as weight loss plateaus, often leading to weight regain(Reference MacLean, Wing and Davidson11). The current study observed decreased MVPA and behavioural session attendance from 6 to 12 months, the same period when weight regain was the highest. Interestingly, HEI and EI appeared to remain fairly stable (±418 kJ (100 kcal)) during this time period. However, given limitations self-reported dietary intake, and the lack of additional factors that may be associated with weight gain, such as changes in mood and life stressors(Reference Gilbert, Drapeau and Astrup49), no conclusions can be drawn from these results. Future research is needed to determine what factors (e.g. diet, EI, behavioural session attendance) are associated with weight regain across time.
Strengths of the current investigation include the use of a randomised design, a weight maintenance intervention 12 months in length and the use of objectively measured physical activity. However, this study is limited in that it was not specifically designed to detect differences in self-reported dietary intake either within or between intervention groups. Additionally, dietary intake was assessed by self-report food records, which may not provide data of sufficient quality to adequately address this question(Reference Schoeller, Thomas and Archer50). Finally, all participants were randomised to an exercise intervention; thus, there was no control group to compare these results against. Therefore, we recommend additional randomised trials to specifically evaluate the impact of exercise training on EI and diet quality during weight maintenance that: 1) are powered to detect clinically significant differences in EI and/or diet quality; 2) utilise state-of-the-art techniques for the assessment of EI such as direct observation weigh and measure, image-assisted recalls or doubly labelled water and provide multiple measures across the duration of the study; 3) include a per-protocol study design where participants are required to complete their assigned exercise prescription; 4) evaluate both the effect of exercise parameters (e.g. mode, frequency, intensity duration, time course) and participant characteristics (e.g. age, sex, body weight, activity level, ethnicity) on the association between exercise and EI and diet quality.
In summary, we found minimal evidence that exercise group randomisation (150, 225 or 300 min/week) influences self-reported EI or changes in diet quality in adults with overweight or obesity who had achieved ≥ 5 % weight loss and were enrolled in a weight loss maintenance programme. Evidence suggests that increased MVPA, measured by accelerometer, is associated with slightly increased EI and decreased diet quality. However, these associations are not clinically relevant and do not appear to significantly impact weight.
Acknowledgements
The authors would like to acknowledge Jeffery Honas, Jeannine Goetz, Felicia Steger, Chris Bessmer, Erik Willis, Matt Schubert, Lisa Haney, and all the participants of the MET-POWER study.
This work was supported by the National Heart, Lung, and Blood Institute (R01HL11842).
The authorship of this manuscript received the following contributions: L. T. P., A. M. G., A. S. R., R. A. W., D. K. S. and J. E. D contributed to project design and data analysis; R. N. M. statistical analysis; L. T. P., R. N. M., A. M. G., A. S. R., R. A. W., M. H., R. N. S. F., D. K. S. and J. E. D final review, manuscript presentation and critical review of the manuscript for important intellectual content; L. T. P., A. N. S. R., D. K. S., R. A. W. and J. E. D. with the conduct of the clinical trial and outcomes assessment.
The authors declare that there are no financial or non-financial conflicts of interest.


