


Background
In most developed countries, the population is aging, and the number of older drivers and their driving mileage per year is growing rapidly (Eby & Molnar, Reference Eby and Molnar2009). Drivers 70 years of age and older have a higher crash rate per kilometer driven and higher rates of severe injury and fatal crashes than middle-aged drivers (Cicchino & McCartt, Reference Cicchino and McCartt2014). Many older drivers consciously or unconsciously adopt a number of driving modifications, such as avoiding driving in heavy rain or on highways (Bergen et al., Reference Bergen, West, Luo, Bird, Freund and Fortinsky2017), which were found to be beneficial for decreasing involvement in crashes. One study showed that among a group of older drivers with poor driving skills, those who used a larger number of driving modifications had significantly fewer self-reported at-fault crashes than those who used fewer driving modifications (de Raedt & Ponjaert-Kristoffersen, Reference Raedt and Ponjaert-Kristoffersen2000). Nevertheless, not all older drivers adopt self-regulatory behaviours to maintain their safety.
The accuracy of people’s self-awareness of their driving ability may be an important factor influencing self-regulatory behaviours (Marottoli & Richardson, Reference Marottoli and Richardson1998). Lack of self-awareness, or anosognosia, is a phenomenon commonly studied among people with traumatic brain injury, dementia, stroke, and other neurological diseases (Chavoix & Insausti, Reference Chavoix and Insausti2017). Many clients with these neurological conditions have no or only partial knowledge about their own impairments and consequent impact on functional abilities and performance (Goverover, Chiaravalloti, Gaudino-Goering, Moore, & DeLuca, Reference Goverover, Chiaravalloti, Gaudino-Goering, Moore and DeLuca2009; Okonkwo et al., Reference Okonkwo, Griffith, Vance, Marson, Ball and Wadley2009). Without self-awareness, they are likely to overestimate their abilities and skills in various activities of daily living (ADL), leading to both high risk exposure and low motivation towards necessary behavioural or environmental modifications (Gillen, Reference Gillen2009; Lindstrom, Eklund, Billhult, & Carlsson, Reference Lindstrom, Eklund, Billhult and Carlsson2013).
The perception of one’s own driving ability may not be accurate, as is shown by a recent study in which the majority of older adults reported that their driving ability was better than that of other drivers of the same age or “average drivers”, whereas their actual driving ability varied (Freund, Colgrove, Burke, & McLeod, Reference Freund, Colgrove, Burke and McLeod2005; Marottoli & Richardson, Reference Marottoli and Richardson1998; Selander, Lee, Johansson, & Falkmer, Reference Selander, Lee, Johansson and Falkmer2011). It is not problematic for drivers to rate themselves as very good drivers if, in fact, they do drive well, as this would indicate an accurate estimation of their competent driving ability. However, it could be detrimental if drivers overestimate their driving ability and then drive in a way that exceeds their ability to control their vehicle in a challenging environment. In one study using a driving simulator to test older drivers who were referred to driving rehabilitation clinics, Freund et al. (Reference Freund, Colgrove, Burke and McLeod2005) found that those who overestimated their driving ability were four times more likely to fail the driving test than those who rated their driving ability the same or worse than that of other drivers of the same age. On the other hand, there was a smaller group of older drivers who underestimated their driving ability, causing early, unnecessary driving limitations or cessation (Meng & Siren, Reference Meng and Siren2012), limiting the frequency and freedom of their outdoor mobility activities and social participation (Marottoli et al., Reference Marottoli, de Leon, Glass, Williams, Cooney and Berkman2000).
Self-perception of driving ability is only an indication of people’s belief in their own ability, which may or may not be an accurate assessment of their actual level of driving performance, and it is this accuracy of self-awareness that may influence a driver’s outdoor mobility and safety. Accuracy is the congruence between an individual’s perceived and actual driving ability, and both overestimation and underestimation in this area would negatively impact the driver. In order to maintain safety without compromising outdoor mobility, it is important that older drivers’ perceived driving ability be congruent with their actual driving performance and that it change over time in accordance with physical and cognitive changes, enabling them to adopt effective driving modifications.
Most studies on this topic have not found a correlation between older adults’ perceived driving ability and their actual driving performance (Brown et al., Reference Brown, Ott, Papandonatos, Sui, Ready and Morris2005; Hunt, Morris, Edwards, & Wilson, Reference Hunt, Morris, Edwards and Wilson1993; Marottoli & Richardson, Reference Marottoli and Richardson1998; Riendeau, Maxwell, Patterson, Weaver, & Bedard, Reference Riendeau, Maxwell, Patterson, Weaver and Bedard2016; Selander et al., Reference Selander, Lee, Johansson and Falkmer2011), but the approaches used to measure the accuracy of self-awareness may not have provided a valid measure of perceived driving ability and actual driving performance. Many previous studies asked older drivers to compare their driving ability to that of others (Broberg & Dukic Willstrand, Reference Broberg and Dukic Willstrand2014; Freund et al., Reference Freund, Colgrove, Burke and McLeod2005; Selander et al., Reference Selander, Lee, Johansson and Falkmer2011; Windsor, Anstey, & Walker, Reference Windsor, Anstey and Walker2008). Requiring individuals to appraise their own ability and compare with that of others is called “social comparison”. Literature in cognitive psychology has found that a better-than-the-others answer in social comparisons is common in human nature (Reisberg, Reference Reisberg2013). Several theories have been published to explain this phenomenon, including optimism bias, self-enhancement bias, downward comparisons, and illusory superiority (Groeger, Reference Groeger2000; Sundström, Reference Sundström2008). Approximately 70 per cent of older drivers perceived their driving ability to be better than others’ (Marottoli & Richardson, Reference Marottoli and Richardson1998; Selander et al., Reference Selander, Lee, Johansson and Falkmer2011), even though some participants were recruited from driving rehabilitation clinics where their driving ability had already been questioned (Freund et al., Reference Freund, Colgrove, Burke and McLeod2005). Questions requiring social comparisons are likely to result in inaccurate judgement of one’s own ability, and, therefore, may not serve as the best assessment tool for older drivers’ subjective measure of driving ability.
Some studies used only one general question to measure drivers’ self-perception (e.g., rate the quality of your driving) (Ackerman, Vance, Wadley, & Ball, Reference Ackerman, Vance, Wadley and Ball2010; Brown et al., Reference Brown, Ott, Papandonatos, Sui, Ready and Morris2005; Ross, Dodson, Edwards, Ackerman, & Ball, Reference Ross, Dodson, Edwards, Ackerman and Ball2012; Wild & Cotrell, Reference Wild and Cotrell2003; Wong, Smith, & Sullivan, Reference Wong, Smith and Sullivan2012; Wood, Lacherez, & Anstey, Reference Wood, Lacherez and Anstey2013), whereas others adopted questionnaires which were not specifically designed to assess perception of driving ability (Pachana & Petriwskyj, Reference Pachana and Petriwskyj2006). For example, the Deficit Awareness Questionnaire that addresses one’s perceived abilities in memory, attention, and everyday activities has been administered to older drivers and their families to examine their self-awareness of driving performance (Green, Goldstein, Sirockman, & Green, Reference Green, Goldstein, Sirockman and Green1993; Wild & Cotrell, Reference Wild and Cotrell2003). Although these questions address aspects of driving ability, they are not likely to guide individuals to reflect on their driving performance in different driving conditions and respond specifically about their driving abilities, because self-awareness is “object-dependent”, meaning that one’s accurate self-perception in one domain does not imply correctness in another (Toglia & Kirk, Reference Toglia and Kirk2000). For example, Marková et al. (Reference Marková, Clare, Whitaker, Roth, Nelis and Martyr2014) reported that the levels of accuracy of self-awareness of memory functioning, ADL, and socio-emotional functioning are significantly different from each other among older adults with early-stage dementia. Therefore, it is important to adopt a reliable and valid questionnaire specifically designed to assess older drivers’ perception of driving ability.
Several available measures have the potential to be used among older drivers; however, one questionnaire is only suitable for clients referred to driving rehabilitation centres (i.e., DriveAware) (Kay, Bundy, & Clemson, Reference Kay, Bundy and Clemson2009), whereas others were only tested among clients with neurological conditions (i.e., Brain Injury Driving Self-Awareness Measure for clients with brain injury, and Adelaide Driving Self-Efficacy Scale for clients with stroke) (George, Clark, & Crotty, Reference George, Clark and Crotty2007; Gooden et al., Reference Gooden, Ponsford, Charlton, Ross, Marshall and Gagnon2017), or younger adults (i.e., Driving Skill Inventory and Driving Self-Evaluation Questionnaire) (Amado, Arikan, Kaca, Koyuncu, & Turkan, Reference Amado, Arikan, Kaca, Koyuncu and Turkan2014; Lajunen & Summala, Reference Lajunen and Summala1995). The Perceived Driving Ability Questionnaire (PDA) was designed with and for typical older drivers, and examines their perceived driving ability in several common driving scenarios. This assessment tool has been validated with a group of older drivers using Rasch analysis (MacDonald, Myers, & Blanchard, Reference MacDonald, Myers and Blanchard2008), and is the best available tool to investigate the perceived driving ability of older drivers.
In the literature, standard on-road driving evaluations are typically used to determine the accuracy of one’s self-awareness of driving ability. This method is frequently adopted, and is considered the gold standard for measuring driving performance (Di Stefano & Macdonald, Reference Di Stefano and Macdonald2006) as it is free from the subjective bias of proxy-reported driving abilities (Fawcett, Reference Fawcett2013). However, because of the strict guidelines of the testing methods and conditions, such as using an unfamiliar vehicle and driving on designated routes guided by a driving instructor in a car with a dual brake, the test results may not represent an older driver’s everyday driving performance, which could be impacted by these conditions (Lundberg & Hakamies-Blomqvist, Reference Lundberg and Hakamies-Blomqvist2003). In addition, the standard on-road driving evaluation lacks ecological validity, which is the ability to demonstrate older drivers’ everyday driving ability (Chen, Gélinas, & Mazer, Reference Chen, Gélinas and Mazer2018). Older drivers who have an accurate awareness of their diminishing driving ability may modify their choice of driving conditions and routes, and may not drive in conditions presented during the standard on-road evaluation. When asking older drivers to appraise their driving ability, their response relates to their everyday driving, which may not correspond to their driving during a standard on-road evaluation.
Several factors may be associated with the accuracy of older drivers’ self-awareness of their driving ability. Older age was found to be related to overestimation of driving ability (Marottoli & Richardson, Reference Marottoli and Richardson1998). One study reported that older drivers with better cognitive functioning, and more specifically, executive functioning, tended to accurately estimate or underestimate their driving ability (Wood et al., Reference Wood, Lacherez and Anstey2013); however, two other studies did not find these same associations (Broberg & Dukic Willstrand, Reference Broberg and Dukic Willstrand2014; Freund et al., Reference Freund, Colgrove, Burke and McLeod2005). These inconsistent results may be related to the varied methods used to measure objective and perceived driving ability. In addition, female gender and depressive mood were found to be related to lower perceived driving ability (Selander et al., Reference Selander, Lee, Johansson and Falkmer2011), but how these factors influence the accuracy of estimations in actual driving performance has not yet been studied.
The primary objective of this study was to determine the accuracy of older drivers’ self-awareness of driving ability in their everyday driving environment as measured by a naturalistic driving observation. Self-awareness is defined as the congruence between an individual’s perceived driving ability (as measured by the PDA) and actual driving ability (as measured by the electronic Driving Observation Schedule [eDOS]). As the construct of self-awareness is quite complex (for a detailed review, see Toglia & Kirk, Reference Toglia and Kirk2000), this study focused on one aspect of self-awareness: general knowledge and belief regarding one’s driving ability. The secondary objective was to determine the relationship between demographic characteristics (i.e., age, gender, and educational level) and clinical factors (i.e., visual, cognitive, psychomotor, and executive functioning; mood; and comorbid conditions) with self-awareness of driving ability.
Methods
Study Design
This cross-sectional study was built on the infrastructure of the Candrive national longitudinal cohort study on driving in older adults (The study protocol was presented elsewhere, see Marshall et al., Reference Marshall, Man-Son-Hing, Bédard, Charlton, Gagnon and Gélinas2013).
Participants
All participants from three of the Candrive research sites; Montreal, Ottawa, and Hamilton, participated in this current study. The inclusion criteria were: community-dwelling drivers 75 years of age and older, holding of a valid driving license and driving at least once a week, under the care of a family physician, and English speaking. Participants were excluded if they had a severe contraindication to driving before the completion of the study, if their Candrive annual assessments were administered more than 200 days before or after the driving observation, or if their Perceived Driving Ability questionnaire was not completed within 90 days of the driving observation. The latter two exclusion criteria were adopted because participants’ clinical functioning conditions were retrieved from the Candrive annual assessments to reflect participants’ functional conditions on the day of the driving observation. The date interval was determined based on two longitudinal studies (Koppel et al., Reference Koppel, Charlton, Richter, Di Stefano, Macdonald and Darzins2017; Rapoport et al., Reference Rapoport, Sukhawathanakul, Naglie, Tuokko, Myers and Crizzle2016) which showed that older drivers from the Candrive study, regardless of their age, gender, and education level, have stable cognitive functional performance and perceived driving ability over one year.
Procedure
Participants in the driving observation study were recruited by Candrive research assistants at each site in their fifth or sixth year of the study. The research assistants explained the purpose and procedures of this current study to eligible participants. Those who agreed to participate were given an appointment to conduct the driving observation. Recruitment continued until the target sample size of 50 participants from each site was reached.
On the day of observation, two research assistants visited the participant’s home, which might be in a rural, suburban, or urban area. Drivers were asked to sign a consent form and complete the PDA questionnaire, followed by an explanation of the naturalistic observation of their driving behaviour in their everyday environment. Participants were asked to nominate two destinations where they usually visit, choose the route to reach them, and plan to come back home within 20–25 minutes. To record their naturalistic driving behaviour, participants drove their own vehicles and were encouraged to drive as they would usually do, including driving with a “co-pilot” passenger or listening to the radio, if that was their routine. During the observation, the two research assistants followed the participant in another vehicle. One research assistant drove the following car, while the other sat in the front passenger seat and observed and recorded the participant’s driving behaviour and environment using the eDOS. If certain participants usually avoid driving in certain weather conditions, such as heavy rain or fog, they were given the option of rescheduling their driving observation. Because of logistic constraints, some participants did not complete the PDA questionnaire on the day of the driving evaluation. In this case, their PDA score was retrieved from the Candrive annual assessment database if the interval between the two evaluations was within 90 days. If not, those participants were excluded.
The data of independent variables, including demographic information (i.e., age, gender, and educational level) and clinical factors, were retrieved from the Candrive annual evaluation database. Data were collected from the date closest to the date of the driving observation for each participant.
Measurements
The primary outcome measure of older drivers’ self-awareness of driving ability was derived from the correspondence between perceived driving ability (measured by the PDA) and actual driving ability (measured by the eDOS) (See data analysis section for more details).
eDOS
The eDOS (Vlahodimitrakou et al., Reference Vlahodimitrakou, Charlton, Langford, Koppel, Di Stefano and Macdonald2013) is an observational tool designed to monitor older drivers’ driving performance in their naturalistic environment over time. Using the eDOS scoring sheet, driving behaviours and the environment at each maneuver are systematically recorded on a tablet. Driving maneuvers are categorized as either intersection negotiation, lane-changing, merging, maneuver-free driving, or low speed maneuvers. Within each driving maneuver category, corresponding environmental and behavioural variables are recorded. For example, the type of traffic sign or light, driving direction (i.e., going straight through or making a left/right/U-turn), number of lanes, speed limit, and traffic volume are the environmental variables recorded at each intersection. Driving behaviours are coded as appropriate or inappropriate in the following six categories: observation of road environment (no mirror use or no head checking), signalling, speed regulation (too fast or too slow), gap acceptance (missed opportunity, unsafe gap, or failure to yield), road rule compliance (non-compliance with traffic signage or crossing pavement), vehicle or lane position (lane drifting, hitting curb, or inappropriate following distance). In addition, critical driving errors are noted when the participant is involved in a crash or near-crash. Operational definitions of all these factors are provided in a detailed eDOS administration manual (Candrive Research Team, Reference Team2017).
Using the eDOS recordings, a weighted eDOS total score was calculated to represent a driver’s overall eDOS driving performance. This score was generated by summing weighted driving errors (from 1 = low-risk error to 3 = high-risk error) based on the error type and risk level in corresponding maneuver/environments. Lower weighted eDOS total scores indicate better driving performance, whereas higher scores imply that the driver either committed some severe errors (e.g., choosing an unsafe gap during a lane change on a boulevard) or demonstrated several bad driving habits (e.g., no signalling on quiet residential streets for a right turn). The weighting system of the score was developed based on a literature review and a two-round online survey with experts in the field of driving rehabilitation (for details, see Chen, Reference Chen2018).
The non-electronic version of the eDOS has been shown to have good reliability and internal consistency (intraclass correlation coefficient [ICC] = 0.905, 95% confidence interval [CI] = 0.747–0.965, p < 0.0001; r(18) = 0.83, p < 0.05) (Vlahodimitrakou et al., Reference Vlahodimitrakou, Charlton, Langford, Koppel, Di Stefano and Macdonald2013). The eDOS itself was acceptable to participants and feasible to administer for observers, and it was found to be representative of older drivers’ everyday driving routes in an Australian sample (Koppel et al., Reference Koppel, Charlton, Langford, Vlahodimitrakou, Di Stefano and Macdonald2013). This evaluation method has reliability and face validity, as well as ecological validity (Koppel et al., Reference Koppel, Charlton, Langford, Di Stefano, MacDonald and Vlahodimitrakou2016).
PDA: Current ability
Participants’ self-perception of their current driving ability was measured using the PDA questionnaire. This questionnaire is composed of 15 items asking participants to report their perception of their current ability in both general and specific driving conditions, such as the ability to drive safely, or the ability to see a road sign or make quick decisions. Their ratings are coded from 0 (poor) to 3 (very good). Total scores range from 0 to 45, with higher scores indicating better self-rated driving ability. Missing data are replaced by the total mean score, mean score of certain items, or discarded, according to a guideline published by the primary author of this questionnaire (Myers, Reference Myers2008). The tool has moderate test-retest reliability (ICC = 0.65) and good internal consistency (α = 0.92) (Blanchard & Myers, Reference Blanchard and Myers2010). Rasch analysis shows that this questionnaire is unidimensional and hierarchical with good person and item reliability (0.92 and 0.96, respectively) (MacDonald et al., Reference MacDonald, Myers and Blanchard2008).
Demographic and clinical factors
Demographic characteristics included age, gender, and education level. Clinical measures of visual acuity, cognition, psychomotor skills, executive functioning, mood, and co-morbid conditions were selected because they have shown some association with on-road driving performance and are commonly used in driving studies (Smith et al., Reference Smith, Marshall, Porter, Ha, Bedard and Gélinas2013):
Snellen Test
The Snellen Test measures visual acuity. Using a traditional Snellen eye chart, participants were asked to read the letters of 11 different font sizes using both eyes at a 3 m (10 foot) distance. Visual acuity was scored as 10/X, where X was the corresponding number at the line where the participant was able to read without any errors. Normal visual acuity is indicated by a result of 10/10, whereas a lower number implies reduced vision, and the lowest legal standard for drivers in Canada is 4/10 with both eyes open (Yazdan-Ashoori & Hove, Reference Yazdan-Ashoori and Hove2010). The Snellen test has high test–retest reliability (r = 0.94) (Lovie-Kitchin, Reference Lovie-Kitchin1988).
Montreal Cognitive Assessment (MoCA)
The MoCA is a general test of cognition which evaluates executive functions, naming, orientation, attention, language, memory, visuo-constructional skills, and conceptual thinking. The maximum score is 30 points. According to a recent meta-analysis, the cut-off score of 23 for the education-adjusted MoCA total score is used to diagnose older adults with mild cognitive impairment, and this score was applied to describe the cognitive functioning of our sample (Carson, Leach, & Murphy, Reference Carson, Leach and Murphy2018). The cut-off score of ≤ 25 in MoCA total score has a sensitivity of 84.5 per cent and a specificity of 50 per cent to discriminate safe and unsafe older drivers (Kwok, Gélinas, Benoit, & Chilingaryan, Reference Kwok, Gélinas, Benoit and Chilingaryan2015).
Motor Free Visual Perception Test-3 (MVPT-3): Visual closure subtest
Participants’ visuo-spatial ability to identify partially obscured objects was measured using the MVPT-3 visual closure subtest (Colarusso & Hammill, Reference Colarusso and Hammill2003). Participants were asked to match the target figure to one of four incomplete drawn objects. Thirteen figure cards were presented, and accuracy was recorded by the number of correct answers (maximum = 13). Although no studies have reported the psychometric property of this single item in the MVPT-3 among older drivers, one study reported that the performance of the visual closure subtest in an earlier version, MVPT, is associated with future at-fault vehicle crashes for drivers 55 years of age and older (Ball et al., Reference Ball, Roenker, Wadley, Edwards, Roth and McGwin2006).
Trail Making Test (TMT)
The TMT test examines visual search, scanning, psychomotor speed, mental flexibility, and executive functioning (Bowie & Harvey, Reference Bowie and Harvey2006; Reiten, Reference Reiten1958). The TMT Part A requires participants to connect 25 numbers that are randomly distributed on a page in numerical order, whereas part B asks participants to draw lines alternatively between numbers and letters in sequential order (e.g. 1, A, 2, B, 3, C). Participants are told to finish the two tasks as quickly and as accurately as possible. Times to complete in TMT part A and B are recorded to represent visuo-motor processing speed. The TMT has good to high reliability measured by a coefficient of concordance (r=.78 for part A and r=.67 for part B) (Lezak, Reference Lezak1983).
Timed Up and Go (TUG)
The TUG examines functional mobility (Podsiadlo & Richardson, Reference Podsiadlo and Richardson1991; Shumway-Cook, Brauer, & Woollacott, Reference Shumway-Cook, Brauer and Woollacott2000). Participants are required to stand up from an armchair, walk 3 m (10 feet), and return to the seated position. Time taken to complete the test is recorded. The TUG has good inter-rater and intra-rater reliability, as well as excellent construct validity with the Berg Balance Scale (r = -0.81), gait speed (r = -0.61), and the Barthel Index of ADL (r = -0.78) (Podsiadlo & Richardson, Reference Podsiadlo and Richardson1991).
Modified Cumulative Illness Rating Scale (mCIRS)
The mCIRS assesses one’s multi-morbidity by taking account of the number and severity of medical conditions (Hudon, Fortin, & Soubhi, Reference Hudon, Fortin and Soubhi2007; Hudon, Fortin, & Vanasse, Reference Hudon, Fortin and Vanasse2005). Participants rate the severity of their medical problems on a five-point scale from 0 (no problem) to 4 (extremely severe problem) in 14 organs or body functions. The total score ranges from 0 to 56. The mCIRS has good inter-rater reliability (ICC = 0.81), intra-rater reliability (ICC = 0.89), and concomitant validity (r = 0.73–0.84) (Hudon et al., Reference Hudon, Fortin and Vanasse2005).
Geriatric Depression Scale (GDS)
Participants’ depressive symptoms were examined using the GDS-15 (Yesavage et al., Reference Yesavage, Brink, Rose, Lum, Huang and Adey1983). This version of the GDS consists of 15 items about one’s mood and energy over the past week. Participants are encouraged to choose the best fitting answer between yes and no. The GDS score ranges from 0 to 15; higher scores indicate a greater depressive condition. The GDS has good reliability (r = 0.76) (van Marwijk et al., Reference Marwijk, Wallace, Bock, Hermans, Kaptein and Mulder1995). In this study, participants were dichotomized into a depressive group (≥ 5 points) and a normal group (< 4 points).
Statistical Analysis
Data derived from the eDOS, PDA questionnaire, and the Candrive database were compiled and organized using the SPSS 24.0 software.
The numbers and distribution for participants’ demographic information, predictive variables, and outcome variables were examined using descriptive analysis: means and standard deviations (SDs) were reported for continuous variables; number and percentages were calculated for dichotomous and categorical variables. The distributions of normality of continuous variables were examined using kurtosis and skewness tests in the SPSS package. Variables that violated normal distribution were analysed using appropriate non-parametric tests. The differences among the three research sites were compared using a χ2test for dichotomous variables, Kruskal–Wallis analysis of variance (ANOVA) for ordinal variables, and ANOVA for continuous variables. The Scheffe method was administered for post-hoc comparisons among continuous variables.
To describe the accuracy level of older drivers’ self-awareness of driving ability, a new variable was created. This variable was rated on an ordinal scale that categorized participants into either the underestimated, accurate, or overestimated group, which was determined by the correspondence between the participants’ perceived driving ability (i.e., the total score on the PDA questionnaire) and their actual driving performance (i.e., the weighted eDOS total score). Because the PDA and eDOS scores are on continuous scales, cut-off scores were applied to classify participants’ PDA and eDOS scores into three levels. The eDOS cut-off scores were determined at the 25th and 75th percentile of the distribution of eDOS scores to emphasize the differences in participants’ on-road driving performance, and the driving performance of 50 per cent of the group was classified as middle range. This method was based on a research paradigm from a series of studies of self-awareness of psychology (Kruger & Dunning, Reference Kruger and Dunning1999). The PDA cut-off scores were determined by a review of the literature and experts’ judgement. After an examination of the data, the cut-off scores determined to classify the participants’ perceived and actual driving ability were 29 and 35 for the PDA; 10 (25th percentile) and 28 (75th percentile) for the eDOS. Participants whose perceived and actual driving ability corresponded were categorized into the “accurate” self-awareness of driving ability group; those who rated themselves higher than their actual driving performance were categorized into the “overestimated” group; and those who rated themselves worse than their actual driving performance level were categorized into the “underestimated” group (Table 1). The order of this ordinal outcome measure was underestimator < accurate estimator < overestimator with unknown between-group intervals.
Table 1: Classification of accuracy of self-awareness of driving ability
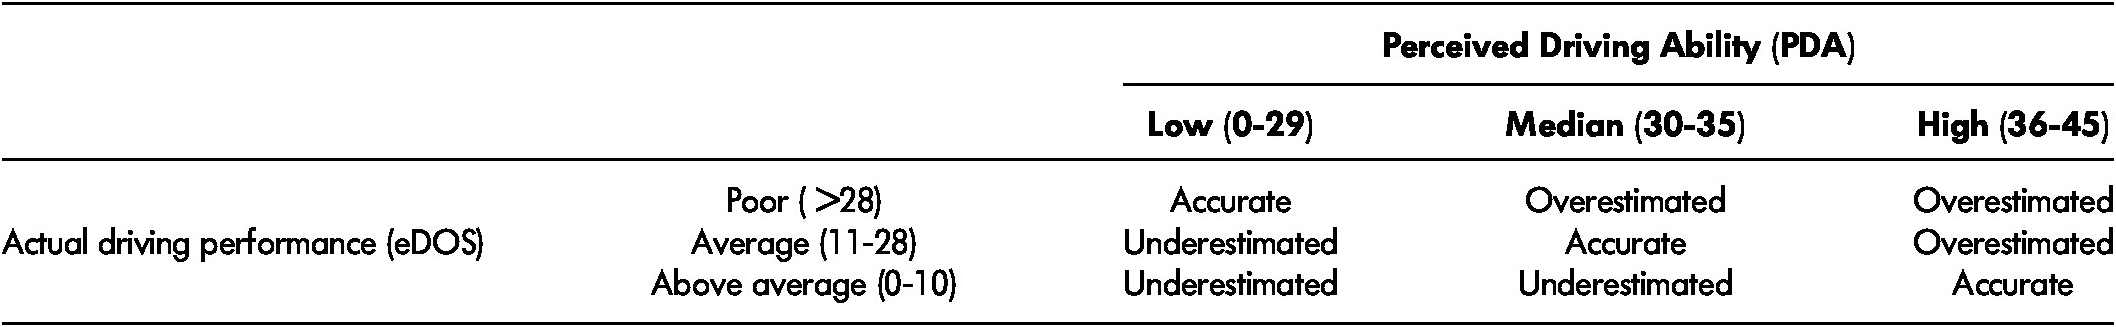
Note. eDOS = electronic Driving Observation Schedule.
To examine the extent to which demographic characteristics and clinical functioning were associated with self-awareness of driving ability, an ordinal logistic regression was conducted. This is a suitable statistical method to estimate the probability of having a certain outcome on an ordinal scale (i.e., the accuracy level of self-awareness of driving ability) from one or more predictive variables (i.e., the demographic and clinical functioning factors) (Portney & Watkins, Reference Portney and Watkins2009). The assumptions of this statistical analysis method were examined individually. To avoid violating the assumption of collinearity, a Pearson correlation matrix was calculated. The assumption of having proportional odds was examined by test of parallel lines to ensure that the predictive model had the same effect on different level of the outcome measure, which was the underestimated, accurate, and overestimated groups.
Predictive variables that entered the ordinal logistic regression were selected according to the results of the univariate analysis or variance tests (p < 0.05). A χ2test was used for dichotomous variables, a Kruskal–Wallis ANOVA was used for ordinal variables, and ANOVA tests were used for continuous variables. Effect sizes of each predictive variable on the outcome variable were presented using ƞ2 for ANOVA and Kruskal–Wallis ANOVA; Cramer’s V for χ2 tests. A significance level of p < 0.05 was considered statistically significant.
A final ordinal logistic regression model was calculated. The model fit was examined using the -2 log likelihood, Pearson χ2, and deviance goodness-of-fit tests. Odds ratios (ORs) and 95 per cent CIs for the variables that can significantly predict the outcome categories were calculated.
Results
One hundred and forty-five participants were included in the driving observation study. Of these participants, 37 were excluded from the analysis because of eDOS recording failure (n = 3), not having PDA records within 90 days (n = 26), and having the closest completion of the Candrive annual assessment more than 200 days from the driving observation (n = 8). As a result, 108 participants were included in the current analysis (Ottawa n = 47, Montreal n = 40, and Hamilton n = 21). There were no significant statistical differences in age, gender, educational level, the PDA and eDOS scores, and the predictive variables between excluded and included participants, except for the number of co-morbid conditions (participants who were excluded had more co-morbid conditions than included ones; p = 0.03). The average interval between the date of the Candrive assessment and the eDOS observation was 84.2 days (SD = 57.7). For the PDA data, 25 participants (23.1%) used the data collected from the Candrive annual assessment; their average date interval was 37.6 days (SD = 25.2). The participants’ mean age was 80.6 years (SD = 4.9; range 74–96). The majority (67.6%) were male, and 50 per cent held a graduate or postgraduate degree. Ten participants (9.3%) were categorized as having mild cognitive impairment (Carson et al., Reference Carson, Leach and Murphy2018); other participants were within the normal range of cognitive functioning.
There were no statistically significant differences in age, gender, and educational level among the three research sites. Post-hoc analysis showed that participants in Hamilton (HML) reported significantly more co-morbid conditions than participants in Ottawa (OTT) and Montreal (MTL) (HML vs. OTT, p = 0.03; HML vs. MTL, p = 0.02). Better visuo-spatial ability was found in participants in Ottawa than in those in Montreal (p = 0.03). Participants in Montreal had better visual acuity, but worse eDOS performance than those in Ottawa and Hamilton (visual acuity MTL vs. OTT, p < 0.001; MTL vs. HML, p < 0.001; eDOS MTL vs. OTT, p = 0.01; MTL vs HML, p < 0.001). The level of participants’ driving complexity differed; older adults in Montreal drove in the least complex conditions and drivers in Hamilton drove in the most complex conditions (MTL vs. OTT, p < 0.001; MTL vs. HML, p < 0.001; OTT vs. HML, p = 0.02). See Table 2 for the participants’ demographic information, clinical functional abilities, PDA, and eDOS scores.
Table 2: Participants’ demographic characteristics and scores on clinical and driving tests
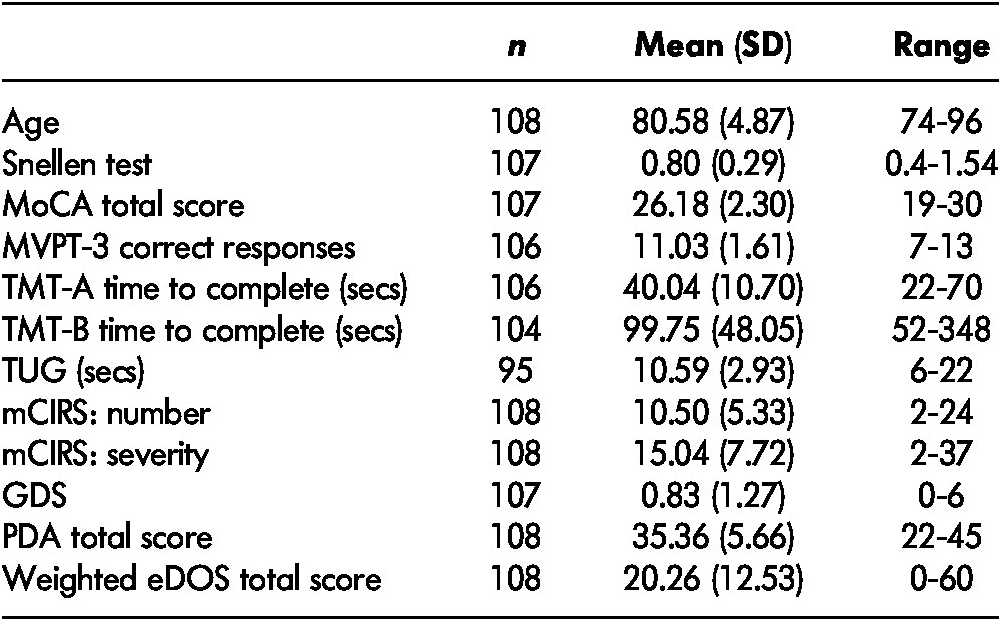
Note. eDOS = electronic Driving Observation Schedule; GDS = Geriatric Depression Scale; mCIRS = modified Cumulative Illness Rating Scale; MoCA = Montreal Cognitive Assessment; MVPT = Motor-Free Visual Perception Test; PDA = Perceived Driving Ability; SD = standard deviation; TMT = Trail Making Test; TUG = Timed-Up and Go
The number and percentage of participants in the overestimated (n = 57), accurate (n = 31), and underestimated (n = 20) groups are shown in Table 3. Differences among the groups for each predictive variable are presented in Table 4. The percentage of males in the overestimated, accurate, and underestimated groups were 67 per cent, 74 per cent, and 60 per cent, respectively. No gender or educational level differences were found for the self-awareness groups (χ2(2) for gender = 1.15, p = 0.56; χ2(2) for educational level = 0.387, p = 0.82). Based on the significant level of ANOVA tests and the correlation matrix, predictors that entered the ordinal logistic regression model were age, mCIRS number, and TMT-A. TMT-B was excluded from the model because of its moderate correlation (Pearson r = 0.48, p < 0.001), a similar measurement construct, and lower effect size compared with the TMT-A.
Table 3: Distribution of overestimated, accurate, and underestimated participants
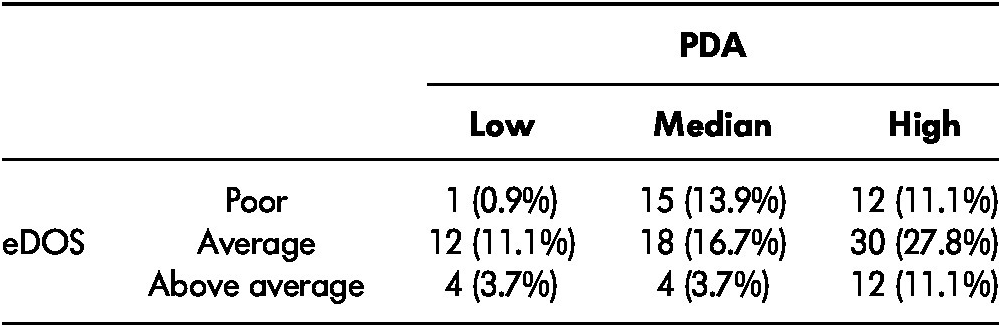
Note. eDOS = electronic Driving Observation Schedule; PDA = Perceived Driving Ability
Table 4: Demographic and clinical factors according to different levels of self-awareness of driving ability
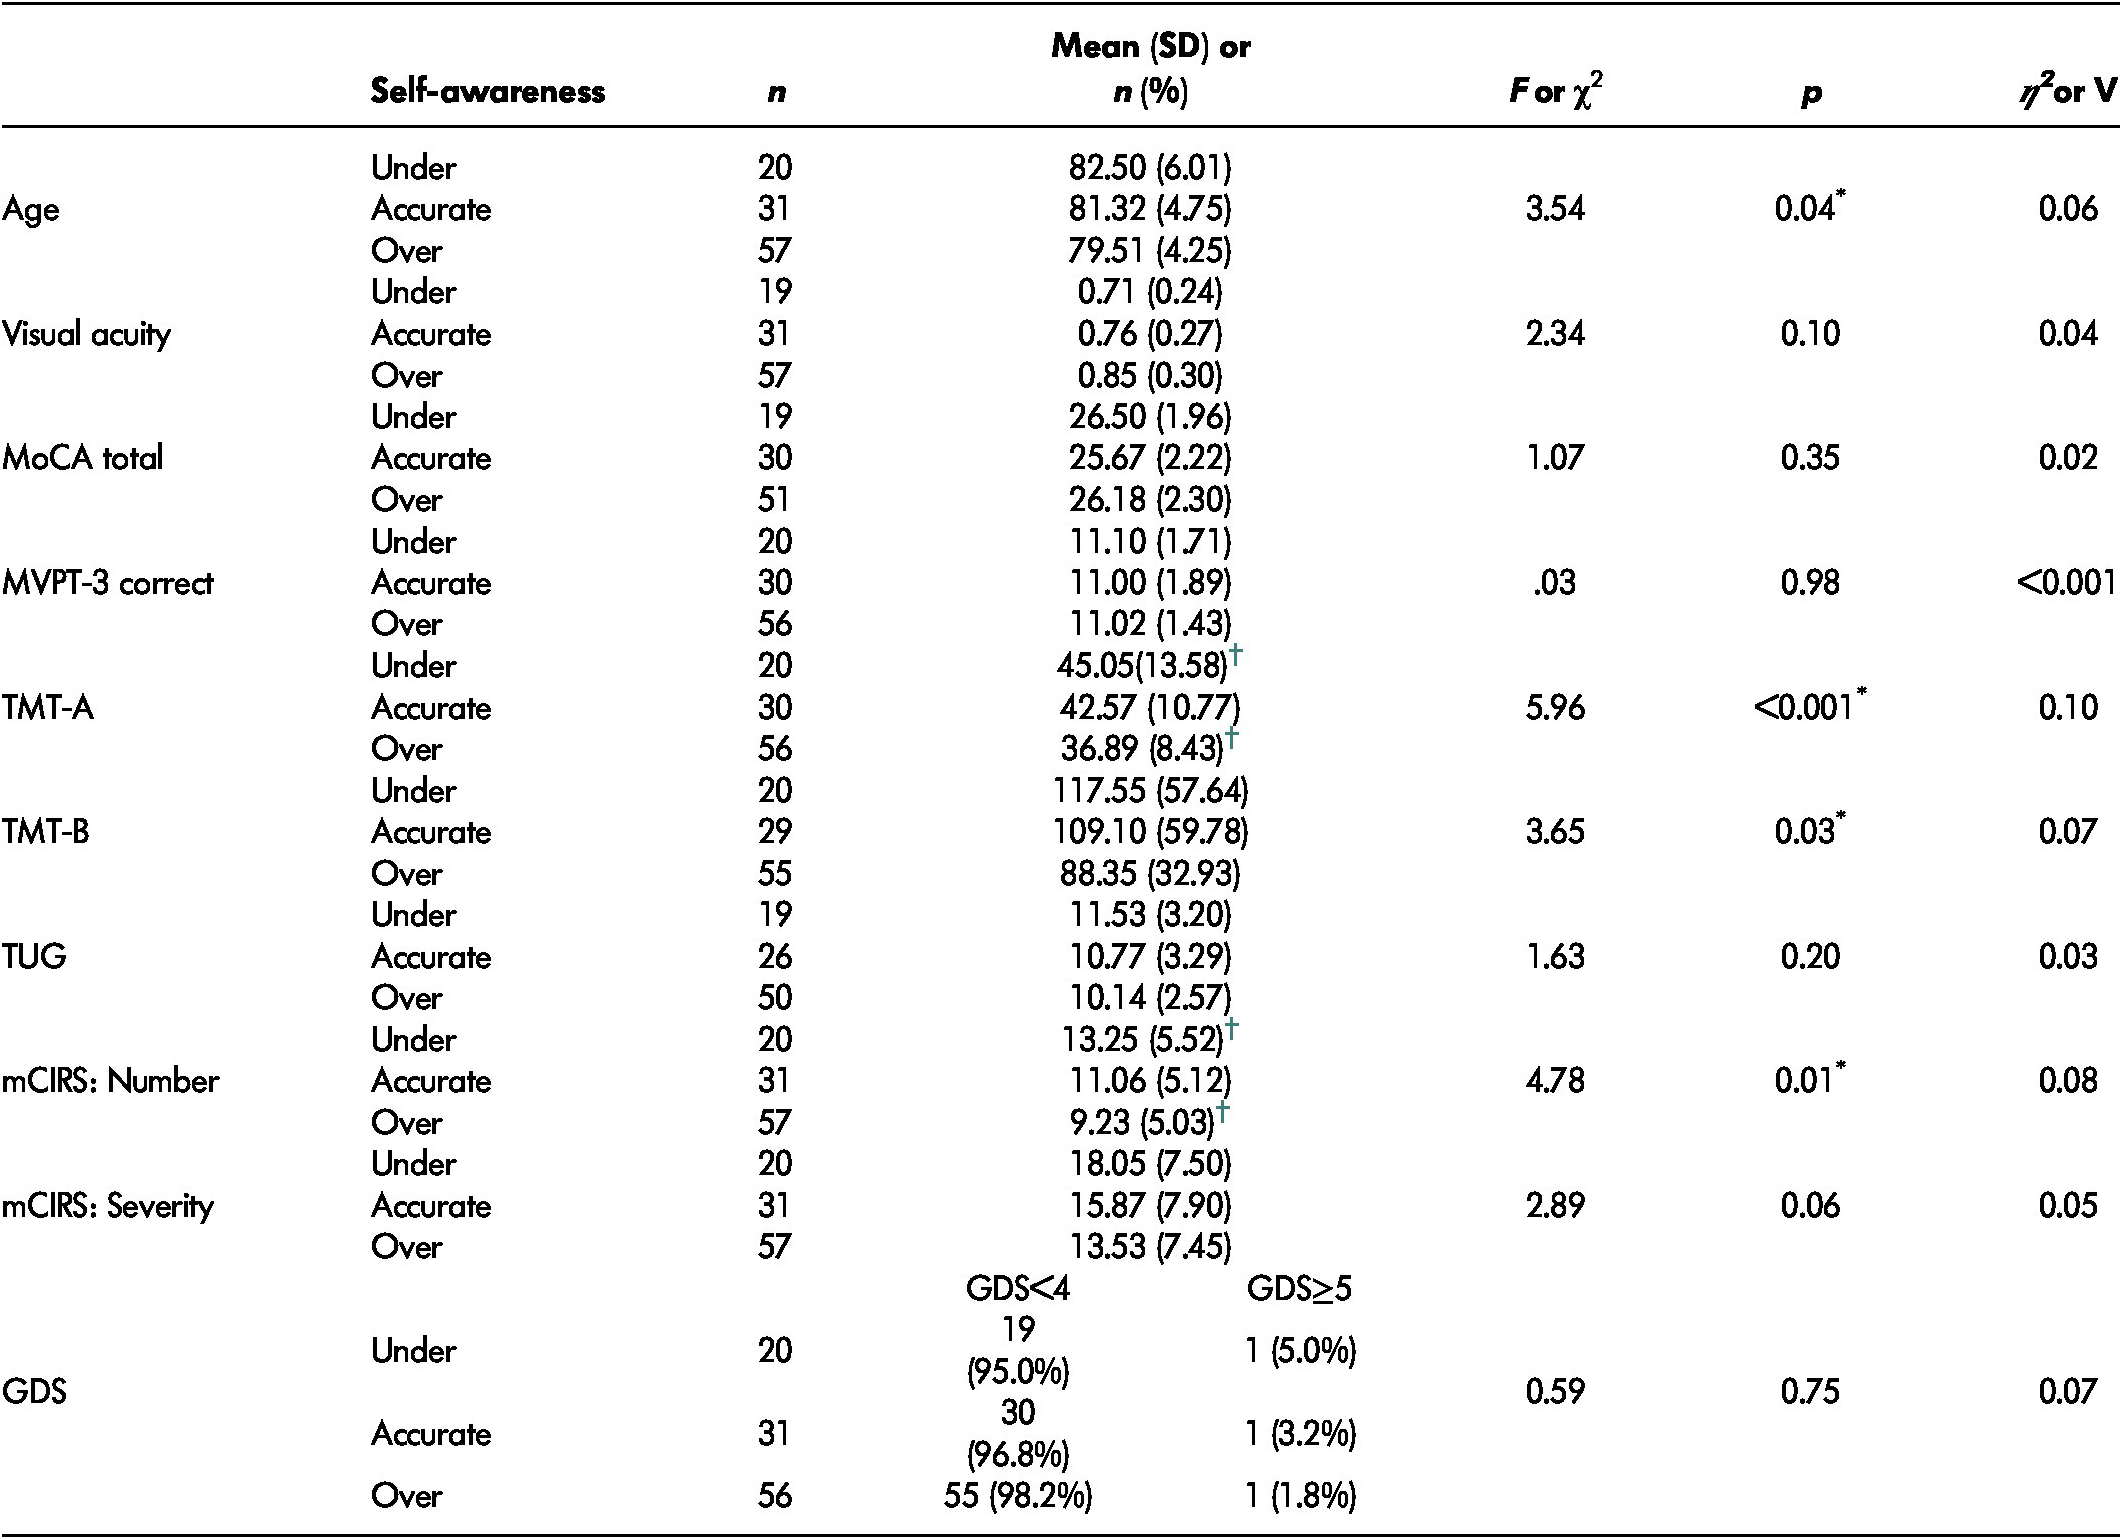
Note. *p<0.05.
† Significant between-group differences using Scheffe post-hoc analysis.
GDS = Geriatric Depression Scale; mCIRS = modified Cumulative Illness Rating Scale; MoCA = Montreal Cognitive Assessment; MVPT = Motor-Free Visual Perception Test; SD = standard deviation; TMT = Trail Making Test; TUG = Timed-Up and Go.
Only 106 participants who had no missing data for the selected predictive variables entered the ordinal logistic regression model. After examining the significance level of each variable in this model, the factor of age was further excluded because after controlling for the other factors, age did not reach the significance level needed to reject the null hypothesis (p = 0.28). The final model that included only the TMT-A and the number of co-morbid conditions showed good model fit (Model fitting χ2(2) = 18.61, p < 0.001; Pearson goodness-of-fit χ2(205) = 185.50, p = 0.41; deviance goodness-of-fit χ2(205) = 175.90, p = 0.61). The model did not violate the assumption of ordinal logistic regression (test of parallel lines χ2(2) = 0.83, p = 0.66).
The estimate of the ORs for the TMT-A and the number of co-morbid conditions for older drivers’ self-awareness of driving ability and their 95 per cent CI are presented in Table 5. Controlling for the other variable, older drivers who overestimated their driving ability had better visuo-motor processing speed measured by the TMT-A and fewer self-reported co-morbid conditions, whereas those with lower visuo-motor processing speed measured by the TMT-A and a higher number of self-reported co-morbid conditions tended to underestimate their driving ability.
Table 5: Model estimation and ORs for significant predictive variables of older drivers’ accurate level of self-awareness
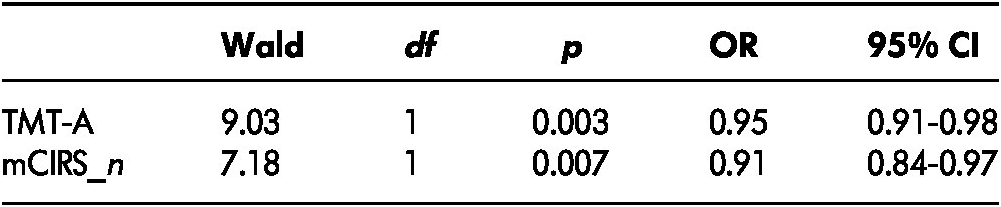
Note. CI = confidence interval; df = degree of freedom; OR = odds ratio; mCIRS_n = number of co-morbid conditions measured using the modified Cumulative Illness Rating Scale; TMT-A = Trail Making Test-Part A.
Discussion
Self-awareness of driving ability is an important factor influencing older drivers’ decisions to modify their everyday driving environment and/or driving behaviours to remain safe on the road. The primary objective of this study was to examine the accuracy of older drivers’ self-awareness of driving ability, by examining the concordance between their perceived driving ability and their actual performance, using a naturalistic driving observation.
This study was the first to assess the accuracy of self-awareness of driving ability among healthy, community-dwelling older drivers using a naturalistic driving observation as a reference criterion. Whereas previous studies adopted either a standard on-road driving evaluation (Broberg & Dukic Willstrand, Reference Broberg and Dukic Willstrand2014; Riendeau et al., Reference Riendeau, Maxwell, Patterson, Weaver and Bedard2016; Selander et al., Reference Selander, Lee, Johansson and Falkmer2011), a driving simulation (Freund et al., Reference Freund, Colgrove, Burke and McLeod2005), in-office functional assessments (Ackerman et al., Reference Ackerman, Vance, Wadley and Ball2010; MacDonald et al., Reference MacDonald, Myers and Blanchard2008), and/or adverse driving history events (Marottoli & Richardson, Reference Marottoli and Richardson1998) to evaluate how accurately older drivers perceive their driving ability, this study used a more ecological, meaningful approach. Driving performance was assessed in the participants’ own vehicle, in a familiar neighborhood, using routes selected by the participants, and they were told to drive as they do every day without any interference from the evaluator. This method avoided the issue of adapting to an unfamiliar vehicle or simulator, and reduced test anxiety that could negatively influence an older driver’s performance (Fairclough, Tattersall, & Houston, Reference Fairclough, Tattersall and Houston2006; Lundberg & Hakamies-Blomqvist, Reference Lundberg and Hakamies-Blomqvist2003). This approach is acceptable to older drivers, as it represents their everyday driving behaviours and environments (Koppel et al., Reference Koppel, Charlton, Langford, Vlahodimitrakou, Di Stefano and Macdonald2013; Smith et al., Reference Smith, Cull, Mence, Charlton, Langford and Koppel2012).
Our results support previous research that found that some older drivers, even those without cognitive impairment, did not have accurate self-awareness of their driving ability, and that most of them overestimated their performance (Broberg & DukicWillstrand, Reference Broberg and Dukic Willstrand2014; Freund et al., Reference Freund, Colgrove, Burke and McLeod2005; Marottoli & Richardson, Reference Marottoli and Richardson1998; Riendeau et al., Reference Riendeau, Maxwell, Patterson, Weaver and Bedard2016; Selander et al., Reference Selander, Lee, Johansson and Falkmer2011). The proportion of drivers with inaccurate self-awareness reported in our study was higher than in previous research (70% vs. 40–50%) (Broberg & Dukic Willstrand, Reference Broberg and Dukic Willstrand2014; Freund et al., Reference Freund, Colgrove, Burke and McLeod2005; Riendeau et al., Reference Riendeau, Maxwell, Patterson, Weaver and Bedard2016). This discrepancy could be the result of different aspects of self-awareness being addressed, the use of different assessment tools, and varied cut-off criteria used to measure and classify level of perceived and actual driving performance. For example, this study focused on “metacognitive awareness”, people’s overall knowledge and beliefs about their driving ability before the driving observation. This is different than other studies which examined older drivers’ “on-line awareness” and required participants to specifically rate their driving performance during an on-road driving session (Broberg & Dukic Willstrand, Reference Broberg and Dukic Willstrand2014). The inclusion of an assessment of metacognitive awareness in this study may be one reason for the higher proportion of participants with inaccurate self-awareness compared with the number found in previous studies (Toglia & Kirk, Reference Toglia and Kirk2000).
When we examined different subgroups of drivers, we found that for the underestimating group, most of the drivers who gave themselves a low rating were classified as average to better than average drivers based on their actual driving performance (16 out of 17 participants). A higher proportion of participants with low perceived driving ability was identified in our study than in previous literature (16% vs. 0–8% defined by a bit worse than the other drivers or having poor to fair driving ability) (Freund et al., Reference Freund, Colgrove, Burke and McLeod2005; Marottoli & Richardson, Reference Marottoli and Richardson1998; Riendeau et al., Reference Riendeau, Maxwell, Patterson, Weaver and Bedard2016; Selander et al., Reference Selander, Lee, Johansson and Falkmer2011). This inconsistency may be related to the questionnaire that was used to evaluate perceived driving ability. Because the PDA questionnaire asks participants to rate their driving ability in several common, challenging driving conditions, rather than by one question of their overall driving ability, these detailed questions might have triggered participants to carefully and critically self-reflect on their driving ability, leading to a somewhat lower self-rating of driving ability (MacDonald et al., Reference MacDonald, Myers and Blanchard2008; Toglia & Kirk, Reference Toglia and Kirk2000).
The percentage of drivers who overestimated their driving was also slightly higher than the numbers found in previous study findings (53% vs. 38–51%) (Broberg & Dukic Willstrand, Reference Broberg and Dukic Willstrand2014; Freund et al., Reference Freund, Colgrove, Burke and McLeod2005; Riendeau et al., Reference Riendeau, Maxwell, Patterson, Weaver and Bedard2016). Considering that the proportion of drivers with median to high perceived driving ability was similar to that in the other research findings (84% vs. 80–100%), this result might be because of the use of the naturalistic driving observation, rather than the standard on-road driving evaluation. Relative to the standard driving test, drivers in a naturalistic environment were more likely to feel freer to demonstrate their “real” driving patterns and show some common bad habits, such as not signaling at a turn or speeding (Chevalier et al., Reference Chevalier, Coxon, Rogers, Chevalier, Wall and Brown2017; Sullivan, Bao, Goudy, & Konet, Reference Sullivan, Bao, Goudy and Konet2015). Davis et al. (Reference Davis, Papandonatos, Miller, Hewitt, Festa and Heindel2012) reported that drivers made more severe errors in naturalistic environments than in the standard evaluation condition. Therefore, the higher proportion of overestimated older drivers is likely to be attributed to the naturalistic environments used to examine the older drivers.
The secondary objective of this study was to identify the relationship between demographic and clinical factors with self-awareness of driving ability. Two clinical factors were found to predict the accuracy level of older drivers’ self-awareness of driving ability: visuo-motor processing speed measured by the TMT-A, and self-reported number of co-morbid conditions. Older drivers with slower visuo-motor processing speed and a greater number of co-morbid conditions tended to underestimate their driving ability, whereas those with quicker visuo-motor processing speeds and fewer co-morbid conditions tended to overestimate their driving ability. These findings are not consistent with results from previous studies. Broberg and Dukic Willstrand (Reference Broberg and Dukic Willstrand2014) did not find that visuo-motor processing speed was related to older drivers’ accuracy of self-awareness of driving ability. Wood et al. (Reference Wood, Lacherez and Anstey2013) reported a contradictory finding that overestimated drivers had worse visuo-motor processing speed, and underestimated drivers had better performance in the time to complete the TMT-A and B. Given that longer times to complete the TMT-A and B are related to worse perceived driving ability (Rapoport et al., Reference Rapoport, Naglie, Weegar, Myers, Cameron and Crizzle2013), one possible explanation for these mixed results is the different on-road driving evaluation approaches used to determine the accuracy level of older drivers’ self-awareness. A meta-analysis showed that longer time to complete the TMT-B test was associated with failing a standard on-road driving test (Mathias & Lucas, Reference Mathias and Lucas2009), but no relationship was found between the TMT-B and driving performance in naturalistic driving environments (Koppel et al., Reference Koppel, Charlton, Langford, Vlahodimitrakou, Di Stefano and Macdonald2013). Moreover, poorer performance on the TMT-A and B was found to be associated with more self-reported avoidance behaviours in difficult driving situations, lower driving frequency (Rapoport et al., Reference Rapoport, Naglie, Weegar, Myers, Cameron and Crizzle2013), and lower annual driving mileage (Stutts, Reference Stutts1998). It is possible that, in a naturalistic driving evaluation setting, older drivers consciously or unconsciously planned their drive ahead of time and determined whether to avoid difficult driving conditions (Blanchard & Myers, Reference Blanchard and Myers2010), which modified their actual driving performance. An older driver with declining visuo-motor processing speed may be more conservative on self-rated driving ability, and is more likely to avoid challenging driving conditions, drive more carefully, and maintain satisfactory driving performance in everyday driving environments. However, this self-protective mechanism cannot be adopted in a standard on-road driving evaluation typically used in previous studies, and poor visuo-motor processing speed can only negatively affect the driver’s performance. In addition, although the results on the TMT-B were significantly different in each self-awareness group in the univariate analysis, this factor was not maintained in the final regression model because of lower predictive power and its collinearity with the TMT-A.
To our knowledge, no studies have investigated the association between co-morbid conditions and accuracy of self-awareness of driving ability. Our study was the first indicating that, for community-dwelling older drivers without cognitive impairments and neurological conditions, a lower number of co-morbid conditions is linked to an overestimation of driving ability, and more health-related issues are associated with underestimation of driving ability. Past evidence demonstrated that older drivers with one or more co-morbid conditions are likely to reduce their driving frequency, trip duration, and distance, and the decrease of driving exposure is related to their experience and knowledge of the impact of these co-morbid symptoms (Sargent-Cox, Windsor, Walker, & Anstey, Reference Sargent-Cox, Windsor, Walker and Anstey2011).
Age was significantly different among different self-awareness groups when using univariate analyses, but the predictive effect did not hold after accounting for the other predictive factors (i.e., the TMT-A and the number of co-morbid conditions) in the regression model. Interestingly, we did not find a difference in the perceived and actual driving ability, as well as in the accuracy of self-awareness between male and female drivers.
There are several study limitations that should be noted. First, some of the perceived driving ability data and all the participants’ information of clinical functional ability were retrieved from the Candrive database, which might not have been collected close to the date of the administration of the naturalistic driving observation. Participants’ perceived driving ability and functional abilities may have changed within the time interval between the two assessment appointments. Nevertheless, participants were only included if they had the PDA questionnaire administered within 3 months, and clinical functional ability evaluated within 7 months from the date of the driving observation; recent findings demonstrated that older drivers’ perceived driving ability and clinical functioning were stable over 1 year in the Candrive study (Koppel et al., Reference Koppel, Charlton, Richter, Di Stefano, Macdonald and Darzins2017; Rapoport et al., Reference Rapoport, Sukhawathanakul, Naglie, Tuokko, Myers and Crizzle2016). To avoid this limitation, it is suggested that future studies collect perceived and actual driving ability data on the same day.
Second, our study findings may not be generalisable to all the drivers in this age group. One of the reasons is that our study participants were recruited by convenience sampling, and those with neurodegenerative diseases were excluded from the study. We also found that those excluded from this study had more medical co-morbid conditions than the included participants. As a result, our study sample had high education levels and was quite healthy. In addition, participants in this study underwent the Candrive assessments annually, in which their driving-related functional abilities, habits, and attitudes were examined over time. Compared with other older drivers, our study participants had more opportunities to reflect on their driving ability and behaviours, and to modify their driving behaviours accordingly. Their self-awareness of driving ability might have been influenced by their participation in this longitudinal cohort study. To increase the generalisability of the study, future studies can recruit a greater variety of participants, in terms of age, education level, socio-economic status, and health conditions.
Future studies will be needed to expand our knowledge about the mechanism and impacts of self-awareness of driving ability on road safety. It is important to identify whether older drivers’ self-awareness of driving ability is adjusted with changes in functional abilities over time. Moreover, the relationship between the accuracy level of self-awareness of driving ability and prospective/retrospective crashes among older drivers should be examined to understand if self-awareness of driving ability influences their driving safety. It will also be interesting to compare older drivers’ self-awareness of driving ability with a younger group, to understand whether older drivers are more biased or more accurate in their self-awareness of driving ability.
As the number of older drivers is increasing on the roadways, helping them maintain safe driving as long as possible would be greatly beneficial for the individuals and for society. Policy makers can approach this goal by taking steps to improve older adults’ self-awareness of driving ability and encourage their safe driving behaviours and appropriate modifications. The study findings can help clinicians gain knowledge about the measurement of self-awareness of driving ability and the proportion and factors related to inaccurate self-awareness of driving ability among community-dwelling older drivers, as well as to better identify these drivers (e.g., by examining their visuo-motor processing speed and self-reported co-morbid conditions). Driving retraining and intervention programs can also be tailored to the older drivers’ level of self-awareness. For example, for those who overestimate their driving ability, their insight into their driving ability, specifically their driving errors and associated driving safety, should be improved. For those who underestimate driving ability, strategies that increase their confidence level may be provided. For all drivers with inaccurate self-awareness of driving ability, clinicians can collaboratively work with the clients and their family members to reconsider their use of self-regulatory behaviours in their everyday living environment as well as their driving cessation plan.
Conclusions
Our study findings showed that most healthy community-dwelling older drivers did not have accurate self-awareness of their driving ability. In particular, those who had better visuo-motor processing ability and fewer co-morbid conditions tended to over-rate their driving performance in their everyday driving environments, whereas those with lower visuo-motor processing speed measured by the TMT-A and a higher number of self-reported co-morbid conditions tended to underestimate their driving ability. Future research is needed to examine the impact of self-awareness on driving safety and to create educational and training programs to improve the accuracy of self-awareness for healthy older drivers who under- and overestimate their driving ability.


