


The prevalence of overweight and obesity is increasing rapidly in both developed and developing countries(Reference Haslam and James1). Data from the 2002 China National Nutrition and Health Survey showed that 14·7 % of Chinese were overweight and another 2·6 % were obese, which translates into 184 million overweight and 31 million obese people in China(Reference Wu, Ma and Hu2). The epidemic of obesity and overweight has become a public health issue and is an important health risk for diseases like diabetes, high blood pressure, atherosclerosis and others(Reference Kahn, Hull and Utzschneider3).
There is evidence that weight gain is associated with being married. A longitudinal study over 10 years showed that weight gain follows marriage in men and women(Reference Burke, Giangiulio and Gillam4). Gender differences may exist in the rate of body weight change after marriage(Reference Rauschenbach, Sobal and Frongillo5). However, in the short term, the pattern of weight gain may differ in men and women(Reference Burke, Giangiulio and Gillam4). Some researchers reported that husbands, not wives, gained weight in the first 2–3 years after marriage(Reference Craig and Truswell6). Diet change, an important component of the marital relationship, can affect the health of both partners(Reference Bove, Sobal and Rauschenbach7). At the early stage of marriage, sharing food is part of a shared existence. In changing from a single lifestyle to cohabitation, couples may adopt unfavourable eating patterns leading to weight gain and increased risk of lifestyle diseases(Reference Burke, Giangiulio and Gillam8). This period of time provides an opportunity for establishing healthy eating habits(Reference Anderson, Marshall and Lea9).
Several studies have found a significant association between dietary patterns and overweight or obesity(Reference Sichieri10–Reference Esmaillzadeh and Azadbakht13); however, to our knowledge, there are no studies that have examined the relationship between weight gain and dietary patterns among newlyweds. Understanding dietary intakes of newlyweds is important for developing nutrition recommendations for this population. The present study aimed to characterize the dietary patterns of young couples married within one year and to examine the factors associated with weight changes.
Methods
Study design
A cross-sectional survey was carried out in Shanghai Baoshan District in 2009. The study was approved by the institutional review board of the School of Public Health, Fudan University.
Study participants
From April to July 2009, a total of 342 newlywed couples were invited to the survey. Participants were recruited from Shanghai Baoshan District, a densely populated residential area with a relatively lower economic status in Shanghai, thus comparable with other cities in China. Participants were eligible for the survey if both partners were aged below 35 years, the couple was cohabiting for the first time and within a year, and women were not pregnant. Participants were excluded if they had a child, were on a therapeutic diet or had illnesses such as heart disease, diabetes or severe asthma.
Data collection
Husband and wife were interviewed in their home separately by our trained research assistants. The interview consisted of questions on socio-economic status, medical history, health behaviours, newlyweds’ eating habits and physical activities.
Dietary intake and pattern derivation
The information on dietary intake was obtained by an FFQ with forty-nine items. This FFQ was derived from the 2002 China National Nutrition and Health Survey(Reference Li, He and Zhai14), and was modified for the target population. The participants were asked to state the frequency and consumption of each type of food on average within the past 12 months by our trained assistants. For each food item, the frequency was recorded in terms of daily, weekly or monthly intake, and the daily intake of each food was derived by dividing weekly consumption by 7 and monthly consumption by 30. We collapsed these reported dietary intakes into thirty-two food groups mainly according to similarity of nutrient composition. Mixed dishes such as traditional Chinese dumplings were disaggregated and assigned to the appropriate food groups. Nutrient intakes were obtained from the database developed using nutrient information from the Nutrition Calculator software version 2·3 (Nutrition and Food Security, Chinese Center for Disease Control and Prevention, Xuanwu District, Beijing, China). We chose to convert food units to kJ and divided by total energy intake of each participant.
Anthropometrics and blood pressure
Anthropometric measures conducted by our trained research assistants included height, weight and waist circumference. Blood pressure was also taken. Height was measured without shoes to the nearest 0·5 cm.Weight was measured to the nearest 0·1 kg in light indoor clothing. BMI was calculated from height and weight as BMI = weight (kg)/[height (m)]2. Overweight and obesity were determined according to cut-off points of the Chinese Obesity Working Group: BMI < 18·5 kg/m2 was defined as underweight, BMI = 18·5–23·9 kg/m2 as normal weight, BMI = 24·0–27·9 kg/m2 as overweight and BMI ≥ 28·0 kg/m2 as obesity(Reference Bei-Fan15). A waist circumference over 85 cm for men and over 80 cm for women were recommended as the cut-off points for central obesity(Reference Bei-Fan15). Blood pressure was measured in duplicate and the average of both readings was used for each of systolic and diastolic blood pressure.
Other covariates
Information on age, sex, education, job type, smoking and alcohol consumption, medication use, supplement use and body weight before marriage was collected by a questionnaire. The question on household income was excluded due to concerns about privacy. Data on physical activity, expressed as metabolic equivalent task (MET) minutes per week, was obtained through the Chinese version of the International Physical Activity Questionnaire (IPAQ)(Reference Macfarlane, Lee and Ho16), which included questions on four activity domains: (i) job-related physical activity; (ii) transportation-related physical activity; (iii) housework and house maintenance activities; and (iv) recreation, sport and leisure-time physical activity. We asked participants to recall all the vigorous and moderate activities they had performed in the last 7 d, considering the number of days per week and the time spent on these activities, and then classified them into three categories.
Statistical analyses
Of the 342 couples, thirty-five were excluded due to cohabiting for more than 1 year. Those with implausible energy intakes (<2510 or >20 083 kJ, <600 or >4800 kcal) or with more than ten questions left unanswered on the FFQ were excluded from the analyses. In addition, each food group was assessed for outliers (≥6 sd from the mean of each food group) and individuals outside this value were excluded. Furthermore, according to the data processing rules of IPAQ(Reference Hagstromer, Oja and Sjostrom17), participants with a total physical activity time exceeding 960 min were also excluded. Finally, a total of 556 participants (281 males and 275 females) were included in the analyses.
Factor analysis was used. Food groups were entered into principal components analysis as a percentage of total energy intake(Reference Schwerin, Stanton and Smith18); the factors were orthogonally rotated by specifying the varimax option to derive non-correlated factors. To decide the number of factors to retain, three- to fifteen-factor solutions were specified; eigenvalues, scree plots and factor loadings were also assessed across solutions. After these analyses, a four-factor solution was selected. Factor loadings were calculated for each food group across the four factors (dietary patterns). For each dietary pattern, a factor score for each subject was calculated by summing intakes of food groups weighted by their factor loadings. Dietary patterns were named according to both the foods that loaded most positively on the factor and how these factors were associated with nutrients.
Each factor was divided into quintiles and sample characteristics were compared between the highest (Q5) and lowest quintile (Q1) by analysis of covariance for means and the χ 2 test for frequencies. Mean nutrient intakes were calculated for the quintiles of each factor by ANOVA and adjusted for age, sex, education and total energy intake.
Multivariate linear regression analyses were performed for each factor to test whether dietary patterns predicted body weight changes after marriage. Factors were treated in quintiles, in which the lowest quintile was the reference group. We adjusted age, sex, smoking and alcohol consumption, education, physical activity, staying up late, living with parents and body weight before marriage in the model to examine association between dietary patterns and weight changes after being married. Because total energy intake is a key factor which may affect BMI(Reference Willett, Howe and Kushi19), we set up a final model for each analysis in which we added the total energy to the model to see whether the adjustment for total energy intake would change the results.
All statistical analyses were performed using the SPSS statistical software package version 18·0 (SPSS Inc., Chicago, IL, USA). P value <0·05 was considered significant.
Results
Characteristics of the study participants
The mean age of the sample was 28·0 (sd 4·6) years and the average length of marriage was 10 (sd 4·9) months; mean age for women was significantly lower than that for men (26·6 (sd 3·8) v. 29·3 (sd 4·9) years, P < 0·001). About two-thirds of the participants were college educated and above, and 78·2 % were currently employed.
Weight change in the first year after marriage
Anthropometrics and weight changes are presented in Table 1. The mean weight before marriage was 69·5 (sd 10·6) kg for men and 52·2 (sd 6·6) kg for women. Weight after marriage was significantly higher than weight before marriage in both men and women (P < 0·001). Average weight gain for men during marital transition was 2·2 (sd 5·0) kg, higher than for women (1·6 (sd 3·7) kg), but this difference was not significant (P = 0·09). Fifteen per cent of the subjects were overweight or obese before marriage; this proportion increased to 21·2 % after marriage. The rate of overweight and obesity among men was significantly different during the marriage transition (P = 0·002; Table 2). However, no such difference was observed in women (P = 0·15).
Table 1 Anthropometrics and weight change after marriage among newlyweds in Baoshan District, Shanghai, China, 2009
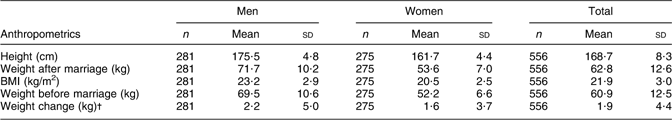
†Weight change (kg) = weight after marriage (kg) – weight before marriage (kg). Weight after marriage was significantly higher than weight before marriage in both men and women (P < 0·001); men's weight changes after marriage were higher than women's, but not significantly so (P = 0·09).
Table 2 Comparison of weight status before and after marriage for newlyweds in Baoshan District, Shanghai, China, 2009Footnote †
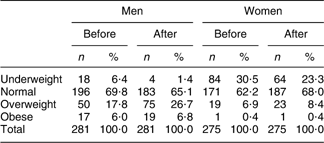
† For men, the prevalence of overweight and obesity after marriage (33·5 %) was significantly greater than the prevalence before marriage (23·8 %, P = 0·002), no significant difference was found for women (8·8 % v. 7·3 %, P = 0·15).
Dietary patterns
Four major dietary patterns were identified by factor analysis (Table 3). Individual factor loadings were interpreted similarly to correlation coefficients, in which the most positive values contributed most to the factor score and the most negative values contributed least to the factor score. Factor 1 was the most dominant dietary pattern in the population and explained 8·9 % of the variance in intake, whereas each of the remaining three factors explained 6·7 % (factor 2), 6·2 % (factor 3) and 5·3 % (factor 4) of the variance. Together, the four factors explained 27·1 % of the variance in dietary intake.
Table 3 Factor loadings for dietary patterns that emerged for newlyweds in Baoshan District, Shanghai, China, 2009Footnote †
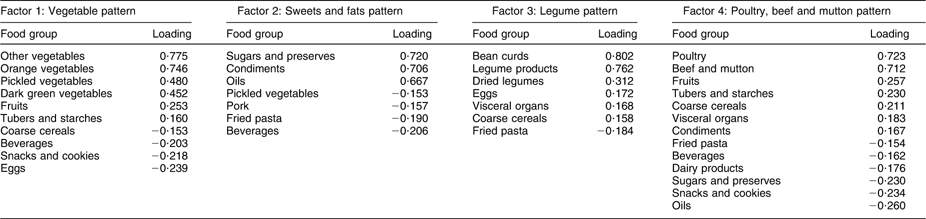
† n 556, only factor loadings > ∣0·15∣ were included for simplicity.
Factor 1, a vegetable pattern, had high factor loadings for orange vegetables, dark green vegetables, other vegetables, pickled vegetables, fruits, and tubers and starches, and low loadings for eggs, snacks and cookies, beverages and coarse cereals. Factor 2, a sweets and fats pattern, was high in sugars and preserves, condiments (all condiments and spices, e.g. monosodium glutamate, sugar excluded) and oils (vegetable and animal oils), and low in beverages, fried pasta, pork and picked vegetables. Factor 3, a legume pattern, emerged that was characterized by high loadings from bean curds, legume products (bean curds excluded), dried legumes, eggs, visceral organs and coarse cereals, and low loadings from fried pasta. Factor 4, a poultry, beef and mutton pattern, had high factor loadings for poultry, beef and mutton, fruits, tubers and starches, coarse cereals, visceral organs and condiments, and low loadings from dairy products, snacks and cookies, beverages, oils, sugars and preserves, and fried pasta. Higher scores for the vegetable pattern (factor 1) were associated with higher Fe and Zn intakes (Table 4). The sweets and fats pattern (factor 2) was associated with lower dietary fibre, vitamin B1, vitamin B2, vitamin C, Ca, Fe and Zn intakes, and higher total energy and fat intakes. Mean intakes for the legume pattern (factor 3) were high for vitamin C. Higher scores for the poultry, beef and mutton pattern (factor 4) were associated with higher protein, dietary fibre, Ca, Fe and Zn intakes.
Table 4 Associations between dietary patterns and energy and selected nutrient intakes among 556 newlyweds in Baoshan District, Shanghai, China, 2009Footnote †
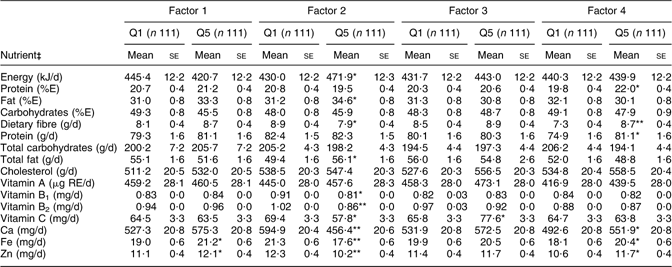
%E, percentage of energy intake; RE, retinol equivalents.
Mean values were significantly different from those of Q1: *P < 0·05, **P < 0·01.
† Data are means and their standard errors for the highest quintile (Q5) and the lowest quintile (Q1) for each factor.
‡ Energy was adjusted for age and sex; others were adjusted for age, sex and total energy.
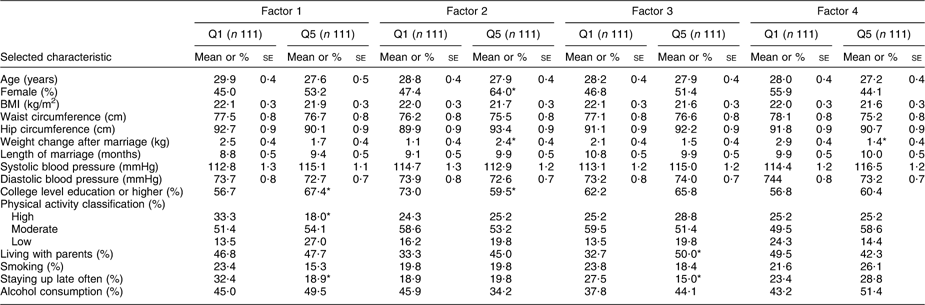
Participants’ characteristics for the dietary patterns are presented in Table 5. The highest quintile of the vegetable pattern had a greater percentage of participants having a college degree or higher (Q5: 67·4 % v. Q1: 56·7 %, P < 0·05) and had fewer subjects staying up late often (Q5: 18·9 % v. Q1: 32·4 %, P < 0·05). The highest quintile of this factor also had more subjects in low physical activity level (Q5: 27·0 % v. Q1: 13·5 %, P < 0·05) and less in high physical activity level (Q5: 18·0 % v. Q1: 33·3 %, P < 0·05). The highest quintile of the sweets and fats pattern had more women than men (Q5: 64·0 % v. Q1: 47·4 %, P < 0·05) and a lower percentage of subjects having a college or higher education level (Q5: 59·5 % v. Q1: 73·0 %, P < 0·05); average body weight change after marriage was significantly higher for those in the highest quintile of this factor (Q5: 2·4 v. Q1: 1·1 kg, P < 0·05). The legume pattern had a greater proportion of participants living with parents after marriage (Q5: 50·0 % v. Q1: 32·7 %, P < 0·05) and a lower percentage staying up late often (Q5: 15·0 % v. Q1: 27·5 %, P < 0·05). The poultry, beef and mutton pattern was associated with less weight change after marriage (Q5: 2·9 v. Q1: 1·4 kg, P < 0·05).
Table 5 Participants’ characteristics by dietary pattern in 556 newlyweds in Baoshan District, Shanghai, China, 2009Footnote †
Mean values or frequencies were significantly different from those of Q1: *P < 0·05.
† Values are means and their standard errors or frequencies (%) for the highest quintile (Q5) and the lowest quintile (Q1) for each factor. Age- and sex- adjusted means were calculated using ANOVA. Frequencies were obtained for categorical variables and the χ 2 test was used to detect significant differences.
Factors associated with weight change
Multiple regression results examining factors associated with weight change after marriage are presented in Table 6. A test for interaction between dietary pattern and gender indicated that the effect of food pattern on weight change after marriage was significantly modified by gender for factor 2 (P < 0·05), but not for the other factors (P > 0·05); therefore, the results are presented separately for women and men for factor 2 only. For men, the highest quintile of factor 2 was significantly associated with weight change after marriage in a comparison with the lowest quintile (β = 2·94; 95 % CI 0·75, 5·15; P = 0·01). Among women, factor 2 was not associated with weight change after marriage in a comparison of the highest with the lowest quintile (β = 0·90; 95 % CI −0·51, 2·31; P = 0·21). The highest quintile of factor 4 was inversely associated with weight change after marriage in a comparison with the lowest quintile (β = −1·21; 95 % CI −2·32, −0·11; P = 0·03). Factor 1 and factor 3 were not associated with weight change after marriage after adjusting for other confounding factors.
Table 6 Linear regression analysis: β coefficients (and 95% confidence intervals) for predicting body weight change (kg) after marriage among newlyweds in Baoshan District, Shanghai, China, 2009Footnote †

Q1, quintile 1; Q5, quintile 5.
† Linear regression analysis β coefficients are presented for the highest (Q5) compared with the lowest (Q1) quintile (reference group).
‡ Model 1 is adjusted for age, sex, smoking, alcohol consumption, education level, physical activity, staying up late often (yes or no), living with parents or not and weight before marriage.
§ Model 2 is adjusted for all covariates in model 1 and total energy intake.
Discussion
Weight after marriage was significantly higher than weight before marriage in both men and women. Average weight gain during marital transition was higher in men than women, but it was not significant. These findings provide some supporting evidence for the hypotheses presented in the introduction to the present paper, but with gender differences. French et al. (Reference French, Jeffery and Forster20) found women, but not men, gained weight in the first 1–2 years of marriage in a cohort of 1639 male and 1913 female workers in the USA. Sobal et al.(Reference Sobal, Rauschenbach and Frongillo21) examined changes in marital status and body weight in 9043 adults in the US National Health and Nutrition Epidemiological Follow-up Survey, and found marital transition involving entry into marriage was associated with weight gain among women, but not among men. However, Craig and Truswell(Reference Craig and Truswell6) found that men gained more weight than women in the first 2–3 years after marriage in a sample of sixty young couples living in Sydney, Australia.
Four dietary patterns were identified by using factor analysis in the present study. A sweets and fats pattern (factor 2), which had a high positive factor loadings for sugars and preserves, condiments and oils, was positively associated with weight changes after marriage in men, but not in women. It is difficult to compare these findings with earlier studies due to differing study samples and methods. However, the patterns we identified showed some similarities with previous studies using factor analysis. The sweets and fats pattern we observed was somewhat close to the sweets pattern derived in the study by Tucker et al. (Reference Tucker, Noel and Newby22), wherein a sweets pattern, which had high loadings from candy, sugar and chocolate candy, sweet baked goods and dairy desserts, was positively associated with waist circumference after adjustment for potential confounding. It also shares common elements with the sweets pattern in several other studies(Reference McNaughton, Ball and Mishira11, Reference Newby, Muller and Hallfrisch12, Reference Togo, Osler and Sørensen23), but no significant results were obtained. In the European Prospective Investigation into Cancer and Nutrition–Potsdam study(Reference Schulz, Kroke and Liese24), higher intakes of sweets were predictive of weight gain over a 2-year follow-up period among men and women. Tremblay et al.(Reference Tremblay, Drapeau and Despres25) found that decreasing fat consumption was associated with lower weight gain over a mean follow-up of 6 years. In the Finnish Diabetes Prevention study(Reference Tuomilehto, Lindstrom and Eriksson26), participants in the intervention group were advised to reduce total energy and fat intake. Weight loss was significantly higher in the intervention group compared with the control group.
Interaction between gender and dietary pattern was previously reported in relation to BMI and waist circumference(Reference Newby, Muller and Hallfrisch12, Reference Barker, McClean and Thompson27). In our study, of those participants in the highest quintile of factor 2, only 59·5 % had college level education or higher, significantly lower than in the lowest quintile (73·0 %). This suggests that a better education level may contribute to a healthier diet(Reference Cade, Upmeier and Calvert28). Although we adjusted for this factor in our study, there may still be some other potential confounders associated with dietary intake and change in body weight that may be different between men and women which we do not yet know about. Our finding of an interaction between the sweets and fats pattern and gender is interesting but further research is needed to interpret whether this interaction between men and women is due to biological effects modified by gender or just our methodological limitations.
A poultry, beef and mutton pattern (factor 4), a pattern high in poultry, beef and mutton, fruits, tubers and starches, and coarse cereals, was inversely associated with weight changes during marital transition in both men and women. To our knowledge, there have been no studies examining the association between such a dietary pattern derived by using factor analysis and weight changes. The 2010 Dietary Guidelines for Americans(29) suggests choosing a variety of protein foods, such as lean meat and poultry. Besides, this inverse association seen here between factor 4 and weight changes may be explained by the roles of dietary fibre(Reference Kimm30). Participants in our study had a relatively high consumption of fruits, tubers and starches, and coarse cereals, which were all high sources of dietary fibre. The dietary fibre intake was much greater in the highest quintile of factor 4 than in the lowest quintile of factor 4, which may explain why only the highest quintile was associated with weight changes during marital transition.
Participants in our study had a relatively high consumption of dietary fibre in both the lowest quintile of factor 2 and the highest quintile of factor 4. Evidence that dietary fibre intake prevents obesity is strong. Fibre intake is inversely associated with body weight and body fat(Reference Ludwig, Pereira and Kroenke31–Reference Kromhout, Bloemberg and Seidell33). In a prospective cohort study among US female nurses, Liu et al.(Reference Liu, Willett and Manson32) found that women in the highest quintile of dietary fibre intake had a 49 % lower risk of major weight gain than did women in the lowest quintile, which suggested weight gain was inversely associated with the intake of high-fibre, wholegrain foods. In a seven countries study, Kromhout et al.(Reference Kromhout, Bloemberg and Seidell33) found that the population's average physical activity index and dietary fibre intake were both strongly inversely related to population-average subscapular skinfold thickness and together explained 90 % of the variance in subscapular skinfold thickness. So, given the focus on dietary fibre for body weight changes or obesity, it is possible that newlyweds may have modified dietary habits within their first year of their marriage.
Strengths of the present study include that we used different cut-off points for BMI instead of the international criteria. The WHO recommended a BMI range of 25·0–29·9 kg/m2 as the criterion for overweight and ≥30·0 kg/m2 for obesity in 1995. However, the data used to derive these criteria came from Western populations. As Asian people often have a smaller body frames than Caucasians, these cut-off values for defining obesity cannot be readily applied to Asians. A WHO expert consultation has proposed a new definition of obesity for the Asian population(34): BMI of 23·0–24·9 kg/m2 for overweight and ≥25·0 kg/m2 for obesity; nevertheless, the basis of this definition did not include data from China. Thus, we adopted different cut-off points for BMI instead of WHO criteria and Asian criteria according to cut-off points of Chinese Obesity Working Group(Reference Bei-Fan15): BMI < 18·5 kg/m2 was defined as underweight, 18·5–23·9 kg/m2 as normal weight, 24·0–27·9 kg/m2 as overweight and BMI ≥ 28·0 kg/m2 as obesity.
There are several limitations in our study. Our findings could not conclude causal relationships due to the cross-sectional design. In particular, dietary patterns may strongly interact with other lifestyle factors or be part of specific lifestyles as previously suggested(Reference Martínez, Marshall and Sechrest35). Lack of data on household income is another limitation in our study. Participants were not required to provide such information at the time of data collection due to consideration of their privacy. As household income is a potential confounder that could possibly affect people's body weight changes(Reference Hulshof, Brussaard and Kruizinga36), such lack of information may have changed the original association between dietary pattern and body weight changes, and we cannot rule this out. Besides, because of the limitation of the study tool we used (for example, the Nutrition Calculator software we used), we were unable to calculate the dietary glycaemic index (GI) among these newlyweds. Some studies have demonstrated that dietary GI was positively correlated with BMI(Reference Murakami, Sasaki and Takahashi37, Reference Brand-Miller, Holt and Pawlak38). So it is necessary to upgrade our research tools in future research.
Factor analysis itself also has limitations. The researcher must decide how to treat the dietary variables and whether these variables should be adjusted for total energy intake. In our study, we considered the dietary variables as a percentage of energy to get factors proportional to total energy intake, which was in accordance with some other researches(Reference Newby, Muller and Hallfrisch12, Reference Esmaillzadeh and Azadbakht13). However, some reports have adjusted for intakes by using the total grams(Reference Beaudry, Galibois and Chaumette39) or servings(Reference Slattery, Boucher and Caan40). Another limitation of factor analysis is that the investigator is required to decide the number of factors. In our study, we used eigenvalues, scree plots and interpretablility(Reference Newby and Tucker41) of factor loadings to assist us in choosing those most appropriate factors.
In summary, dietary patterns of newlyweds living in Shanghai Baoshan District were associated with body weight changes during marital transition. A sweets and fats pattern characterized by frequent consumption of sugars and preserves, condiments and oils may be associated with more weight gain in men, while a poultry, beef and mutton pattern that is high in poultry, lean meat, fruits, tubers and starches, and coarse cereals was inversely associated with weight gain during marital transition in both men and women.
Acknowledgements
This project was supported by KFC Nutrition Foundation, China (2009). The authors declare no conflict of interest. Y.F.Z. and H.T. contributed equally to the manuscript. Y.F.Z. wrote the paper and analysed the data. H.T. and X.D. developed the research question, collected and entered the data. H.E.H. carried out the interviews. G.S.H. conceived and managed the project, assisted with the data analysis, read all versions of drafts and revised them significantly. All authors read and contributed to the final version of the manuscript. The authors wish to thank all study participants for their cooperation and all interviewers and programmers who devoted their energy to collect and enter all the data.


