


Epidemiological studies have reported an inverse relationship between wholegrain cereal consumption and the development of chronic diseases, including CVD and diabetes(Reference Montonen, Knett and Javinen1). Oats are usually consumed as wholegrain and one of the few foods with a Food and Drug Administration health claim of cholesterol reduction(2). However, the mechanisms of the health effect of wholegrain oat cereals are not clear with the potential to exert beneficial effects on colonic microbiotica, and the impact of such changes on metabolic outcomes, has been poorly studied. The aim of the current human subjects study was to investigate the prebiotic potential and plasma lipid effects of consuming a wholegrain oat-based cereal previously shown to have low glycaemic index (GI) and in vitro prebiotic activity(Reference Connolly, Lovegrove and Tuohy3).
Thirty men and women, mean (sd) age 31.3 (5.2) years, BMI 26.2 (1.0) kg/m2 ‘at risk’ of developing metabolic disease completed a randomised, controlled, double-blind, cross-over, dietary intervention study. Volunteers were randomised to consume 45 g of either low GI whole oat grain (WOG) or a high GI non-wholegrain (NWG) breakfast cereal daily for 6 weeks, separated by a 4-week wash out period. Blood and faecal samples were collected at weeks 0, 6, 10, 16 and 20 for analysis of lipids and faecal bacterial number and diversity, respectively. Four-day diet diaries were completed in each intervention period to determine nutrient intake following analysis using Dietplan6.
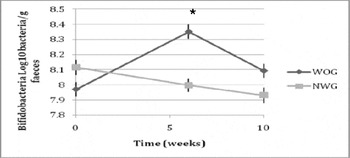
Fig. 1. Population sizes of Bifidobacterium spp.
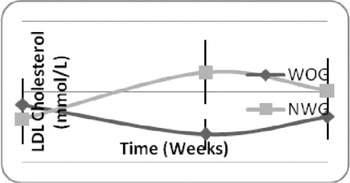
Fig. 2. Concentrations of LDL-C.
A significant time-by-treatment interaction was observed for population sizes of faecal bifidobacteria (P=0.0001) (Fig. 1), lactobacilli (P=0.001) and total bacteria (P=0.008) in which higher size was observed following consumption of WOG compared with NWG cereal. A significant time-by-treatment interaction for LDL-cholesterol (P=0.02) (Fig. 2) and total plasma cholesterol (P=0.0001) was also observed, with lower concentrations after consumption of WOG compared with the NWG. Bacteria and lipids returned to near baseline levels after 4 weeks washout. It was also observed that there was a significantly higher dietary intake (expressed as % of total energy intake) of total fat (P=0.0003), PUFA (P=0.026) and MUFA (P=0.0001) during the WOG consumption period (data not shown). In summary consumption of low GI WOG cereal for 6 weeks resulted in a significant prebiotic activity that may have contributed to the hypocholesterolaemic effects observed, although more studies are required to confirm these data.
Funds were received from the University of Reading Research Endowment Trust Fund and Jordsans, UK.


