


As adult and childhood obesity levels continue to climb, it is imperative to investigate candidate factors that could be driving the epidemic(Reference Hales, Carroll and Fryar1). It is well-established that marketing for energy-dense, nutrient-poor food and beverage products can have a profound impact on unhealthy behaviours in children(Reference Boyland and Halford2). Historical food marketing research has focused on television advertising, but newer studies have begun to focus on diverse social media platforms (e.g. Facebook and Twitter)(Reference Falbe, Willett and Rosner3–Reference Nicholls6). However, there has recently been a marked shift in the preferred social media source among individuals, particularly teenagers. A 2018 Pew Charitable Trust survey found that only 51 % of individuals aged 13–17 years use Facebook, down from 71 % in 2014 and 2015; those interviewed in 2018 overwhelmingly noted YouTube and Instagram as their most frequented social media applications(Reference Anderson and Jiang7). These platforms incorporate an increasingly popular form of delivering user-generated content called livestreaming, whereby a user can broadcast live audiovisual material to a myriad of viewers around the world.(Reference Anderson and Jiang7,Reference Brü ndl and Hess8) While livestreaming functionality exists on YouTube and Instagram, the major drawback of these sites is the pre-recorded content. In contrast, the increasingly popular, hybrid social media platform Twitch.tv (Twitch) relies almost exclusively on livestreaming for the generation of its content. In fact, Twitch is currently the largest livestreaming platform, broadcasting 355 billion minutes of content to an average of 15 million unique daily visitors(9).
The popularity of Twitch was brought to the forefront in 2015 when it was acquired by Amazon for $970 million USD(Reference Kim10). With 1·2 million average concurrent viewers at any given time, Twitch has more viewership than established broadcast networks such as CNN and MSNBC (783 000 and 885 000 in 2017, respectively) and similar viewership to sports networks such as ESPN (approximately 1·5 million in 2017)(11,Reference Gilbert12) . As of January 2017 (the most recently available demographic data), Twitch users are reported to be overwhelmingly male (91 %) and young adults (60 % between the ages of 18 and 34 years). Only 15 % of users are reportedly above the age of 35, and 57 % of individuals are noted to not possess a completed college degree(13). This may suggest that Twitch largely caters to a younger male population in a setting that is largely unmonitored and unregulated(Reference Reames14).
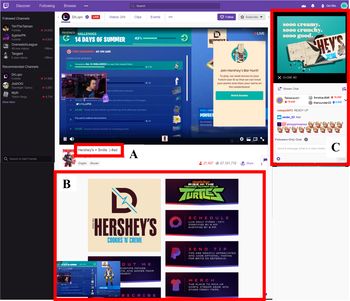
To understand how various marketing techniques can be applied on Twitch, it is important to have a grasp of the content viewing environment. In addition to traditional video advertisements that are viewed at the start of a stream (such as would be encountered on YouTube) or triggered at any time during the stream by a streamer, Twitch also includes a variety of unique methods of engaging users with marketing content. For example, directly below the main video stream is the title (Fig. 1, Box A), which is often used to promote the stream and indicate segment sponsors. Directly below the stream title is the streamer’s general profile information (Fig. 1, Box B). The profile section allows the streamer to communicate pertinent information to the viewer such as their personal interests, channel rules and stream sponsors. As the viewer is watching the livestream, he or she has the opportunity to participate in a live chat room (Fig. 1, Box C), which allows the user to actively communicate with the streamer and other individuals concurrently viewing the livestream in real time. The streamer profiles, titles and chat room are all features of Twitch which have the capabilities to include mentions of brands by both the streamer (profiles and titles) and their viewers (chat room). Mentions may be casual or due to direct sponsorship agreements.

Fig. 1 Overview of the Twitch viewing environment. Example of the screen a user would be exposed to while watching a livestream on Twitch. Box A is the location of the stream title, Box B is an example of a streamer’s profile and Box C is the location of the chat room
Twitch has developed structured ‘affiliate’ and ‘partner’ programmes for the monetisation of the platform. In 2017, there were over 150 000 affiliate streamers and over 27 000 partner streamers(9). Affiliates have the ability to earn a share of the proceeds from donations made to their channel, products suggested for purchase in the Amazon.com marketplace, as well as game-related items bought through the streamer’s dashboard(15). An affiliate can also apply to become a partner, which allows for further stream monetisation by providing streamers with a portion of the revenue generated from advertisements and product promotions on their channel(16). Such techniques make streamers incredibly influential marketers, and many of those who stream on Twitch extend their marketing power onto other social media platforms(17).
The potential for influencer marketing to drive product attitudes and consumption has already been demonstrated on diverse social media platforms. For example, randomised controlled trials on both Instagram(Reference Coates, Hardman and Halford18) and YouTube(Reference Coates, Hardman and Halford19) demonstrate that children exposed to influencers consuming unhealthy products were more likely to consume unhealthy snacks compared with children exposed to non-food or healthy food products. On Twitch, influencer marketing can take multiple forms, including product discussions and endorsements, product placements on streams, interactive mini games revolving around a product during the stream and live product giveaways. The real-time interaction between the streamer and the user allows for active and engaging discussion about the brand. This type of interaction is unique compared with traditional social media sites which typically engage viewers in a more delayed form of comments and responses(Reference Marsden20).
Furthermore, advertising on Twitch frequently extends beyond partnerships with just one streamer. Often, marketing campaigns will involve several streamers or even a team of streamers. Additionally, companies, such as Wendy’s and Red Bull Energy Drink (Red Bull), have their own Twitch channel where they can exclusively stream sponsored content and promote streamers by allowing them to stream from their channel(Reference Reames14). Some brands have even gone as far as to embed themselves into popular games. For instance, Wendy’s partnered with Fortnite (a popular free-to-play, battle-royale styled game that earned $2·4 billion USD in 2018) to stream a modified version of the game in which the purpose was to destroy freezers of frozen beef(Reference Reames14,Reference Handrahan21) . Similarly, Hershey’s candy ran a campaign in 2019 with a popular streamer in which users collected candy bars as they popped up on the screen in order to collect points for a reward at the end of sponsored segment.
Outside of individual influencers and channels, brands also frequently partner with eSports leagues, which broadcast competitions on Twitch to millions of users around the world. For example, the 2014 League of Legends championship garnered over 27 million unique viewers, more than the soccer World Cup final (26·5 million), Major League Baseball World Series (15·8 million), the National Basketball Association Finals (15·5 million) and the Daytona 500 (9·3 million)(Reference Schwartz22). Doritos has even partnered directly with Twitch to host their own tournament known as the ‘Doritos Bowl.’ This competition, held in 2018, had a top prize of $100 000 USD and generated over 600 000 h of viewership over the day-long competition(23). These eSports events draw direct parallels to more traditional broadcast sports and use similar marketing tactics, such as video advertisements and player endorsements. Much like traditional sports, eSports competitions are also frequently sponsored by brands promoting sugar-sweetened beverages and processed foods including Coca-Cola, Mountain Dew and Totino’s(Reference Hultgren24). One major difference, however, is that the general public can engage with many of these eSports ‘stars’ on a daily basis from their computers, forming deeper relationships potentially enhancing the effect of product endorsements(Reference Sjöblom and Hamari25).
Influencer marketing has already been suggested as a factor that can influence eating behaviours(Reference Coates, Hardman and Halford18). Therefore, understanding the marketing prevalence and reach that food and beverage companies have on highly popular interactive platforms such as Twitch is of paramount importance. Confirmation of such marketing reach would inform the need for future studies examining the impacts of these efforts on attitudes and behaviours related to food. While exposures to food and beverage marketing have already been characterised on more ‘traditional’ social media platforms such as Facebook and YouTube, there exists a dearth of research on exposures in streaming platforms such as Twitch(Reference Freeman, Kelly and Baur5,Reference Coates, Hardman and Halford26) . Therefore, this paper seeks to capture and evaluate the state of food and beverage marketing on the popular video game livestreaming platform Twitch across five categories of products: processed snacks; candies; restaurants and food delivery services; energy drinks, coffees and teas; and sodas and other sugar-sweetened beverages (including diet sodas). Specifically, this study investigates the longitudinal prevalence of brands between January 2018 and July 2019 in three facets of the Twitch platform: streamer profiles, stream titles and chat room discussion.
Methods
Generation of brand and product search terms
Prior to data collection, three researchers generated a list of common brands and products within the five categories of interest (similar to categorisations found in other food marketing literature such as the Rudd Center for Food Policy and Obesity)(27) based on previous analyses on television marketing, known brand partnerships with Twitch, and sponsors of eSports leagues which commonly stream on Twitch(Reference Harris, Schwartz and Brownell28–33). Only general brand names and products were searched, and no stratification was done by product variants (e.g. ‘Coke’ v. ‘Coke Zero’). Once the list was generated, three members of the research team reviewed it and excluded brands and products that were unanimously determined to overlap with words within typical gaming vernacular (e.g. ‘Sonic’ could refer to the restaurant or the video game franchise). The same members of the research team also added colloquial variations of specific brands that would not be captured by simple letter replacements (e.g. ‘Coca-Cola’ and ‘Coke’). After this, the remaining team members reviewed the list for completeness. Furthermore, due to common misspellings of proper names which can easily be encountered in informal settings such as the Twitch chat rooms, brands that contained hyphens, apostrophes or spaces were included with and without the proper punctuation and spacing (e.g. ‘Reese’s’ and ‘Reeses’, ‘Betty Crocker’ and ‘BettyCrocker’). Brands containing the letter ‘z’ were also modified to be searched with both the original spelling and with the letter ‘s’ replacing any instance of ‘z’ (e.g. ‘Cheez-Its’ and ‘Chees-Its’). In total, 454 search terms were generated (including alternative spellings) to search for 238 brands and products across five distinct categories for analysis: processed snacks; candies; restaurants and food delivery services; energy drinks, coffee and tea (i.e. heavily caffeinated beverages); and sodas and other sugar-sweetened beverages. A full list of initial candidate terms (including those eventually excluded) is available as online supplementary material (see Appendix A).
Data collection
To assess the prevalence of each brand across Twitch, three unique facets of the platform interface were examined: the profile page of each streamer, the stream titles of each individual stream and the chat room logs. All data were captured using Stream Hatchet© (Stream Hatchet SLU), an analytics platform used by several eSports organisations that specialises in collecting metrics across a variety of streaming platforms(31,Reference Neufeld34) . Brand prevalence and hours of viewership from streamer profiles and stream titles were obtained using a Python 3 script that implemented the Selenium library to interact with the Stream Hatchet graphical user interface and automatically and iteratively search each brand and product. Streamer profile and stream title data were collected for January 2018 through July 2019, and all streamers with an active profile at any time during this period were captured for analysis. In contrast, a sample of chat room messaging data and corresponding viewership was collected using the Stream Hatchet Application Program Interface via a Python 3 script for 1 July 2019 through 21 July 2019 (the full amount that was available). The chat room data collected consisted of only aggregate counts of messages. Therefore, the content of the messages, as well as any identifying information on which user sent the message, was not available to the research team.
Data analysis and post-processing
To assess the prevalence of each brand or product on streamer profile pages, the number of viewer hours, defined as how long individuals spent on each streamer’s page, was used as an approximate measure of the amount of total exposure to the brand. For stream titles, the number of viewer hours spent watching a stream under that title was used to estimate brand exposure. For chat messages, prevalence was determined by both the number of aggregate messages sent (to gauge active discussion of the brand) and aggregate hours that each message was viewed by other users (to gauge general brand exposure). The total hours for each brand category was calculated per month and overall for the respective time frames of interest (18 months of streamer profile data and stream title data, 1 month of chatroom data) in order to determine the amount of exposure in each category via profiles, stream titles and chats. Additionally, the top five overall brands from each category, as determined by the total number of hours of exposure, were recorded and reported. This was done for the overall data collection period as well as on a monthly basis for the streamer profile and stream title data.
For each brand that appeared in the top five in at least one month, a member of the research team examined the ten most viewed profiles where the brand was mentioned. This was meant to serve as a ‘quality control’ check to contextualise the data pulled and ensure that any mentions of the brand were indeed referring to the brand and not an unrelated use of the word (e.g. referring to ‘.jif’ files instead of ‘JIF Peanut Butter’). In cases where <80 % of the profiles, stream titles or chat messages were referring to the brand, that brand was removed from the analysis and the top five brands were re-determined, as the word searched was no longer considered a food brand but a reference to another product or service. This process was conducted iteratively until researchers were confident that the mentions of the brands that appeared in the top five were actually referring to the brands of interest. As an additional quality check, the pages of the top twenty-five Twitch streamers (as determined by number of daily viewers) were manually examined in order to evaluate whether brand profile data had been effectively captured during the data mining process. Profile brand data that were not captured (as a result of the underlying XHTML not including the name of the brand) were manually searched with the StreamHatchet graphical user interface, and the resulting values were added to the corresponding counts.
To assess whether exposure to the different product categories changed over time, a simple linear regression was conducted for each category, regressing hours of exposure on time. This was done for profiles and stream title data, both of which had longitudinal data available. The average hours of overall exposure per category were also calculated and compared with a one-way ANOVA with a post hoc Tukey honest significant difference test. Additionally, a percentage change in hours viewed for each category was calculated to assess aggregate differences between January 2018 and July 2019. Since chat room data were not longitudinal, only an ANOVA with a post hoc Tukey honest significant difference test was performed to evaluate whether significant differences in either number of messages or hours of viewership existed between product categories. All statistical analyses and data processing were conducted in RStudio with the R statistical programming language (version 3.6.1), while all data mining was conducted in Jupyter Notebook and the Spyder integrated development environment with Python 3 (version 3.7.0). All code is available at github.com/cpollack736/TwitchFoodBeverageAdvertising and github.com/jasonminsookim/ds_streamhatchet.
Results
Profiles
Between January 2018 and July 2019, there were significant longitudinal increases in the hours of exposure for restaurants and food delivery services (3976 % increase; β = 1 714 062, 95 % CI 1 008 628, 2 419 496, P < 0·001), candies, (75 % increase; β = 263 554, 95 % CI 724, 526 385, P = 0·049) and energy drinks (138 % increase; β = 2 274 677, 95 % CI 1 098 542, 3 450 812, P < 0·001) on streamer profiles (see Fig. 2). In contrast, sodas and other sugar-sweetened beverages experienced significant decrease in exposure during the study window (36 % decrease; β = –482 695, 95 % CI –845 670, –119 720, P = 0·012). A non-significant decrease was observed in the processed snack category (34 % decrease; β = 375 934, 95 % CI –103 271, –855 140, P = 0·116).

Fig. 2 Longitudinal trends in viewership of product categories across Twitch streamer profiles. Total hours of viewership from streamer profiles across all brands searched within the five categories of interest. (A) Raw counts of hours of exposure per month, summed over all brands searched for that category. (B) Trend lines for each category (note that these bands are not shown in some lines as a result of the figure scale). Energy drinks (P < 0·001), restaurants and food delivery services (P < 0·001), and candies (P = 0·049) all experienced a significant increase in exposure over time, while sodas and other sugar-sweetened beverages had a significant decrease over time (P = 0·012). Processed snack exposure did not significantly change (P = 0·116)
There was a significant difference in the average exposure between categories (P < 0·001), and post hoc testing suggested that this was driven by significant differences between energy drinks and three distinct categories: processed snacks (P < 0·001); sodas and other sugar-sweetened beverages (P < 0·001); and candies (P = 0·016). Overall, energy drinks, coffees and teas had the most exposure (1·08 billion hours) on streamer profiles alone during the study window followed by restaurants and food delivery services (345 million hours); processed snacks (171 million); sodas and other sugar-sweetened beverages (164 million); and candies (63·9 million). The five brands with the most exposure for energy drinks were G-Fuel, Monster Energy, Madrinas Coffee, Red Bull and Mountain Dew (including Game Fuel). For restaurants and food delivery services, the top brands were Grubhub, Uber Eats, Chipotle, Taco Bell and Kentucky Fried Chicken. For processed foods, the top brands were Oreo, Chex, Pringles, Totino’s and Nutella. For sodas and other sugar-sweetened beverages, the top brands were Dr. Pepper, Coca-Cola, Fanta, Pepsi and Kool-Aid. For candies, the top brands were Reese’s, Kit-Kat, Twix, Hershey’s and Skittles. For specific brand details and counts see online supplementary material, Appendix B.
Stream titles
There was a statistically significant increase in the hours of exposure received on stream titles from January 2018 to July 2019 for sodas and other sugar-sweetened beverages (700 % increase; β = 21 501, 95 % CI 2992, 40 009, P = 0·025) and candies (463 % increase for candy brands; β = 7092, 95 % CI 1862, 12 321, P = 0·011; Fig. 3). There were non-significant increases for energy drinks, coffees and teas (231 % increase; β = 209 052, 95 % CI –114 510, 532 614, P = 0·191); processed snacks (600 % increase; β = –32 566 95 % CI –142 158, 77 026, P = 0·539); and restaurants and food-delivery services (905 % increase; β = 5822, 95 % CI –36 200, 47 844, P = 0·774).

Fig. 3 Longitudinal trends in viewership of product categories across Twitch stream titles. Total hours of viewership from stream titles across all brands searched within the five categories of interest. (A) Raw counts of hours of exposure per month summed across brands searched within each category. (B): Trend lines for each category. Sodas and other sugar-sweetened beverages (P = 0·025) and candies (P = 0·011) saw a significant increase in exposure over time. Processed snacks (P = 0·539); restaurants and food delivery services (P = 0·774); and energy drinks, coffees and teas (P = 0·191) did not experience the same linear trend
There was a significant difference in the average amount of hours of exposure each category received (P < 0·001), with post hoc testing suggesting that energy drinks, coffees and teas received significantly more hours of exposure from stream titles than any other category (all P < 0·001). Energy drinks, coffees and teas had the highest level of mentions (83 million hours) during the study window followed by processed snacks (9·01 million hours), restaurants and food delivery services (6·75 million), sodas and other sugar-sweetened beverages (2·83 million), and candies (0·97 million). The five brands with the most exposure for energy drinks were G Fuel, Red Bull, Mountain Dew (including Game Fuel), Madrinas Coffee and Full Throttle. For restaurants and food delivery services, the top brands were Grubhub, Burger King, Kentucky Fried Chicken, Chipotle and Uber Eats. For processed foods, the top brands were Totino’s, Doritos, Nutella, Oreo and Chex. For sodas and other sugar-sweetened beverages, the top brands were Coca-Cola, Pepsi, Kool-Aid, Fanta and Dr. Pepper. For candies, the top brands were Reese’s, Snickers, Hershey’s, Skittles and Kit-Kat. For specific brand details and counts see online supplementary material, Appendix C.
Chat messages – total messages
For chat room messages, restaurants and food delivery services had the most mentions (1·24 million messages) during the period for which data were available, followed by sodas and other sugar-sweetened beverages (1·10 million messages); energy drinks, coffees and teas (992 000 messages); processed snacks (332 000 messages); and candies (213 173 messages; Fig. 4). There was a significant difference between categories in the number of messages sent (P = 0·042); however, post hoc testing indicated no pairwise significant differences. The five brands with the most messages for energy drinks were G Fuel, Mountain Dew (including Game Fuel), Red Bull, 5-hour Energy and Monster Energy; for restaurants and food delivery services, the top brands were McDonald’s, Taco Bell, Chick-fil-A, Kentucky Fried Chicken and Domino’s; for processed foods, the top brands were Oreo, Doritos, Cheetos, Nutella and Pringles; for sodas and other sugar-sweetened beverages, the top brands were Coca-Cola, Kool-Aid, A&W, Pepsi and Dr. Pepper; for candies, the top brands were Reese’s, Kit-Kat, Snickers, Skittles and Twix. For specific brand details and counts see online supplementary material, Appendix D.

Fig. 4 Total Twitch chat room messages sent. Total number of chat room messages across all brands searched within the five categories of interest (P-value = 0·042)
Chat messages – messages views
Messages including references to sodas and other sugar-sweetened beverages had the most total views (1·97 billion views), followed by energy drinks, coffees, and teas (1·54 billion views), restaurants (1·09 billion views), candies (0·298 billion views), and processed snacks (0·240 billion views; Fig. 5). However, there was no significant difference between categories in hours of viewership (P = 0·126). The five brands with the most exposure for energy drinks were G Fuel, Mountain Dew Game Fuel, Red Bull, Madrinas Coffee and Monster Energy; for restaurants and food delivery services, the top brands were McDonald’s, Uber Eats, Chick-fi-A, Kentucky Fried Chicken and Taco Bell; for processed foods, the top brands were Oreo, Pringles, Doritos, Cheetos and Nutella; for sodas and other sugar-sweetened beverages, the top brands were Coca-Cola, Dr. Pepper, A&W, Kool-Aid and Pepsi; for candies, the top brands were Reese’s, Snickers, Hershey’s, Kit-Kat and Twix. For specific brand details and counts see online supplementary material, Appendix E.

Fig. 5 Total hours of viewership for Twitch chat room messages. Total viewership from chat room messages across all brands searched within the five categories of interest (P = 0·126)
Discussion
Overall, energy drinks, coffees and teas consistently dominated the advertising landscape in streamer profiles and stream titles. This is not altogether surprising, as energy drinks are heavily marketed to the most common Twitch demographic group (adolescent and young adult men) as a way to improve their reaction time and overall gameplay(Reference Stout35). Energy drink marketing was largely driven by mentions of G-Fuel, which is advertised as the ‘Official Drink of Esports’ and sponsors many of the top streamers on Twitch(36). In contrast, restaurants/food delivery services and sodas/sugar-sweetened beverages were more prevalent in the chatrooms than other product categories. As streamers often eat and drink on stream, it is unsurprising that these categories are commonly talked about. Additionally, 25 % of individuals who use popular food delivery services have noted an ‘at home game night’ as the reason they chose to utilise these services(37). Similarly, 55 % of Internet users who use food delivery services are under the age of 24 years, which is in-line with the general userbase of Twitch(38). There are likely reciprocal conversations between chatroom members and the streamer about what food and drink will be consumed as the stream is broadcast. Campaigns that focus on streamers consuming food and beverage products during the livestream are therefore more likely to be successful in driving community engagement.
Comparing Twitch marketing exposure to other more traditional media sources is difficult due to the varying nature of messaging and engagement found on other platforms. Some data have been gathered in regard to the prevalence of food and beverage brands on comparable social media platforms such as Facebook. For example, a recent study evaluated the twenty-seven most popular food and beverage brand pages in Australia and found the most globally ‘liked’ brands were Coca-Cola (59·8 million likes), Red Bull (36·1 million likes) and Oreo (31·9 million likes), demonstrating their far-reach into social media. However, only 2·4 %, 1·1 % and 0·6 % of users who ‘liked’ the brand actively engaged with the Facebook page(Reference Freeman, Kelly and Baur5). Twitch chat room data suggest that users may have more follow-up interactions and conversations about the brands that are most heavily marketed on the platform. However, as the current data lack contextual information, it is impossible to conclude the sentiment surrounding products’ discussions. This underscores the importance of further understanding the potential effects that the Twitch marketing environment has on attitudes and behaviours related to the energy-dense, nutrient-poor foods that are heavily promoted.
In general, there appears to be two ways in which brands receive notoriety on Twitch: informal promotion (e.g. casual discussion or mentions of the brand without any kind of streamer sponsorship agreement) and formal advertisements (e.g. sponsorship deals between companies and the streamer). Informal promotions generated noticeable exposure for companies without overt marketing campaigns, although these are typically popular products with heavy traditional marketing campaigns. For example, while the Nabisco brand Oreo is not an official partner with any major Twitch streamer, they are mentioned on an average of 465 unique profiles per month. This unsponsored informal promotion has allowed the brand to generate millions of hours of unpaid endorsement. Another example is Kool-Aid, which received a total of 65 105 h of viewership from stream titles alone between January 2018 and July 2019 despite not running a single ad. Within the beverage category, Kool-Aid was only surpassed in viewing hours by Coca-Cola and Pepsi, both of which are known eSports partners(Reference Garst39,Reference Chen40) .
In contrast to informal promotions, formal advertisements and brand sponsorships tend to primarily occur on channels with a large number of viewers. This makes sense given that more popular channels provide a larger consumer segment and are also more likely to be Twitch partners, where a share of revenue earned on advertising goes directly back to the streamer(36,41,42) . For instance, a single Red Bull-sponsored livestreaming event by one of the most popular streamers on Twitch garnered 1·2 million hours of viewership for the brand. Since many influential streamers also utilise other social media platforms, it is likely that this event may have been viewed additional times on other platforms, highlighting the potentially widespread impact that a single influencer can have on a myriad of viewers from just one event. Comparatively, a study on two popular YouTube influencers over the course of a year found that almost the entire (92·6 %) analysed sample of 119·5 video-hours contained a reference to at least one food or beverage product(Reference Coates, Hardman and Halford26). However, since hours of viewership for these influencers is not known, a direct comparison cannot be made.
Beyond a single influencer, four Totino’s-sponsored Twitch streams during a popular electronic gaming expo led to over 4·8 million hours of viewership (as measured through the collected stream title data). This corresponded with Totino’s sudden surge as one of the most highly promoted brands in June 2018 among all product categories. Streaming events can also draw large amounts of viewers and concurrent exposure for brands. For example, an October 2018 surge in the Doritos brand exposure in this data coincided with the occurrence of the Doritos Bowl. A compelling case study in the effect that sponsored advertisements have on product viewership was seen in May 2019. The Hershey Company announced a sponsorship agreement with both Twitch and several top streamers (who have a combined following of over 7·5 million individuals) in an attempt to gain more exposure for two of its brands, Hershey’s and Reese’s(41,Reference Keefer43) . Indeed, while all candy brands have relatively consistent and similar numbers of profile views between January 2018 and March 2019, there was a 2388 % increase in the hours of exposure to the Reese’s brand between March 2019 and April 2019. The Hershey’s brand experienced a similar jump from a total of 2306 h of profile views in March 2019 to 3 419 285 h of profile exposure in April 2019 – an increase of 148 177 % in a single month.
The extensive amount of food and beverage advertising present on Twitch is vastly under-regulated compared with other media platforms with similar demographics. While US federal laws require the disclosure of paid sponsored advertisements (which on Twitch typically manifests as the appearance of ‘#ad’ or ‘#sponsored’ in a stream title), many stream titles still include various product names despite not actually being paid for by a company(44). Furthermore, a study based on YouTube found that advertising disclosures actually significantly increased the consumption of the marketed product compared with a control group, completely contrary to goal of the disclosure(Reference Coates, Hardman and Halford19). Similarly, in 2017, the UK banned the advertisements of foods high in saturated fat, salt and free sugars on non-broadcast media, including social media platforms, where greater than 25 % of the market is children(45). Those regulations also account for the role of influencers in promoting products. However, the impact of those regulations on children’s and adolescent’s exposures to food advertisements via Twitch remains unknown. Given the enormous amount of potential exposure that could be generated through Twitch as demonstrated through this study, it is vital to evaluate how regulatory practices can be expanded to incorporate this newly identified exposure pathway.
This study is the first to present an evaluation of 238 unique food and beverage products and their longitudinal advertising reach on the social media livestreaming platform Twitch. Despite the numerous strengths of the study, several limitations are necessary to mention. The amount of available chat data was limited to the most recent month, preventing a comparable longitudinal analysis to the profile and stream title data. Another limitation occurred with the graphical user interface searches, which would occasionally pull partial matches or exclude certain brands entirely if the underlying parsed XHTML did not directly include the brand name in the associated string. A known example of this occurred with a Reese’s advertisement on a top streamer’s page with underlying XHTML that did not include the name of the brand. This was remedied by having a member of the research team check the XHTML of the top 100 streamer pages to ensure no major advertisements were missed. While these data were manually added, it is possible that pages with fewer followers that contained advertisements were missed leading to an underestimation to the hours of viewership. Given the fact that brand sponsorships are predominately with streamers with the most followers, it is unlikely that any major sponsored products were missed. Similarly, it is possible that some mentions were not actually referring to the brand in-context. While a subset of the research team made every effort to remove candidate brands that were referring to other definitions, future research could utilise natural language processing technologies or other automated software processes to contextualise brand mentions and ensure a more precise count. Future work could additionally include and differentiate between product variants. It is also important to note that this study only evaluated streamer profiles, stream titles and chat rooms. However, video advertisements are also present in the form of commercials before and during the streams, and ‘pop-up’ advertisements are found near the chat window. These advertisements, as well as brand logos that may be present throughout the livestream as part of the streamers overlay, were not included in this analysis. As such, the hours of product exposure described here are constrained to these non-traditional marketing aspects of Twitch and are therefore are an underestimation of the total amount of marketing efforts currently conducted on Twitch. Additionally, the available Twitch demographic data were limited to 2017, and user characteristics and sponsorship patterns may have changed over time. Lastly, this study only looks at the prevalence of the brands on the Twitch platform, and it is unknown as to how these exposures impacted user behaviour.
Future directions
The results of this study elucidate the extent of food and beverage marketing that is currently happening on Twitch and suggest a continued increase in such marketing efforts. Therefore, future investigation on the impact of these exposures on eating behaviours and attitudes is warranted. Further investigation is also needed to assess the impact of both casual mentions and the targeted advertising that is seen on Twitch on metrics such as attitudes, sales and consumption of products. Similarly, given the limited availability of chat room data in this study, additional evaluation on the longitudinal patterns in chat messages, as well as content and sentiment analysis of the actual messages, is warranted. Additionally, it is vital to assess how recent changes in the livestreaming landscape have an impact on the spread of advertising. With the constant addition of tools for marketers, it is likely that new forms of influencer market will emerge. In general, as Twitch and other livestreaming platforms continue to grow in popularity, it is vital to understand how additional exposures to energy-dense, nutrient-poor products could contribute to adverse health outcomes. Future studies may also want to consider the impacts of marketing across a variety of social media platforms as Twitch streamers also typically have active Facebook, Twitter, Instagram and YouTube accounts, suggesting that sponsorships are likely to extend to these platforms.
Conclusion
This study is the first to perform a sweeping analysis of the marketing and mentions of a wide variety of food and beverage products on the livestreaming platform Twitch. The data show a rise in the overall mention of food and beverage products on Twitch, particularly energy drinks. Individuals who use Twitch are exposed to up to tens of millions of hours of brand mentions and marketing of energy-dense, nutrient-poor products through streamer profiles, stream titles and messages sent in live chat rooms. These advertisements are pervasive and promoted to an audience predominately made up of male adolescents and young adults. Future research is vital to understand how exposure to the interactive nature of the Twitch advertising environment impacts the consumption and utilisation of products marketed on live streams.
Acknowledgements
Acknowledgements: None. Financial support: Data were collected with support from the National Institutes of Health (NIH) through a NIDA postdoctoral fellowship (T32DA037202, PI: Alan J. Budney) awarded to T.D.M. Conflict of interest: None. Authorship: J.A.E., J.B., D.G.D. and T.D.M. formulated the research question; C.C.P., J.K., D.G.D. and T.D.M. designed the study; C.C.P., J.K. and T.D.M. carried out the study; C.C.P. and T.D.M. analysed the data; C.C.P. and T.D.M. drafted the initial manuscript; all authors approved the final manuscript. Ethics of human subject participation: No data were collected from individuals. Only publicly available aggregate data were analysed.
Supplementary material
For supplementary material accompanying this paper visit https://doi.org/10.1017/S1368980020002128.


