


Childhood obesity is associated with significant morbidity and mortality(Reference Sommer and Twig1,Reference Lindberg, Danielsson and Persson2) . Co-morbidities associated with childhood obesity affect almost every body system, including, but not limited to, endocrine, cardiovascular, cardiometabolic and musculoskeletal systems(Reference Kumar and Kelly3). Worldwide prevalence of childhood overweight and obesity increased from 12·8 % in 2000 to 14·2 % in 2013 and is expected to reach 15·8 % in 2025(Reference Lobstein and Jackson-Leach4). Growth trajectories for childhood obesity into adulthood indicate that 57·3 % of today’s children and 75 % of children currently with obesity will be obese at the age of 35 years(Reference Ward, Long and Resch5). Monitoring and tracking of obesity in childhood appears critical to determine when preventative or management interventions should be taken.
Obesity is defined as excess fat accumulation that may impair health(6). However, obesity is commonly measured by BMI which, in children, is transformed into BMI z-scores to define age- and sex-specific cut-offs for overweight and obesity(Reference Cole, Freeman and Preece7). BMI is useful for tracking changes in obesity prevalence in populations; however, the relationship between BMI and adiposity is not consistent across populations and assumes a linear increase in body mass and fat mass through childhood(Reference Maynard, Wisemandle and Roche8,Reference Wells, Fuller and Dewit9) . Measures of adiposity (i.e. fat mass relative to body mass (%FM)), rather than weight relative to height, provide accurate assessment of obesity status and may provide better indication of the effectiveness of weight loss programmes(Reference Kyle, Earthman and Pichard10,Reference Wells, Williams and Chomtho11) .
Reference methods of measuring adiposity include computerised tomography, magnetic resonance imaging, dual-energy X-ray absorptiometry, isotope dilution and combinations of methods to construct three (3C) and four (4C) compartment models. Reference methods are accurate assessments of %FM (compared with ‘gold-standard’ cadaver analysis)(Reference Talma, Chinapaw and Bakker12), because measurements of hydration status and mineral content are included in the %FM calculation(Reference Wells, Fuller and Dewit9). However, in comparison with two compartment (2C) models of body composition, that partition the body into fat mass and fat-free mass (e.g. air displacement plethysmography (ADP) and bioelectrical impedance analysis (BIA)), reference methods are costly, time-consuming, and invasive and may not be suitable for children(Reference Lobstein, Baur and Uauy13). Although 2C models of body composition are subject to error arising from variation in fat-free mass composition(Reference Wells, Fuller and Dewit9), they are more accessible to clinicians and researchers and less burdensome on participants.
ADP is an indirect method to determine body volume, using a volumetric chamber into which a participant is introduced, by recording pressure changes under isothermal and adiabatic conditions(Reference Dempster and Aitkens14). Equations that include assumed densities of fat and lean tissues are used to calculate %FM. BIA is an indirect measure of total body water from which an empirical relationship with fat-free mass can be derived using subject-specific regression equations. Previous studies generally indicate that measures of %FM by ADP (%FMADP)(Reference Wells, Williams and Chomtho11,Reference Wells, Fuller and Wright15,Reference Gately, Radley and Cooke16) , rather than BIA (%FMBIA)(Reference Wells, Fuller and Dewit9,Reference Lazzer, Bedogni and Agosti17) , have better agreement with reference measures in paediatric populations. However, age, sex, BMI and BIA device all impact the estimation of %FM and should therefore be considered in %FM prediction equations(Reference Wells, Williams and Chomtho11,Reference Lohman and Goring18) .
Few studies have compared measures of %FM derived from ADP and BIA in paediatric populations(Reference Chula de Castro, Rodrigues de Lima and Santos Silva19), generally finding that %FMADP was greater than %FMBIA (Reference Foucart, De Decker and Sioen20,Reference Michels, Huybrechts and Bammann21) . Whilst these studies benefit from large sample sizes, comparisons between methods were not distinguished based on weight status which can impact estimates of body composition(Reference Gutierrez-Marin, Escribano and Closa-Monasterolo22). One study which did compare %FMADP and %FMBIA in both participants with and without obesity(Reference Azcona, Köek and Frühbeck23) measured %FMBIA using a foot-to-foot device (measuring only part of the body) and %FMADP using general(Reference Siri, Brozek and Henschel24), rather than child-specific regression equations(Reference Wells, Williams and Chomtho11,Reference Lohman25) . Comparisons between %FM methods should be made using age-specific equations, controlling for gender and weight status(Reference Gately, Radley and Cooke16,Reference Joffe, Welle and Roubenoff26,Reference Williams, Wake and Campbell27) .
Reliability of %FM measurements in children have been conducted, showing intraclass correlation coefficients (ICC) of > 0·90 from BIA(Reference Talma, Chinapaw and Bakker12) and > 0·93 from ADP(Reference Holmes, Gibson and Gualberto Cremades28). Vicente-Rodriguez et al. (Reference Vicente-Rodríguez, Rey-López and Mesana29) reported intra-day reliability of %FMADP and %FMBIA in eighty-four adolescents (13-to-17 years old). Technical error of measurement (TEM) was 1·07 % and 0·74 % for ADP and BIA respectively, with correlation coefficients of 0·989 and 0·993 for ADP and BIA, respectively. However, there is a paucity of research that has assessed the reliability of ADP and BIA methods in one cohort, with no studies investigating this in a cohort of children < 12 years.
A recent systematic review suggests that ADP has similar validity to dual-energy X-ray absorptiometry and isotopic dilution methods to assess %FM in children with obesity(Reference Orsso, Silva and Gonzalez30). ADP has been considered as a ‘standard’ method of body composition assessment(Reference Azcona, Köek and Frühbeck23) to which BIA methods can be compared for validity and reliability(Reference Foucart, De Decker and Sioen20,Reference Michels, Huybrechts and Bammann21) . Measures of body fat by ADP offers greater agreement with reference measures, but BIA offers faster, more convenient and inexpensive field-based measures of body fat. Therefore, the aim of this study was to measure concurrent validity and reliability of %FMADP and %FMBIA in 6-to-12-year-old children with and without obesity. We hypothesise that %FMBIA will be underestimated compared with %FMADP, and that in boys with obesity, %FMBIA will be underestimated to a greater extent compared with boys without obesity. Compared with studies that have not used age-specific equations for body composition, we expect to find less difference between %FMADP and %FMBIA. Finally, we hypothesise that both %FMADP and %FMBIA methods will be reliable, in keeping with literature involving older children. The findings will help practitioners determine whether %FMADP and %FMBIA can be used interchangeably and reliably in children.
Method
Participants
Seventy-one boys underwent assessment of body composition by BIA and ADP (age: 10·1 ± 1·70 years, height: 1·43 ± 0·11 m, mass: 39·4 ± 11·2 kg). Ten boys took part in the intra-day reliability analysis of BIA and ADP (age: 10·0 ± 2·63 years, height 1·39 ± 0·17 m, mass 33·8 ± 10·8 kg). This study was conducted according to the guidelines laid down in the Declaration of Helsinki, and all procedures involving human subjects/patients were approved by the host institution (Ref No. ETH/13/11). Written and verbal informed consent were obtained from parents and children (verbal consent was witnessed and formally recorded). Parents completed a health medical questionnaire prior to data collection; all participants were reportedly healthy at the time of the study. Obesity was defined as a %FM > 25 %(Reference Azcona, Köek and Frühbeck23).
Procedure
Participants were tested in pairs, and a randomised, crossover design was used whereby pairs were randomly assigned to be tested by either ADP or BIA, after which they completed the other test procedure immediately after the first. Each participant wore tight-fitting swimming shorts with no shoes or socks throughout both testing procedures. Participants were instructed not to eat, drink or exercise 2 h before the measurement and to void their bladder 30 min before testing. Estimates of %FM from ADP (%FMADP) and BIA (%FMBIA) were measured within the same day by the lead author. For the assessment of reliability, %FMADP, %FMBIA, body volume and resistance measurements were repeated within 10 min of the first test in order to avoid biological variation in hydration and temperature.
Air displacement plethysmography
ADP was measured using the Bodpod device following manufacturer’s protocols(Reference Dempster and Aitkens14). Each participant wore a swim cap to cover and compress head hair. The Bodpod weighing scale was calibrated before each testing session with known 20 kg weights; all calibrations were within ±0·01kg. The chamber was calibrated against a known volume cylinder (50·024l) before each testing session. Five repeated measures of cylinder volume were made during the calibration procedure. The average estimated volume was 50·047 ± 0·007l, within the accuracy and variability range of repeated measures previously reported for volumetric measures by the Bodpod(Reference Dempster and Aitkens14).
The ADP procedure involved three successive measurements of raw body volume, and the total procedure time was less than 1 min. If body volume differed by more than 0·015L between the measures, the procedure was repeated. The mean of the three raw body volumes (Vb) was corrected for isothermal conditions of air in the lungs and around the skin surface. Raw Vb was corrected for thoracic gas volumes (and skin surface area) using child-specific equations detailed in Table 1. Body density was calculated by dividing the corrected body volume by body mass and converted to %FM using sex- and age-specific equations published by Lohman(Reference Lohman25) (Table 1).
Table 1. Equations used in ADP and BIA procedures
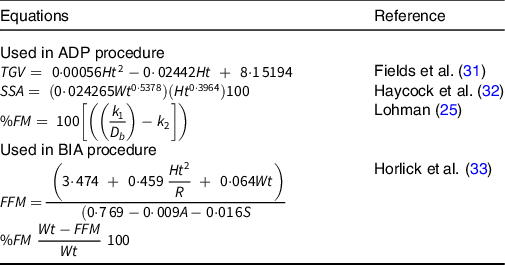
TGV, thoracic gas volume; Ht, height in cm (derived by height in m × 100); SSA, skin surface area; Wt, body mass in kg; %FM, percent fat mass; k 1 and k 2, sex- and age-specific constants; D b , body density; FFM, fat free mass; R, resistance; A, age in years; S, sex-specific constants.
Bioelectrical impedance analysis
A multi-frequency BIA device (Quantum II, RJL systems, Inc.) was used to measure body impedance in the participants. The BIA device was calibrated before each testing session using known resistance and reactance. The device recorded mean resistance figures of 384 ± 0·34Ω and reactance of 44·9 ± 1·22Ω which were within the manufacturer’s guidelines.
The participants were instructed to lay supine on a portable couch for 5 min prior to testing as per the manufacturer’s instructions to allow extracellular water to level out across the body. Electrodes were placed on the ipsilateral bony prominences of the wrist and ankle (metacarpal and metatarsal lines), ensuring the electrodes were 5 cm apart.
Reactance (X) and resistance (R) were outputted for each participant for the calculation of %FM based on sex- and age-specific equations. The equation of Horlick et al. (Reference Horlick, Arpadi and Bethel33) was chosen to estimate FFM (Table 1) based on regression analysis of impedance measures from the same manufacturer (RJL) used in the current study and has shown to be valid in paediatric populations(Reference Chula de Castro, Rodrigues de Lima and Santos Silva19). FFM was then converted to %FM (Table 1).
Statistical analysis
Concurrent validity
With obesity and without obesity group differences for age, height, body mass, raw body volume (m3), resistance (Ω), %FMADP and %FMBIA were assessed by independent t tests. Comparisons between %FMADP and %FMBIA were made for the full sample and within the with obesity and without obesity groups. Differences between %FMADP and %FMBIA were assessed by paired samples t tests. Effect sizes (ES) were calculated based on Cohen’s d and defined as < 0·2 weak, 0·2 to 0·49 small, 0·5 to 0·79 medium and > 0·79 large(Reference Cohen34). Pearson’s correlation coefficients were performed to measure the strength of association between %FMADP and %FMBIA, with 95 % CI. Correlation coefficients < 0·29 were defined as weak, between 0·3 and 0·49 moderate, and > 0·5 strong(Reference Cohen34). Agreement between %FMADP and %FMBIA were analysed using Bland–Altman analysis(Reference Bland and Altman35). This involved the calculation of the mean difference between two methods together with limits of agreement (LoA), based on 95 % CI, calculated from the standard deviation of the mean difference for each participant (multiplied by 1·96). Proportional bias and error affected by the magnitude of measurement were determined by Pearson’s correlation coefficient r > 0·5(Reference Mentiplay, Parraton and Bower36). Predicting %FMADP is considered as the ‘standard’ method for this study, to which %FMBIA was compared. To address clinical acceptability, a minimal acceptable standard for estimating %FM of ± 3·5 % (group-level difference) from the reference measure was employed(Reference Heyward and Wagner37). The sample size of 71 was calculated based on the minimal acceptable standard(Reference Heyward and Wagner37), standard error of measurement for BIA(Reference Talma, Chinapaw and Bakker12), with 80 % power and two-sided significance of 0·05.
Reliability
For comparison with previous literature on the reliability of %FM measures, three reliability statistics were calculated: technical error of the measurement (TEM and TEM%), coefficient of reliability (r xx ) and ICC as detailed in Table 2.
Table 2. Equations used to assess reliability of data
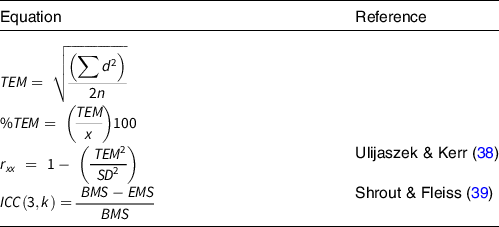
TEM, technical error of measurement; d, difference between measurements; n, number of individuals measured; x, mean percentage fat mass (%FM); r xx , reliability coefficient; ICC, intraclass correlation coefficient; k, number of measurements; BMS, between-subject variance; EMS, error (residual) mean square variance.
Results
Table 3 presents data for all participants and for the with obesity and without obesity groups. No significant differences were found between groups for age (t(69) = 1·85, P = 0·069), height (t(69) = 1·09, P = 0·212) and resistance (t(69) = 0·32, P = 0·748). The with obesity group was significantly heavier (t(69) = 2·36, P = 0·021), had a higher BMI (t(69) = 4·97, P < 0·001), greater raw body volume (t(69) = 0·75, P = 0·004), and a higher %FMADP (t(69) = 14·15, P < 0·001) and %FMBIA (t(69) = 8·80, P < 0·001).
Table 3. Age and anthropometric variables according to weight status

%FMBIA, percentage body fat measured by bioelectrical impedance analysis; %FMADP, percentage body fat measured by air displacement plethysmography.
* Significant difference between non-obese and obese groups at 0·05 level.
† Significant difference within group between ADP and BIA methods at 0·05 level.
Concurrent validity
Table 4 presents the mean difference and LoA of %FMADP and %FMBIA for all participants, the with obesity group, and the without obesity group. Compared with %FMBIA, %FMADP was significantly higher in all participants (t(70) = 5·11, P < 0·001, ES = 0·42) and in the without obesity group (t(45) = 2·98, P = 0·005, ES 0·52; Table 3); although mean differences observed were clinically acceptable (< 3·5 %), LoA were 22·3 % and 21·8 % in all participants and those without obesity, respectively. In the with obesity group, %FMADP was significantly higher compared with %FMBIA (t(24) = 4·76, P < 0·001, ES = 0·90; Table 3), with the mean difference (-5·20 ± 5·46 %) exceeding the clinically acceptable threshold of 3·5 %, and LoA of 21·8 %. A strong, significant positive correlation was found between %FMADP and %FMBIA when examining all participants (r = 0·80, P < 0·001, 95 % CI 0·64 to 0·95) and participants with obesity (r = 0·60, P = 0·001, 95 % CI 0·11 to 1). In the without obesity group, a moderate, significant positive correlation was found (r = 0·44, P = 0·003, 95 % CI 0·26 to 1). Figure 1 presents Bland–Altman plots of %FMADP and %FMBIA for all participants, those with obesity and those without obesity. No proportional bias was detected (r = 0·001), meaning agreement between measures was not affected by the magnitude of %FM.
Table 4. Differences in %FM measured by ADP and BIA (%FMBIA–%FMADP)

%FM, percentage fat mass; LoA, limits of agreement.

Fig. 1. Bland–Altman plot of percentage fat mass (%FM) from ADP and BIA. Black circles represent the without obese group, and open circles represent the with obesity group. Dashed line is mean difference (bias), and solid lines are limits of agreement (± 1·96 sd). Dotted line is the line of best fit (proportional bias). ADP, air displacement plethysmography; BIA, bioelectrical impedance analysis.
Reliability
Reliability analysis revealed that ADP resulted in lower error of %FM measures compared with BIA; TEM of 0·55 % and 0·65 %, respectively. Coefficient of reliability and ICC were also higher in %FMADP measures (0·92 and 0·95 for rxx and ICC, respectively) compared with %FMBIA measures (0·89 and 0·93; Table 5).
Table 5. Mean, sd and within-day test–retest for intra-day reliability of %FM measures (n 10)

%FMBIA, percentage body fat measured by bioelectrical impedance analysis; %FMADP, percentage body fat measured by air displacement plethysmography; TEM, technical error of measurement; ICC, intraclass correlation coefficient.
TEM% is not presented for %FM since the units are already a percentage
Discussion
The aim of this study was to compare validity of %FMBIA to the ‘standard’ %FMADP and assess intra-day reliability of both methods in the same cohort. Compared with ADP, BIA underestimated %FM in the study population, but there was no bias in differences between methods relating to obesity status (i.e. magnitude of %FM). Despite the significant correlation, there was a significant difference and large LoA between measures of %FMBIA and %FMADP. The reliability findings reported in this study reveal that %FMADP is a more reliable measure compared with %FMBIA, but both methods were highly reliable in the cohort.
Concurrent validity
Underestimation of %FMBIA compared with %FMADP in the current study is in general agreement with previous studies(Reference Foucart, De Decker and Sioen20,Reference Michels, Huybrechts and Bammann21,Reference Azcona, Köek and Frühbeck23,Reference Thajer, Skacel and Truschner40) . Previous studies have shown %FMBIA to be underestimated by 0·5–5·6 % in children and adolescents compared with %FMADP, although some %FMBIA prediction equations have resulted in an overestimation(Reference Michels, Huybrechts and Bammann21). The mean underestimation of 3·4 % found in the present study is within the range previously reported. The differences between %FMBIA and %FMADP within the with and without obesity groups also agree with Azcona et al. (Reference Azcona, Köek and Frühbeck23) who reported mean underestimation of %FMBIA compared with %FMADP among the full sample (3·39 %), without obese (2·49 %) and with obesity groups (5·01 %). Despite different BIA devices and %FM equations used between the current study and Azcona et al. (Reference Azcona, Köek and Frühbeck23), the mean differences between %FMBIA and %FMADP are similar.
Compared with the clinically acceptable differences reported by Heyward and Wagner(Reference Heyward and Wagner37), %FM differences in the without obesity group were within the ± 3·5 % clinically acceptable threshold, but in the with obesity group differences would be deemed clinically unacceptable (> 3·5 %). Despite no significant bias in differences between devices detected across levels of body fat, it does appear that BIA underestimates %FM to a greater extent. Furthermore, the LoA found in the current study are in general agreement with values of 15·3–20·6 % reported in previous studies(Reference Foucart, De Decker and Sioen20,Reference Michels, Huybrechts and Bammann21,Reference Azcona, Köek and Frühbeck23) . Whilst no consensus has been reached on what level of LoA is clinically acceptable (a range of 2 to 20 % has been reported in the literature)(Reference Orsso, Silva and Gonzalez30,Reference Brodie41,Reference Martinez, Smallwood and Quinn42) , the large LoA in the current study indicates that BIA and ADP cannot be used interchangeably to measure an individual’s %FM. Assessment of body composition must be accurate on an individual basis to correctly identify overweight and obesity(Reference Radley, Cooke and Fuller43).
Reliability
The findings from the current study suggest that repeated measurements of %FM from ADP and BIA are highly reliable in young children. These findings are comparable to other studies examining the intra-day reliability of %FMADP and %FMBIA in older children. Vicente-Rodriguez et al. (Reference Vicente-Rodríguez, Rey-López and Mesana29) measured intra-day reliability in eighty-four adolescents (13–17 years old), finding %FMADP TEM of 1·07 % FM and rxx = 0·99, and %FMBIA TEM of 0·74 % and rxx = 0·99. Resistance and body volume reliability in the current study also compared well with values of Vicente-Rodriguez et al. (Reference Vicente-Rodríguez, Rey-López and Mesana29), resistance TEM of 10·2Ω and rxx = 0·99, and body volume TEM of 0·58m3 and rxx = 0·99. Comparable reliability in the current younger cohort to adolescents reveals that children were able to adhere to the BIA and ADP procedures and follow instructions.
The intra-day reliability of body fat mass measures from ADP and BIA are dependent on environmental conditions, instructor competence and participant adherence to the procedures. Environmental variation includes pressure changes within the laboratory (from opening doors or drafts) during the procedure that can affect ADP reliability and, temperature changes in 10 min between repeated measures that can affect BIA reliability. Correct electrode placement on the ipsilateral bony prominences of the wrist and ankle (the metacarpal and metatarsal lines)(44) can be subjective. Electrode placement variability can alter impedance readings by 4 %(Reference Houtkooper, Lohman and Going45) and would have reduced reliability in this study. Variability due to procedural adherence includes movement of the participant in the Bodpod chamber or irregular breathing. These can cause pressure changes within the Bodpod influencing raw body volumes(Reference Fields, Goran and McCrory46). For this reason, ADP measures from Bodpod were taken in triplicate and, if the raw body volumes differed by > 0·015L, the procedure was started again. In order to maximise intra-day reliability of %FMADP and %FMBIA measures environmental conditions, protocols and participant preparation should be strictly monitored throughout testing procedures.
Limitations of the current study comprise the use of predicted lung volumes in ADP measurements which may impact the accuracy of %FMADP. However, young children struggle with the protocol for lung volume measurement, and error in the correction of raw body volume for air in the lungs is relatively small(Reference Wells, Haroun and Williams47). Other age- and sex-specific %FM equations are available for ADP that account for changes in hydration status with age and sex(Reference Wells, Williams and Chomtho11). However, the Lohman(Reference Lohman25) equation has been validated against 4C(Reference Fields and Alison48) and, in boys, compares well with more recent equations for %FMADP (Reference Wells, Williams and Chomtho11). The relatively short duration of food and drink abstention may have affected BIA measurements. However, longer abstention may be unethical and impractical(Reference Brantov, Ward and Jodal49). We could not collect pubertal status from our sample, and it is acknowledged that pubertal status may have improved the accuracy of both %FMADP and %FMBIA. Particularly for %FMBIA measurements, puberty/maturation status has an impact on total body water, but the current study used standardised procedures and age-appropriate equations to limit extraneous variation. Indeed, as reported by Horlick et al. (Reference Horlick, Arpadi and Bethel33) when developing the BIA equation used in the current study, including Tanner stage to the regression model for total body water had little effect on the predictive power above measures of age, height, mass and sex.
Conclusion
The results of the intra-day reliability tests revealed that both %FMADP and %FMBIA are highly reliable in boys aged 6-to-12 years. %FMBIA was significantly correlated with %FMADP in children with and without obesity. However, %FMBIA was significantly underestimated in both groups, but only in the with obesity group was it beyond the minimal acceptable standard of ± 3·5 %. Therefore, BIA may be suitable for determining %FM in boys without obesity aged 6-to-12 years. Similar to the findings of previous studies that have used different devices (e.g. foot-to-foot BIA), %FM equations (proprietary or adult), and sample age (e.g. adolescents) and do not consider obesity status, the large LoA between %FMADP and %FMBIA in the current study indicate that the devices cannot be used interchangeably in boys aged 6 to 12 years.
Acknowledgements
The authors thank the children who participated in the study and the technical teams for their support.
The research was funded by the Dr William M. Scholl Podiatric Research and Development Fund.
All authors contributed to conceptualisation, data curation, formal analysis, investigation, methodology, project administration, visualisation, and writing the original draft and manuscript review and editing.
The authors declare no conflict of interest in relation to this study.


