


Do election campaigns provide voters with the information they need to make choices that align with their interests and values? This question has long captured the attention of political scientists, who have reached mixed conclusions about the extent to which campaigns improve objective measures of political knowledge (Bartels Reference Bartels2000; Gilens, Vavreck and Cohen Reference Gilens, Vavreck and Cohen2007; Huber and Arceneaux Reference Huber and Arceneaux2007; Koch Reference Koch2008; Lau, Sigelman and Rovner Reference Lau, Sigelman and Rovner2007; Milazzo Reference Milazzo2015).
In a related vein, another group of scholars has examined how ever-evolving media technology – including newspapers, radio, television, cable and now the internet – has shaped and reshaped how voters are exposed to information about public affairs and are targeted by those seeking elected office (Gentzkow Reference Gentzkow2006; Gentzkow, Shapiro and Sinkinson Reference Gentzkow, Shapiro and Sinkinson2014; Iyengar and Hahn Reference Iyengar and Hahn2009; Prior Reference Prior2007).
Here we contribute to both of these literatures by documenting how an important recent development in media technology – the widespread use of social media – is affecting the public's level of objective political knowledge in election campaigns. Roughly half to three-quarters of all adult internet users across nations in the developed world now use these services (Smith and Anderson Reference Smith and Anderson2018). Social media has become an important source of information: a 2019 report by the UK Office of Communication shows that 49 per cent of adults get news from social media (CommOffice 2019). Reliance on social media is particularly pronounced among young people, suggesting that the aggregate importance of social media as a news source will rise over time (Smith and Anderson Reference Smith and Anderson2018).
Social media provides a new way for parties and candidates to sidestep the filter of traditional news media and communicate directly with voters. Much like advertisements, these partisan messages may then help voters learn parties' positions on issues but leave them vulnerable to parties' selective emphasis of objective facts about public affairs. At the same time, many traditional news media organizations have now established substantial social media presences themselves and have grown more adept at targeting their audiences on social media platforms. Thus social media may also help the news media play the same informative role that it did in previous eras when television and newspapers were dominant sources of political news.
In this article, we explore these hypotheses by examining the effect of social media on voter knowledge during the 2015 UK general election campaign. The UK's party system was in substantial flux at the time, making it an excellent case with which to study political learning (Denver, Carman and Johns Reference Denver, Carman and Johns2012). The Labour Party had recently shifted left on economic and social welfare policies, veering away from the market-based ‘New Labour’ approach championed by former Prime Minister Tony Blair (Whiteley et al. Reference Whiteley2013). The Liberal Democrats had also altered their stances, making substantial concessions as the junior member of their governing coalition with the Conservatives. Yet another change was the steep ascent of the nativist UK Independence Party (UKIP), riding a wave of disenchantment with establishment policies on immigration and the European Union (EU) (Evans and Mellon Reference Evans and Mellon2016). Following a six-month campaign, the Conservatives won an outright majority in Parliament. The Liberal Democrats suffered a stunning collapse in voter support and Labour lost all but one seat in its traditional stronghold, Scotland, to the Scottish National Party (SNP). Despite winning 13 per cent of the vote, UKIP captured just one seat, although its primary policy goal would be realized less than sixteen months later in the surprising passage of the Brexit referendum.
We assess changes in political knowledge during the campaign using a panel survey we conducted in conjunction with YouGov in four waves beginning nearly a year before the election and concluding shortly afterward. In a major innovation, for each panelist who was a Twitter user we also obtained access to the full text of every tweet that appeared on their Twitter ‘timeline’, and thus could have been seen by the panelist, during the campaign.Footnote 1
Our design has three powerful features that are not ordinarily present in studies of the effects of campaigns on political knowledge. First, we address potential threats to inference raised by users' selective consumption of political news by employing a panel design that permits identification of the causal effect of media exposure to specific topics on changes in respondents' knowledge of those topics over time. Secondly, we rely on objective measures of exposure to social media, allowing us to avoid biases associated with self-reported exposure. And thirdly, because these measures of media exposure are at the individual, rather than aggregate (such as media market) level, we can be much more precise than previous studies in demonstrating relationships between specific sources of messages and changes in knowledge about specific political phenomena.
Our findings provide some cause for optimism about the effect of social media on two kinds of political knowledge. The first type of measure, issue-relevant facts, includes survey items that assess knowledge of basic facts about timely and important political topics. The second type of measure, relative party placements, includes survey items assessing whether respondents are able to accurately place political parties in relation to one another on a scale regarding important political topics.
Generally, Twitter users became better informed over the course of the campaign compared to otherwise similar panelists who were not Twitter users. This is because exposure to tweets from news media sources about particular topics resulted in increased knowledge of issue-relevant facts regarding these topics, while exposure to tweets from political parties on particular topics yielded increased awareness of relative party placements on these topics. In the aggregate, however, there was little improvement in overall knowledge, as is explored in Appendix G. For example, an increase of one standard deviation in the number tweets about taxes and spending (aggregated across all of the sources in our study) caused the predicted probability that a respondent would correctly answer the associated factual knowledge question to increase from 55.9 per cent to 59.4 per cent. Respondents who saw the most relevant tweets were a full 11 percentage points more likely to answer the question correctly.
But our results also raise some important concerns, as exposure to partisan messages on specific topics increased the accuracy of voters' beliefs about some topics, but reduced the accuracy for others. Even more troubling was that these changes were in directions consistent with the parties' strategic interests. Tweets from the anti-immigration UKIP on the topic of immigration tended to increase voters' assessments of the rate of immigration. Tweets from the incumbent Conservatives about the economy led voters to think unemployment was low, while tweets from the opposition Labour Party about the economy led them to believe unemployment was high. For example, a one-standard-deviation increase in the number of tweets from the Labour Party about unemployment caused the predicted probability that a respondent would correctly answer the associated factual knowledge question to decrease from 60.9 per cent to 54.0 per cent. Thus the net positive effect of partisan messages on voter knowledge masked significant heterogeneity consistent with the incentives of political parties to distort voters' knowledge of political facts. This meant that a substantial share of voters became misinformed over the course of the campaign due to their use of social media, a worrisome finding in an era when global publics increasingly rely on this source for news about politics and public affairs.
Social Media and Political Knowledge
Political knowledge, defined by Michael Delli Carpini and Scott Keeter (Reference Delli Carpini and Keeter1997, 10) as ‘the range of factual information about politics that is stored in long-term memory’, is vital for the healthy functioning of democracy. People who are more informed about politics cast votes and engage in other forms of political behavior that are better aligned with their preferences and interests than those who are less informed. While political scientists have shown that knowledge deficits can in some circumstances be overcome using cognitive shortcuts, they nevertheless agree that increased political knowledge is desirable, and ignorance of basic facts about public affairs is problematic (Bartels Reference Bartels1996; Fowler and Margolis Reference Fowler and Margolis2014; Lau and Redlawsk Reference Lau and Redlawsk2001; Lupia Reference Lupia1994).
Exposure to news coverage can be associated with increases in what Barabas et al. (Reference Barabas2014) call ‘surveillance’ knowledge of recent developments in public affairs and policy. As a given topic attracts more media attention, people tend to become more knowledgeable about that topic (Barabas and Jerit Reference Barabas and Jerit2009). Political campaigns may play a similar role, raising knowledge of political topics and party platforms (Andersen, Tilley and Heath Reference Andersen, Tilley and Heath2005; Banducci, Giebler and Kritzinger Reference Banducci, Giebler and Kritzinger2017), although these effects can be weak (Bartels Reference Bartels2000).
Might social media represent a fundamental change from traditional ways in which voters obtain information about public affairs? Previous work suggests caution in assuming that these findings will hold in the era of social media. New developments in media technologies often upend the way people are exposed to political information, and thus change both aggregate levels of political knowledge and its variance across citizens (Prior Reference Prior2007). For example, Gentzkow (Reference Gentzkow2006) suggests that the introduction of broadcast television may have reduced voter turnout, likely due to viewers substituting out of older media such as newspapers and radio that provided more political coverage. More recently, internet access has been shown to have heterogeneous effects on aggregate political knowledge, as younger generations may use the internet as a substitute for long-term memory (Kleinberg and Lau Reference Kleinberg and Lau2019).
Another important shift is that social media technology gives politicians and political parties virtually unmediated access to those who choose to follow them on social media sites. These channels provide candidates with obvious advantages compared to communicating through the filter of the news media, which dilutes their messages with background information, fact checking and quotes from opposing sides, in addition to performing the gatekeeping role of determining a message's newsworthiness in the first place. Since none of these functions is present in social media communications, they resemble advertisements more than news stories. Like advertisements, these messages may inform voters about party positions on a variety of issues (Johnston, Hagen and Jamieson Reference Johnston, Hagen and Jamieson2004). But at the same time, they allow parties and candidates to strategically emphasize the facts that are in their favor. Parties out of power have incentives to talk about economic conditions when they are bad; incumbent parties discuss the economy when it ‘s good (Vavreck Reference Vavreck2009). Parties that ‘own’ issues have incentives to make them salient in campaigns (Egan Reference Egan2013; Petrocik Reference Petrocik1996), especially niche parties for which electoral success is built around a single issue such as the environment or immigration (Meguid Reference Meguid2008). For these reasons, we might expect social media messages from parties to selectively emphasize information that decreases people's factual knowledge of relevant objective conditions in ways that are advantageous to their electoral fortunes.
However, the degree to which social media represents a dramatic shift from previous eras may be tempered by the fact that traditional news outlets have themselves established strong social media presences. It is therefore possible that the net impact of social media use during political campaigns tends to be beneficial, as the salubrious effects of news media exposure outweigh whatever strategic messages (designed to confuse or obfuscate) are transmitted by politicians and parties.
Hypotheses
We hypothesize the conditions under which social media users' knowledge improved or diminished during the 2015 campaign as assessed by two types of survey questions: issue-relevant facts (for example, did unemployment go up or down?) and relative party placements on issues (for example, place the parties on a scale ranging from higher taxes and spending to lower taxes and spending). As described in detail below, our political knowledge questions covered the topics of unemployment, taxes vs. spending, immigration, the EU and the ISIS terrorist organization.
Hypothesis 1: In general, exposure to information on Twitter about a political topic will cause a net increase in knowledge about that topic.
As has been shown with traditional media, we expect that the net effect of social media messages about a particular topic will be to increase surveillance knowledge about that topic. We expect that any misinformation arising from partisan and candidate messages should, on balance, be outweighed by the now-substantial presence of news outlets on social media platforms.
Hypothesis 2: Exposure to information on Twitter sent by a news media organization about a political topic will increase knowledge of that topic.
This straightforward expectation follows directly from previous research by Barabas et al. (Reference Barabas2014) and others demonstrating that the public's knowledge about topics in public affairs rises with news media coverage of that topic.
Hypothesis 3: Exposure to information on Twitter sent by a political party about a political topic will increase accuracy of relative party placements on the topic.
As discussed above, on balance, previous work has suggested that voters become more informed about the relative placements of political parties on different issues over the course of election campaigns, including in UK elections (Andersen, Tilley and Heath Reference Andersen, Tilley and Heath2005; Banducci, Giebler and Kritzinger Reference Banducci, Giebler and Kritzinger2017). Here we propose that messages from the parties themselves play a role in improving this kind of knowledge. Misinformation is difficult to achieve, as any attempt by a political party to obfuscate its unpopular positions on issues will be met by clarifying messages from opponents that do just the opposite. Thus the net effect of exposure to the mix of partisan messages delivered on social media during a campaign should be that users better delineate where the parties stand relative to one another.
Hypothesis 4: Exposure to information on Twitter sent by a political party about a political topic will change beliefs about issue-relevant facts regarding that topic in the direction that is strategically advantageous to the party transmitting the message.
We divide this hypothesis into expectations regarding two prominent issues during the campaign: unemployment and immigration. Having reached a post-economic crisis high in 2011, the UK unemployment rate fell steadily in the years leading up to the 2015 general election. As has been shown in US elections (Vavreck Reference Vavreck2009), incumbent parties (here the Conservatives and the Liberal Democrats) had strong incentives to make this fact widely known, while opposition parties (here Labour and UKIP) had reasons to downplay it.
Hypothesis 4a: Exposure to tweets sent by incumbent political parties on the topic of the economy will lead Twitter users to hold the accurate belief that the unemployment rate was declining in 2015, while tweets sent by opposition parties on the economy will increase the probability of holding the inaccurate belief that unemployment was increasing.
Legal immigration from the EU to the United Kingdom was another highly salient issue during the 2015 campaign. Concerns about this issue were instrumental in the rise of UKIP, which crafted social media messages about immigration to draw as much attention to the issue as possible. We expect that tweets from UKIP on the topic of immigration led users to raise their estimates of the rate of immigration to the UK, with heterogeneous effects on political knowledge.
Hypothesis 4b: Exposure to tweets from UKIP on the topic of immigration will lead recipients to raise their estimates of the number of immigrants coming to the UK. This will lead some users to hold more accurate beliefs about the true rate of immigration to the UK but lead others to hold less accurate beliefs, resulting in no overall improvement in accuracy on this topic.
Data
Tweets
We merged the survey responses of Twitter users in our sample with the entire content of their Twitter timelines, which consist of every tweet sent from 1 January 2014 through 22 May 2015 by accounts followed by our respondents. This period includes the entire general election campaign, which formally commenced on 19 December 2014, intensified with the dissolution of Parliament on 30 March 2015, and concluded with the vote held on 7 May. These are the tweets to which our respondents were potentially exposed, based on the set of accounts that they had opted to follow.Footnote 2 To be clear, we cannot know for sure which tweets among those in their timelines users actually saw. But at the time our study was conducted, Twitter presented the stream of tweets in users' timelines in the chronological order of transmission by their senders, with the most recent tweets from the accounts the user opted to follow displayed first. Because the timeline was largely uncurated, it is reasonable to assume that users saw a nearly random sample of their timelines' tweets.Footnote 3
We selected four topics that we determined were likely to be highly salient in the election – the economy, the UK's ties to the EU, immigration and the fight against the ISIS terrorist organization – and identified tweets relevant to these topics. We identified all tweets on users' timelines related to these topics by first manually constructing short lists of terms related to each topic. We then identified which other terms most frequently co-occurred in tweets with the original anchor terms. We then used these expanded lists of terms to create our final lists of tweets related to each of the four topics. This approach allowed the data itself to inform us about the terms being used to discuss topics – a particularly valuable feature here, given how quickly language use on highly salient topics can evolve on social media.Footnote 4
For each of our four topics, we identified the words with the twenty-five highest scores. Any tweet including one of these words was then categorized as pertaining to the topic. Table 1 displays lists of these terms for each of our four topics. Examples of tweets from each of the relevant topics (along with additional details of the classification process) can be found in Appendix A (page 1). Screenshots of tweets that illustrate the findings of greatest interest are in Appendix A (page 3).
Table 1. Top terms pertaining to the topics under study

Note: examples of the terms we found to tend to co-occur with our anchor terms, allowing us to identify the terms that comprise the topics of interest. These are the top twenty-five terms per topic.
We performed an additional categorization of relevant tweets based on the type of account that created them: tweets from accounts associated with a politician or political party (462 accounts), and tweets from accounts associated with journalists or media outlets (987 accounts). We further split the political accounts into those associated with each of the four major political parties included in our study. For media accounts, a research assistant identified the UK media organizations with the greatest number of Twitter accounts – including the accounts of journalists employed by those organizations – and we then divided them according to their ideological leanings.
The number of political tweets sent by politicians and media sources appearing in our respondents’ timelines ranged from zero to just over 347,000. To be included in this count, a tweet needed to be (a) sent by one of the 462 political or 987 media accounts we identified and (b) mention one of the four topics or the four parties we study. Notably, many of our participants received little in the way of political messages sent by either politicians or media organizations. About a third (32 percent) of our respondents who were Twitter users received zero political tweets from either source. And nearly two-thirds (63 percent) received zero tweets from politicians’ accounts. The wide variation in this measure makes it useful as an explanatory variable.
There was significant variation in topics emphasized by political and media Twitter accounts, as shown in Table 2 where each row corresponds to a political party or media source. Generally, the distributions of tweets about topics by Labour, the Conservatives and the Liberal Democrats were quite similar. By contrast, the niche party UKIP followed a very different strategy: it heavily emphasized immigration and the EU, providing face validity to our coding strategy. There was less variation within the media accounts, although left-leaning media sources tended to avoid discussing immigration.
Table 2. Distribution of tweets on each topic by source type

Note: cell entries are the percentage of tweets devoted by each type of sender to each topic. Bold cells highlight the figures discussed in the text. The number of followers in the left column conveys the relative popularity of these different source types; panelists who followed more than one source type are counted multiple times.
Survey Data
We designed a four-wave panel survey that was administered by the polling firm YouGov to its nationally representative sample of UK adults via the internet. We timed the four waves to measure attitudes and knowledge before, during and after the campaign. The four waves concluded (respectively) on 31 July and 11 December 2014 and 30 March and 17 June 2015.
We focus on a subset of YouGov panelists who agreed to provide their Twitter account information to YouGov, which in turn shared the content of these respondents' Twitter timelines with us. (To preserve anonymity, YouGov did not share respondents' Twitter account names with us.) To assess the relationship between exposure to tweets and political learning, our analyses pool these Twitter users with a subset of panelists from YouGov's nationally representative sample who reported that they were not Twitter users and who we therefore assume were exposed to zero tweets during the campaign.Footnote 5
To assess the representativeness of our sample, Table 3 displays comparisons of the demographic characteristics of our sample with those of the 2015 British Election Study (BES), a nationally representative survey of UK adults conducted in the weeks following the election. Panel A shows that Twitter users in our sample were more likely to be male, better educated, have a higher income and be older than Twitter users in the BES. By contrast, those in our sample who said they were not users of Twitter were quite similar to those in the general population. Panel B shows that politically, our samples of Twitter users and non-users looked broadly similar to their counterparts in the electorate. As described below, all of our results hold when we apply post-stratification weights that make our sample demographics match those of Twitter users in the BES survey.Footnote 6
Table 3. Descriptive statistics of relevant populations

Note: the demographic, vote choice and ideology breakdowns of the relevant populations: our sample of Twitter users, the BES sample of Twitter users, our sample of non-Twitter users, the BES sample of non-Twitter users, and the results of the popular vote in the 2015 election. BES: Post-Election Wave 6 of the 2014–2018 British Election Study internet Panel Core Sample (n = 20,023). Data are weighted.
a Vote: cell entries give the proportion of respondents from the column-sample reporting voting for the row party.
b Median Ideology: self-reported ideology, left to right; asked on a 0–100 scale in our survey and on a 0–10 scale in the BES.
c Party ID: Cell entries give the proportion of respondents from the column-sample reporting the row party identification. Party ID question asked in Wave 2 of our survey, well in advance of the election, while the BES asked just after the election.
As noted above, our surveys included repeated measures of two types of items designed to assess panelists' political knowledge throughout the campaign: relative party placements and issue-relevant facts.
Relative Party Placements
These measures allowed us to assess our respondents’ ability to correctly place the four major parties on a left–right scale regarding their positions on three issues: taxes vs. spending, the UK's ties to the EU and the level of legal immigration to the UK.Footnote 7 In each wave for each topic, we asked respondents to place themselves and all four parties on scales ranging from 0 (left) to 100 (right). Scales were anchored as follows:
• Taxes vs. spending: (left) Social spending should be increased even if that means higher taxes; (right) Taxes should be cut even if that means lower social spending.
• The EU: (left) Britain should develop stronger ties with the European Union; (right) Britain should leave the European Union.
• Immigration: (left) Legal immigration to Britain should increase a lot; (right) Legal immigration to Britain should decrease a lot.
One of the challenges associated with such an analysis is establishing a ‘ground truth’ of where parties actually stand (Markowski and Tucker Reference Markowski and Tucker2017). There are a wide variety of potential measures of this ground truth, and we tested many of them, including the mean of all the respondents' placements of the parties; the mean of the placements by respondents with a college degree; the mean of the party placements made by self-identified supporters of each party; the mean of the self-placements of self-identified supporters of each party; and the parties' placements in the 2014 edition of the Chapel Hill Expert Survey (Bakker et al. Reference Bakker2015). All of these placement estimates were highly correlated with each other at 0.93 or higher, and we use the simplest measure – the mean of the placement by all respondents in each wave – as our ‘ground truth’. Among other advantages, this wave-by-wave approach allows us to track any movement of the parties during the campaign.
Our analysis focuses on change in panelists' responses between Waves 1 and 4 of the survey, conducted nearly one year apart (in July 2014 and June 2015). Figure 1 displays the mean scores of where respondents placed themselves and each of the parties on the three topics in the two waves. The party placements form our ‘ground truth’, and they were generally stable.

Figure 1. Respondent and party placement on issues: means and standard deviations, Waves 1 and 4
Note: means and standard deviations of respondents' placements of parties and themselves on the three issues under study, at Wave 1 (top lines, with squares) and Wave 4 (bottom dotted lines, with circles) of the survey. The sum of the mean and standard deviation of UKIP's placements on immigration and the EU exceeded the maximum value of 100, so we truncate them.
On each topic in each wave, respondents were scored as correctly placing the parties' positions if they accurately ordered the four parties on that topic's left–right scale – that is, if their ordering matched the ordering of the parties' mean scores on the topic assigned by all respondents as shown in Figure 1. However, for the instances in which two parties were particularly close together (within ten points on the 100–point scale), we allowed some leeway: in such instances we accepted either ordering of the two parties as correct.
Issue-Relevant Facts
We measured respondents' knowledge of issue-relevant facts on three topics in Waves 2 and 3 of the survey with the following multiple choice questions about three topics we tracked in panelists' Twitter feeds: ISIS, unemployment and immigration.Footnote 8 (Correct answers are in bold.)
• The Islamic militant group known as ISIS currently controls territory in which of these countries: Syria, Kuwait, Morocco or Pakistan?Footnote 9
• Compared to a year ago, has unemployment in Great Britain increased, decreased or stayed the same?
• Over the past five years, has the number of immigrants to the United Kingdom from other EU countries been: Less than 100,000 per year, Between 100,000 and 300,000 per year, Between 300,000 and 500,000 per year, More than 500,000 per year?
Results
Our analyses heavily leverage our panel design to draw causal inferences. This of course falls short of an ideal design in which our participants were randomly exposed to tweets by either an experimenter or natural exogenous variation. Thus strictly speaking, our treatment does not necessarily meet the condition of ignorability required for causal identification. However, our panel design sharply narrows the mechanisms by which ignorability might be violated. Since our dependent variable is the change in various kinds of political knowledge across waves, we have already thoroughly conditioned on individual-specific observables. The only challenge to ignorability is a backdoor path affecting knowledge. This could happen through selection bias: unobservable characteristics of our respondents could cause them to both select the treatment (in this case, following certain Twitter accounts) and to acquire additional knowledge (regardless of what they see on Twitter) during the campaign. Although panel data permits us to condition on what our respondents knew at Wave 1, we cannot condition on this inherently unobservable confounder: their desire for additional knowledge about politics.Footnote 10
For example, it may be the case that people who choose to follow UKIP on Twitter also choose to actively seek out information about immigration by reading newspapers, watching TV and consuming other sources of information on the topic. If this is the case, our causal attribution is misplaced unless we can condition on all of those behaviors. Fortunately, we are able to take a number of steps in this direction by conditioning on self-reported media consumption (both choice and frequency) as well as observable characteristics (such as educational attainment) that are known to be related to information acquisition and interest in public affairs. We therefore condition on the choice of media that respondents consume offline and on how often they report watching the BBC's news and public affairs program Newsnight. In sum, our causal inference is valid if no differences remain in our participants' learning behavior that covary with the appearance of tweets on their timelines after we condition on observable characteristics, which include a robust set of demographic controls, self-reported sources of news consumed off Twitter and frequency of news consumption, and the level of information measured in Wave 1. As with any observational study, we cannot prove our assumptions are correct. We can only be precise about them and state that causal inferences are conditional on these assumptions.
Furthermore, we argue that the quantity of interest could not in fact be estimated through random assignment. It is important to consider the quantity that randomized exposure to tweets would actually estimate. In the world of social media we are, after all, interested in learning how people update beliefs precisely based on what they have chosen to expose themselves to. The impact of the source of the information is an open research question. Thus to randomly assign information to the respondent's Twitter feed would not be mimicking any real-world condition. The randomized experiment of assigning accounts to follow – or tweets to see – is not ‘Twitter use’ per se, but something else, something artificial that does not happen in the real world.Footnote 11 Experimental studies that estimate this counterfactual quantity can be richly informative – see Bail et al. (Reference Bail2018) – but they cannot estimate the effect of endogenous media selection.
Social Media Use and Political Knowledge
We first test Hypothesis 1 – our expectation that general exposure to information about a political topic on Twitter will increase knowledge about that topic – with regard to the relative party placements items. We estimate three separate logit models of respondents' ability to correctly place the parties in Wave 4 (scored 0 or 1), conditioning on their placement accuracy in Wave 1, as predicted by the log of the number of tweets on the topic appearing on their timelines transmitted by parties and news sources.Footnote 12 As discussed above, we control for a set of respondent characteristics that could potentially confound the relationship between tweets received and improved knowledge about relative party placements, including standard demographic variables (gender, age, class, education, race, marital status and religiosity), measures of self-reported exposure to news and internet use, and the kinds of newspapers that respondents reported reading on a regular basis.Footnote 13
We report the logistic regression coefficients on our key independent variable (the logged number of tweets about the topic appearing in the user's timeline between Waves 1 and 4) from these three models in Figure 2.Footnote 14 Tweets had positive effects on knowledge of all three topics. Effects were statistically significant at p < 0.05 on the topics of taxes vs. spending and the EU, while the effect on immigration fell slightly below the 0.10 significance threshold.

Figure 2. Effect of topical tweets on correctly identifying relative party placement by issue
Note: logistic regression coefficients estimating the effect of topical tweets received on the probability of correctly identifying relative party placement in Wave 4, by topic.
Source: Table 8 in Appendix C (page 6).
To illustrate the magnitude of these effects and the distribution of the key independent variable in each of our three models, Figure 3 plots the predicted probabilities that the respondent correctly ranked the parties on that topic in Wave 4 against the log of the number of relevant tweets on the x-axis. We set all other independent variables to their mean values. The figure reveals that the sizes of these effects are meaningful. For example, for the typical respondent, a shift of one standard deviation from the median in the number of tweets received on the topic of the economy (an increase of approximately 343 tweets) is estimated to be associated with an improvement in the predicted probability of correctly answering the associated factual knowledge question from 55.9 per cent to 59.4 per cent. The fact that we find an effect of this size is notable given that (as shown below) the impact of tweets on knowledge varies according to the source of the tweets, thus making this a conservative estimate of the potential effect of exposure to topic-specific information on Twitter to improve knowledge.

Figure 3. Effect of topical tweets on probability of correctly identifying relative party placement by issue in Wave 4
Note: plots of the estimated effects of topical tweets received on the probability that the subject correctly ranked the four parties on that topic in Wave 4 of the survey.
Source: Table 8 in Appendix C (page 6).
We now turn to tests of Hypothesis 1 with regard to issue-relevant facts. Our analysis here relies on the same specification as the one used for the correct placement of the parties, with logistic regressions for each of the three issue-relevant fact questions. The dependent variable in each estimated equation is whether the respondent correctly answered that question in Wave 3, while the key explanatory variable is the logged total number of tweets related to that topic that appeared in the respondent's Twitter feed between Waves 2 and 3.
Figure 4 plots the logit coefficients from these models on the topic-related tweets appearing in users' feeds.Footnote 15 We find a positive and statistically significant relationship between the number of tweets and respondents' knowledge of immigration, a positive but not statistically significant effect for ISIS and an estimate of approximately zero for unemployment.Footnote 16 The pattern of these effects is slightly less pronounced compared to that found in our previous test of Hypothesis 1 (the effects of tweets on relative party placements shown in Figure 2). As will be shown, this is in part because some tweets from parties led to a deterioration in knowledge of issue-relevant facts.

Figure 4. Effect of topical tweets on knowledge of issue-relevant facts
Note: logistic regression coefficients estimating the effect of topical tweets received on the probability of correctly answering an issue-relevant fact question in Wave 3, by topic.
Source: Table 9 in Appendix C (page 6).
Effects of Social media Messages from News Organizations
We next examine evidence for Hypothesis 2 – that tweets on particular topics from news organizations should improve social media users' knowledge of these topics. Unlike our tests of Hypothesis 1, here we separated tweets on these topics into those sent by news organizations (including their affiliated journalists) and those sent by political parties (including their affiliated politicians). The logged numbers of tweets from these two sources were then entered as separate predictors into each model.
Figure 5 plots the relevant coefficients on tweets from news media from the six models. The top of the figure plots coefficients from the three models predicting knowledge of relative party placements; these indicate that tweets from news media did not improve knowledge in these domains, with coefficients consistently near zero. (As will be shown below, tweets from parties have a positive effect on knowledge of party placements, yielding substantial empirical support for Hypothesis 3.) The bottom of the figure plots coefficients from the three models predicting knowledge of issue-relevant facts. For all three topics, the effect of media tweets on the accuracy of beliefs of issue-relevant facts was positive and significant at the 0.05 level (for immigration and unemployment) or the 0.10 level (for ISIS).
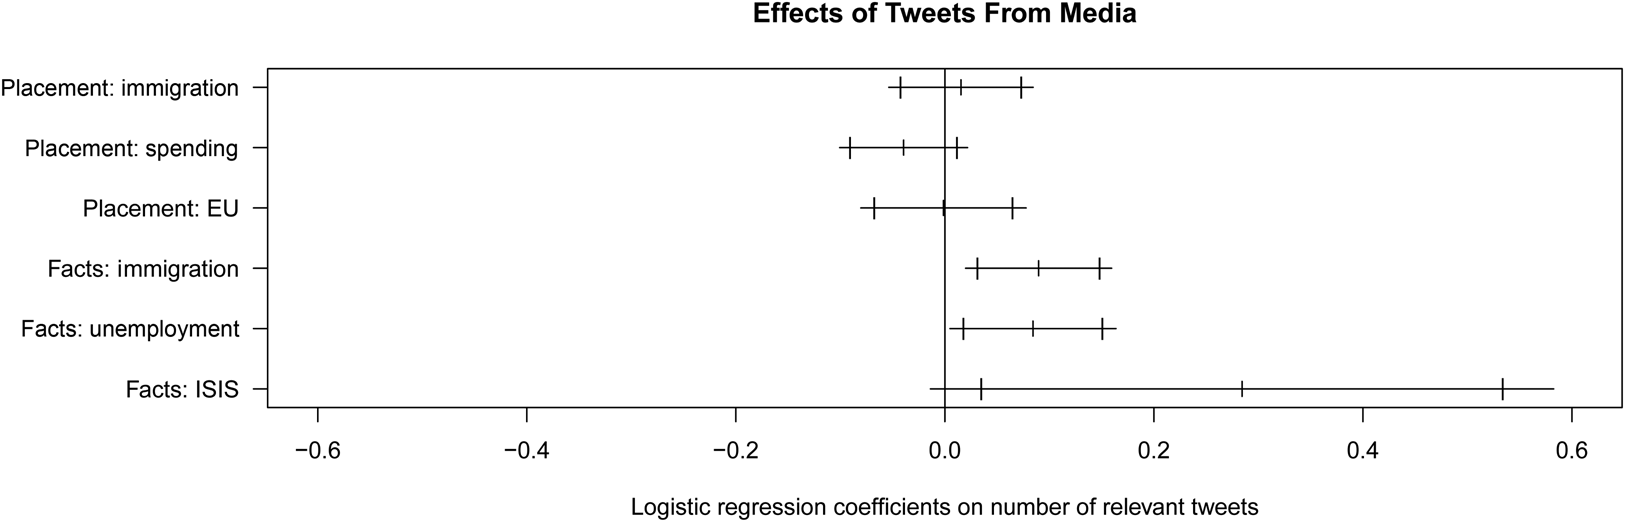
Figure 5. Effect of tweets sent by news media on political knowledge, by topic
Note: (top) estimates of the effect of topical tweets received from news media on the probability of correctly identifying the relative party placement in Wave 4, by topic. (Bottom) estimates of the effect of topical tweets received from news media on the probability of correct knowledge of issue-relevant facts in Wave 3, by topic.
Source: Table 10 in Appendix C (page 6).
Taken together, these analyses provide some, albeit inconsistent, empirical support for Hypothesis 2. Social media messages from news media organizations improved knowledge of facts regarding topics central to the campaign, but had neutral effects on knowledge of the stances of the parties on these topics. All told, these results indicate that news organizations' aggregate contributions were positive: voters who received tweets from news media regarding particular issues were better informed about those issues at the end of the campaign than at its start.
Effects of Social Media Messages from Political Parties
The first tests of Hypotheses 3 and 4, our theoretical expectations about the effects of tweets from political parties on knowledge, come from the same models estimated to test Hypothesis 2 above. Recall that these six models predict the accuracy of responses on each of the party placements and issue-relevant facts items; tweets from media and parties are entered as separate predictors as well as controls for lagged responses and covariates. In Figure 6, we plot coefficients from these models on tweets sent by political parties. The top of the figure displays coefficients from the three models predicting knowledge of relevant party placements. In support of Hypothesis 3, the estimated effects of parties' tweets on knowledge were consistently positive. The effects of tweets from the parties on party placements were statistically significant regarding taxes and spending (at p < 0.05) and marginally significant regarding the EU (p < 0.10). The bottom of the figure displays coefficients from the three models predicting knowledge of issue-relevant facts. Here the results are troubling: tweets from the parties significantly reduced Twitter users' knowledge of the unemployment rate and did nothing to improve their knowledge about immigration rates or ISIS's activity. As we show next in our discussion of Hypothesis 4, these aggregate results mask substantial heterogeneous effects of tweets sent by different political parties.

Figure 6. Effect of tweets sent by parties on political knowledge, by topic
Note: (top) estimates of the effect of topical tweets received from political parties on the probability of correctly identifying the relative party placement in Wave 4, by topic. (Bottom) estimates of the effect of topical tweets received from political parties on the probability of correct knowledge of issue-relevant facts in Wave 3, by topic.
Source: Table 10 in Appendix C (page 6).
Effects of Partisan Tweets on Knowledge of Issue-Relevant Facts
Hypothesis 4 reflects our expectation that some political parties have strategic incentives to emphasize different aspects of the same topic, or even to mislead voters on certain topics, and that these divergent emphases might have contrasting effects on knowledge of issue-relevant facts. To test these expectations, we further disaggregated the political party tweets by the four parties (Conservatives, Labour, Liberal Democrats and UKIP). We also separated the media tweets into three categories of the media sources' ideological slants (left, center and right). We then estimated ordered-probit models predicting respondents' change in beliefs about unemployment and immigration rates between Waves 2 and 3 as a function of the number of tweets seen about each topic from each source.Footnote 17
Table 4 displays the results of these ordered-probit estimates. The results in the table's first column confirm our expectation in Hypothesis 4a that tweets from Labour about the economy led followers to significantly increase their assessments of the unemployment rate. Confirming Hypothesis 4b, the table's second column shows that tweets from UKIP led followers to significantly increase their assessments of the nation's immigration rate. In both cases, these changes in beliefs were aligned with the parties' strategic interests. As a challenger party, Labour stood to benefit from an electorate less convinced that unemployment had declined in the previous year. As a niche party that had staked its reputation on reducing immigration, UKIP had a strategic interest in raising voters' assessments of the level of immigration to the UK.
Table 4. Effect of tweets on recipients' perceptions of unemployment and immigration rates

Note: estimates of the impact of the number of tweets in the respondent's timeline sent by an account affiliated with that party or group of media outlets and related to the that topic, calculated from two separate regressions. The dependent variable in each case is an ordinal variable that corresponds to the answer the respondent gave to that issue-relevant factual question in Wave 3, estimated with an ordered probit model. Each regression includes demographic and media consumption control variables, as well as a control for the response of the respondent in Wave 2.† p < 0.10; ∗p < 0.05; ∗∗p < 0.01
In the cases of both unemployment and immigration, tweets from political parties moved beliefs in directions that were advantageous to their interests. To assess the impact of these changes in beliefs on political knowledge, we estimated two logit models similar to those used to test Hypotheses 1–3, with panelists' accuracy on issue-specific fact questions regarding unemployment and immigration in Wave 3 predicted by tweets received on these topics from the parties and media, controlling for accuracy in Wave 2 and our extensive set of covariates.
Figure 7 displays logit coefficients on media and party tweets from the model predicting panelists' accuracy with regard to unemployment. It shows that tweets from Labour – which, as shown in Table 7, led recipients to doubt unemployment had declined in the previous year – resulted in a corresponding negative, significant decline in recipients' accuracy about the unemployment rate. By contrast, tweets from the incumbent Conservative Party increased the probability that respondents would hold the accurate belief that unemployment declined in the year prior to the election (an effect just shy of the 0.05 significance level). These results are largely in accord with our expectations. UKIP was technically an opposition party and the Liberal Democrats technically an incumbent party; however, UKIP was a niche party focused on immigration and EU politics, and it is unsurprising that they did not cause a significant change in knowledge of this issue. It was, though, somewhat surprising that tweets from the Liberal Democrats – who were also in government, as a coalition partner with the Conservatives – did not have the predicted positive effect.

Figure 7. Effect of topical tweets by source on knowledge of issue-relevant facts: unemployment
Note: logistic regression coefficients estimating the effect of topical tweets received on the probability of correctly answering the issue-specific unemployment factual question in Wave 3, by topic.
Source: Table 12 in Appendix C (page 6).
Turning to immigration, Figure 8 displays logit coefficients on media and party tweets from the model predicting panelists' accuracy with regard to immigration.Footnote 18 The figure shows that no party transmitted messages that improved recipients' knowledge of the true rate of immigration to the UK. Thus while Table 7 found that tweets from UKIP on the topic of immigration led recipients to raise their estimates of the number of immigrants coming to the UK, as we hypothesized in Hypothesis 4b, these tweets had no aggregate impact on accuracy. The reason that these changes did not necessarily reflect an increased chance of correctly answering the question is that the correct answer (‘Between 100,000 and 300,000 [immigrants] per year’) was the second-lowest choice in the response set. UKIP's tweets likely caused some respondents to correctly raise their estimates from the lowest to the second-lowest choice, but caused others to overshoot the correct answer when they incorrectly raised their estimates beyond the second-lowest choice.

Figure 8. Effect of topical tweets by source on knowledge of issue-relevant facts: immigration
Note: logistic regression coefficients estimating the effect of topical tweets received on the probability of correctly answering the issue-specific immigration factual question in Wave 3, by topic.
Source: Table 12 in Appendix C (page 6).
All told, our analyses of Hypothesis 4 provide reason for concern about the effects of partisan messages transmitted via social media. Unfiltered by the constraints of traditional news media, tweets from the parties during the 2015 campaign changed beliefs about facts in directions that were strategically advantageous to the party transmitting the message. Sometimes this incidentally led users to more accurate beliefs of issue-relevant facts, but just as often partisan messages caused followers to change their beliefs about these facts in the inaccurate direction.
Conclusion
In this first-ever analysis combining the content of individuals' social media feeds and panel survey data over the course of an election campaign, we find evidence consistent with the claim that exposure to politics on social media may lead to a more politically informed mass public. These findings contribute to our cumulative understanding of the extent to which election campaigns inform voters. They also yield specific insights into how political knowledge is affected by social media, which is one of the most important developments in political communication in our times.
Our findings about the types of knowledge that are subject to social media effects largely concord with previous findings regarding traditional media (Barabas et al. Reference Barabas2014). Contrary to the worst fears of some, on balance, social media users became more informed about politics during the 2015 UK general election campaign. Messages from news media improved recipients' knowledge of issue-relevant facts; messages from the parties improved knowledge of relative party placements on the campaign's most important issues.
But we also uncover some troubling results. Exposure to partisan messages about highly salient issues over the course of a campaign can cause knowledge polarization on those issues. As electorates in Western democracies become increasingly divided on the issues of globalization and migration, the dual effects of exposure to UKIP's tweets on immigration that we discover are worth particular mention. On the one hand, these messages did not harm aggregate levels of knowledge regarding the number of immigrants to the United Kingdom. But on the other hand, they led UKIP followers to revise their estimates upward (approximately 0.25 points upwards on our four-point scale, for the median UKIP follower compared to someone who saw no UKIP tweets about immigration), which in turn may have aggravated disagreement in the overall electorate about a highly salient, objective political fact. The evidence of a connection between overestimates of immigrant populations and anti-immigrant attitudes suggests that this strategy likely helped further UKIP's agenda.
We note that this phenomenon of knowledge polarization could only be discovered using a research design like ours that measures the source, content and recipient of individual political messages. Knowledge polarization thus may possibly be a (yet-to-be discovered) effect of political messages transmitted via traditional media as well; we expect this type of knowledge polarization to be a more serious problem in areas such as the rate of immigration, which people have difficulty estimating correctly (Herda Reference Herda2010). Just as parties were able to convince some of their followers of things that were not true, media outlets could be capable of the same misinformation effects if they choose to direct biased or inaccurate content towards their followers.
Ever-growing numbers of people around the world are turning to social media to get information about politics and public affairs. Our research indicates that new insights about classic questions in political communication research await discovery by those who take advantage of the unparalleled opportunities provided by social media to precisely measure and assess the effects of political messages on political knowledge. Our findings suggest that as social media plays an ever more prominent role in political life, its effects on political knowledge will in many ways reinforce those of traditional media. This is particularly the case with exposure to non-partisan news, which appears to perform the same function of raising information levels via social media as it does through other channels. But social media presents myriad opportunities for parties and politicians – to say nothing of foreign actors – to transmit information that is unmoored from the gatekeeping and context provided by traditional news media. In an era of widespread media disruption and the concurrent decline of traditional news media, these developments may be troubling for those who see an informed electorate as critical to the functioning of mass democracy.
Supplementary material
The data, replication instructions, and the data's codebook can be found in Harvard Dataverse at: https://doi.org/10.7910/DVN/8PMMVT, and online appendix at: https://doi.org/10.1017/S0007123420000198.
Acknowledgements
The writing of this article was supported by the Social Media and Political Participation Lab at NYU, which is funded in part by the INSPIRE program of the National Science Foundation (Award SES-1248077), and New York University's Dean Thomas Carew's Research Investment Fund. We would like to thank participants at the 2016 Society for Institutional & Organizational Economics Conference, the NYU Graduate Political Economy Seminar, the 2016 SMaPP Global meeting at NYU Shanghai, and the 2016 American Political Science Association meeting, along with three anonymous reviewers. Ronen conducted the data collection and management, Munger conducted the statistical analyses and wrote the first draft of the manuscript. All of the authors contributed to the research design, data collection, and revisions of the manuscript.


