


Most western nations, including Australia, have created environments predisposing to obesity(1). In addition to the ever-increasing ready availability of energy-laden foods, the decrease in daily energy expenditure precipitated by technological advances is a likely aetiological factor(Reference Prentice and Jebb2). Recognising this, concerted efforts are being made to increase participation in leisure-time physical activity (LTPA)(Reference Pate, Pratt and Blair3). In Australia, as in other countries, a number of public health approaches have been used to increase participation in regular physical activity(Reference Bauman, Bellew, Vita, Brown and Owen4).
It is unclear which component or combination of components (increasing energy intake or decreasing expenditure) is responsible for the present positive energy balance and weight gain of the population(Reference Blair and Nichaman5). Many population-based surveys have examined the trends in physical activity participation by determining the proportion meeting recommendations for health, i.e. at least five 30 min sessions of moderate-intensity activity at 3·0 MET or more(Reference Merom, Phongsavan, Chey and Bauman6–Reference Craig, Russell, Cameron and Bauman8). Examining the change in physical activity-related energy expenditure over time may prove useful in developing the physical activity component of overweight and obesity prevention programmes.
Using the data from the three recent Australian National Health Surveys (NHS)(9–11), we demonstrated that during the decade 1990–2000, the prevalence of overweight and obesity increased with age and at each 5-year period. The year of an individual's birth was also shown to influence the proportion of overweight such that the more recently born cohorts demonstrated higher proportions of overweight and obesity(Reference Allman-Farinelli, Chey, Bauman, Gill and James12).
The NHS also collected data on LTPA including time spent in walking, moderate and vigorous activities. A recent trend analysis based on these surveys has examined changes in the prevalence of each type and amount of physical activity of different age groups over the decade (1990–2000) but not the year of individual's birth(Reference Merom, Phongsavan, Chey and Bauman6). Birth cohort analysis summarises a unique set of experiences of people born at a specific time which are different from the experiences of people born at other times. People born in the first decades of the twentieth century were born before the television, computer and widespread motor vehicle usage, so during their childhood and early adult life their everyday physical activity energy expenditure was probably greater than more recently born cohorts. Individuals born after 1970 entered a high-tech society with fewer demands on physical activity(Reference Ravussin13). We do not know whether the differing secular influences of childhood and early adult life of different birth cohorts may translate to differences in physical activity habits and sedentary behaviours throughout life. As we have identified independent effects of birth cohort on the prevalence of overweight(Reference Allman-Farinelli, Chey, Bauman, Gill and James12), we considered it useful to determine whether differences in energy expenditure from LTPA occur with birth cohort, and thus it might explain some of the phenomenon of overweight.
The aim of the present study was to determine the independent effects of age, birth cohort and survey period on LTPA using self-reported data from the NHS conducted in 1990, 1995, 2000 and 2005.
Methods
Data source
The NHS were a series of cross-sectional surveys designed to obtain representative and national benchmark information on a range of health-related issues and to enable the monitoring of trends over time(9–11, 14). Each survey used a stratified multistage area sample design from which a sample of private dwellings in urban and rural areas was randomly selected. Information was collected through face-to-face interview with all members of the selected households (1990 and 1995) or one selected adult (2000 and 2005). To account for possible seasonal effects on health characteristics, the sample in all surveys was allocated equally to each quarter of the calendar year. All surveys achieved good response rates ranging from 89 to 96 %. Access to the NHS data was obtained through the Australian Bureau of Statistics Confidential Unit Record Files provided on compact disks.
Data handling and analysis
The weighting factors for each record were computed by the Australian Bureau of Statistics to reflect the population demographic at the time of the survey, taking into account the probability of being sampled and the differential response across the population. The analysis was restricted to subjects aged 20 years or over and those weighing above 129 kg could not be included because exact weights were not provided in the NHS dataset. In 1990, 0·16 % of adults surveyed had a weight above 129 kg and in 2005, 0·55 % were above this weight. The data from the four NHS were combined. Variables were created for age, period and cohort. Age was grouped in 5-year intervals from 20 to 74 and those aged 75 and over were entered into one group, thereby giving a total of twelve age groups. The four periods were years of surveys (1990, 1995, 2000 and 2005). Birth cohort was calculated by subtracting age at the time of survey from the survey year. Cohort years range from those born in or before 1915 to those born in 1981–5. These were grouped in 5-year intervals giving fifteen cohorts (twelve age groups+four survey periods − 1). To ensure comparability over time, the data were age standardised to the overall population distribution of the 2000 NHS.
Self-reported weight in kilograms and data on LTPA were collected. The same physical activity questions were used in all four surveys. The subjects reported how many minutes they had spent in the past 2 weeks in walking, moderate and vigorous activities. The 2-week recall method has been demonstrated to have good repeatability and acceptable validity(Reference Booth, Owen, Bauman and Gore15–Reference Brown, Bauman, Chey, Trost and Mummery17). BMR was determined for each subject using age- and sex-specific formulae of Schofield et al. (Reference Schofield18) and the self-reported weight. LTPA in each of the three categories (walking, moderate and vigorous) was expressed as daily average in minutes, and then multiplied by the appropriate standard metabolic equivalents (MET), i.e. 3·3, 4·0 and 8·0 for walking, moderate and vigorous activities, respectively(Reference Ainsworth, Haskell, Leon, Jacobs, Montoye, Sallis and Paffenbarger19), to give MET minutes, and then totalled for all three intensities. Average minutes in each category of physical activity were multiplied by the BMR (per minute) and MET factor to yield energy expenditure. These values were then summed to give total energy expenditure attributable to LTPA in units of kJ/d. Median and quartile values were calculated.
We used the age–period–cohort models to investigate
(1) age, period and cohort effects on the likelihood of undertaking LTPA using logistic regression with a binary outcome variable: any LTPA or none for the full sample and
(2) the effects of age, period and cohort on the LTPA energy expenditure and amount of time spent in LTPA and intensity of LTPA using linear regression models with a log-transformed continuous outcome variable: log energy (log MJ); log time (minutes); log volume (MET minutes).
While a traditional cohort study follows the same people at each period, the age–period–cohort model derives the birth cohort by the subtraction of age from period (year of survey) when representative study populations are used. This is well described in epidemiological methods to assess the effects of cohort independent of ageing and period(Reference Taylor, Comino and Bauman20). Holford(Reference Holford21) proposed regression models with constraints to allow all three parameters to be included and overcome the problem of non-identification of related variables. The age–period–cohort models were fitted with no intercept (without age constraint), survey period 1 (1990) and two cohorts as the constraints. The birth cohorts selected as constraints were determined after the cohort models were calculated to locate those close in estimate. For the logistic models for participation in LTPA, cohorts 8 and 9 were constraints. In all energy expenditure and time spent in physical activity analyses, cohorts 7 (1941–5) and 8 (1946–50) were constraints. The contribution of each individual variable to the model was assessed by backward deletion from the full model. The resulting change in − 2 log L was assessed as an approximate χ2-distribution for logistic regression, and for linear regression the ratio of mean squares was calculated to give the test statistics with F-distribution. The results for the full age–period–cohort models were presented as kJ/24 h (energy expenditure), min/24 h (time spent) or MET min/24 h for age effects and ratios for cohort and period effects in graphical form.
All analyses were carried out using SAS (version 9.1, 2002–3; SAS Institute Inc., Cary, NC, USA), PROC SURVEYREG or PROC SURVEYLOGISTIC procedure that adjust for household clustering effects.
Results
Table 1 shows the number of subjects by sex and survey period and the percentages not participating in LTPA. The numbers of subjects in 1990 and 1995 are double those in 2000 and 2005 because usually only one adult per household was surveyed in the latter two periods. About 30 % or more of males and females undertook no LTPA at each period surveyed.
Table 1 Subjects included in the analysis and the percentages who undertook no leisure-time physical activity
Age was an independent predictor of participation in LTPA (P < 0·001) but cohort and period were not. Table 2 shows OR for the likelihood of participation in LTPA for individual age groups, birth cohorts and periods. The OR for taking part in LTPA was greatest for the youngest age group and declined with middle age with some increase at the retirement age (60–69 years) before declining. LTPA participation did not alter with birth cohort. The likelihood of exercising increased from 1990 to 2000 but was not different from baseline (1990) in 2005.
Table 2 OR for participating in leisure-time physical activity*

* The model is fitted without an intercept, therefore there is no reference for age, but 1946–55 is the reference for birth cohort and 1990 is the reference for survey period.
Table 3 shows the median (25th and 75th percentiles) energy expenditure from LTPA by age (horizontal) and cohort (vertical) for males. It can be seen that for almost all cohorts, there is a decline in energy expended as they age. LTPA energy expenditure at age 22 shows a decline with recency of birth cohort, but the pattern is indistinct at other ages.
Table 3 Median (25th and 75th percentiles) daily energy expenditure (kJ) from participation in leisure-time physical activity through the life course by birth cohort for males (n 50 009)
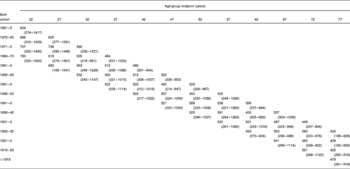
Table 4 shows the median (25th and 75th percentiles) LTPA energy expenditure by age (horizontal) and birth cohort (vertical) for females. There appears to be an increase in energy expenditure about 52 years of age (midpoint of 50–54) with a decline at 72 years (midpoint of 70–74), but the pattern with birth cohort is inconsistent.
Table 4 Median (25th and 75th percentiles) daily energy expenditure (kJ) from participation in leisure-time physical activity through the life course by birth cohort for females (n 52 770)

Figs. 1–3 show the fitted models for daily LTPA energy expenditure, time spent in LTPA and MET minutes for males and Figs. 4–6 the models for females. For males, age, cohort and period demonstrated independent effects on energy expenditure, time spent and volume of LTPA. Energy expenditure declined with age. Time spent and volume of LTPA declined with age until the 40s and then increased between 60 and 70 before declining again. Energy expended, time spent and volume declined with recency of cohort and period for males. For females, age was an independent predictor for energy expended, time spent and volume of LTPA and increases occurred after 50 years until the 70s when it declined but still remained above levels during the 20s–40s. All three measures of LTPA appeared to increase with recency of birth cohort, but no statistically significant effects were found. Energy expended, time spent and volume decreased with period.

Fig. 1 Males–leisure physical activity energy expenditure. Estimates and 95 % CI from the age–period–cohort model for daily energy expenditure fitted to the Australian National Health Survey data for males. Age effects are the MJ/24 h and birth cohort and period effects are the ratios with 1940–50 as the reference for cohort and 1990 the reference for period.

Fig. 2 Males–leisure physical activity minutes. Estimates and 95 % CI from the age–period–cohort model for time spent in leisure physical activity per day fitted to the Australian National Health Survey data for males. Age effects are the min/24 h and birth cohort and period effects are the ratios with 1940–50 as the reference for cohort and 1990 the reference for period.

Fig. 3 Males–leisure physical activity MET min. Estimates and 95 % CI from the age–period–cohort model for volume of leisure physical activity per day fitted to the Australian National Health Survey data for males. Age effects are the MET min/24 h and birth cohort and period effects are the ratios with 1940–50 as the reference for cohort and 1990 the reference for period.

Fig. 4 Females–leisure physical activity energy expenditure. Estimates and 95 % CI from the age–period–cohort model for daily energy expenditure fitted to the Australian National Health Survey data for females. Age effects are the MJ/24 h and birth cohort and period effects are the ratios with 1940–50 as the reference for cohort and 1990 the reference for period.

Fig. 5 Females–leisure physical activity minutes. Estimates and 95 % CI from the age–period–cohort model for time spent in leisure physical activity per day fitted to the Australian National Health Survey data for females. Age effects are the min/24 h and birth cohort and period effects are the ratios with 1940–50 as the reference for cohort and 1990 the reference for period.

Fig. 6 Females–leisure physical activity MET min. Estimates and 95 % CI from the age–period–cohort model for volume of leisure physical activity per day fitted to the Australian National Health Survey data for females. Age effects are the MET min/24 h and birth cohort and period effects are the ratios with 1940–50 as the reference for cohort and 1990 the reference for period.
Discussion
For those who participated in LTPA, the energy expenditure decreased with age in males but increased in females. It declined with recency of birth cohort in males, but not in females, and decreased with period for both the sexes. Participation in any LTPA decreased until middle age with some increase at retirement age, 60–70 years, before declining. Birth cohort had little effect on participation. Increases with survey period from 1990 to 2000 were shown but returned to baseline levels in 2005.
The age patterns for time spent and volume of LTPA for younger adults (20–40 years) differ by sex. Young males spend more time and have a greater volume of LTPA than young females, and it is only after 60–70 years (retirement age) that the time spent and volume become similar. Males showed two patterns; a decline from 20 to 40 years and then an increase from 60 years until 70 years. Females showed an increase with age becoming more prominent after 50 years until declining at 70 years. In females, no significant birth cohort effect was found for duration or volume, although the trends appeared positive. Both the sexes experienced a period decrease in duration and volume of LTPA. The cross-sectional analysis of Merom et al. of the 1990–2000 NHS data indicated increases in walking and moderate activities over time, but it could be due to the effect of ageing of the population. The longitudinal approach taken in the present study allows the determination of the health promotional effects during the period independent from the effect of ageing and birth cohort. This analytical approach demonstrates that no overall gain in time spent or volume of LTPA was achieved from 1990 to 2005(Reference Merom, Phongsavan, Chey and Bauman6).
The time spent in LTPA and the volume of the LTPA explain some of the observed patterns in energy expenditure with age, birth cohort and period. The trends in energy expenditure followed the patterns of time spent and volume of LTPA with one exception; the increase in duration and volume of LTPA from 60 to 70 years in males did not correspond to an increase in the energy expenditure. This may be because the decline in BMR with age after 60 years (at least in the formulae used) means less energy expended for any given LTPA volume. In females, no significant age effect was found for the energy expenditure of LTPA, but it seemed that there was a positive trend until 70 years of age. Both the sexes experienced a period decrease in energy expenditure of LTPA. Recommendations to participate in LTPA now place a greater emphasis on accumulating health-enhancing amounts through moderate-intensity activities. Although this contributes to decreasing health risk factors such as CVD, it may be insufficient to increase the population energy expenditure in LTPA and curb the problem of increasing overweight and obesity. As noted by others(Reference Erlichman, Kerbey and James22), we may need to give more detailed messages about intensity and duration of exercise.
The male population should be encouraged to increase the volume of physical activity to avoid the sharp decline in energy expenditure through their 20s–40s. More recently born cohorts need the most focus. Younger females may also benefit from interventions because those less than 50 years spent less than 20 min/d in LTPA. In the present study, the estimation of energy expenditure is restricted to LTPA and this may be a small part of the total energy expenditure on a population level. For women, energy expenditure in household tasks makes a significant contribution to expenditure in addition to occupation and leisure (http://www.abs.gov.au/AUSSTATS/abs%40.nsf/Latestproducts/4153.0Main%20Features22006?opendocument&tabname=Summary&prodno = 4153.0&issue=2006&num=&view). Occupational energy expenditure may be a more important determinant of an individual's overall energy expenditure because of the large proportion of waking hours spent at work Reference Brownson, Boehmer and Luke23).
Among the limitations of the present study are that all data were from self-report and BMR was calculated from formulae and MET values obtained from tables rather than directly measured(Reference Schofield18, Reference Ainsworth, Haskell, Leon, Jacobs, Montoye, Sallis and Paffenbarger19). MET values are measured from resting energy expenditure rather than basal conditions, and thus would be a little lower than the true rise from BMR. The power of the present analysis to detect both true period and cohort effects may be limited by the short length of observation (15 years) and smaller sample sizes in 2000 and 2005 resulting in sparse data for the very early and late cohorts. The variability increases on approach to the extremities for cohort.
In conclusion, the time, volume and energy expended in LTPA were independently influenced by age and period, and in males, birth cohort as well. As the trend for period declines, more targeted health promotion messages addressing total volume (duration and intensity) of LTPA for the avoidance of overweight and obesity in addition to the other health benefits of LTPA appear to be indicated. Investigation of energy expended in other domains of physical activity is also essential.
Acknowledgements
The Australian Bureau of Statistics provided the confidential record files for the analysis. When the work was conducted, Dr M. A. A.-F. was employed by the NSW Centre for Overweight and Obesity, which is funded by the NSW Department of Health. A. E. B. is the recipient of a Medical Foundation Fellowship at the University of Sydney. None of the authors had any conflict of interest. The study was designed by M. A. A.-F. and A. E. B., and all authors (M. A. A.-F., A. E. B., T. C., D. M. and H. B.) participated in the conduct and analyses of the study and preparation of the manuscript.


