Previous research has documented suboptimal dietary practices among Canadian children(Reference Garriguet1, Reference Garriguet2), particularly in the school context(Reference Woodruff, Hanning and McGoldrick3–Reference Tugault-Lafleur, Black and Barr5). In 2004, Canadian children reported consuming about one-third of their total daily energy at school, but reported relatively fewer dairy products and more minimally nutritious foods during school hours compared with the remainder of the school day(Reference Tugault-Lafleur, Black and Barr5). Schools have the potential to contribute to children’s overall well-being by creating health-promoting environments that support healthy eating and physical activity(6, 7). Since 2005, all ten Canadian provinces have targeted schools as key settings for healthy eating initiatives(Reference Leonard8, 9). Still, little is known about how children’s dietary quality has changed over the last decade, both at school and for the whole day.
Monitoring children’s dietary quality at school can provide insights needed to inform school-based interventions and policies addressing specific aspects of the diet which would most benefit from intervention(Reference McGinnis, Harrell and Meyers10–Reference Ahluwalia, Dwyer and Terry12). We previously reported data on the school hour and school day dietary intakes of Canadian children using data from the nationally representative 2004 Canadian Community Health Survey (CCHS 2004)(Reference Tugault-Lafleur, Black and Barr5, Reference Tugault-Lafleur, Black and Barr13). At that time, we found that the average quality of foods and beverages consumed by Canadian children during school hours was suboptimal in relation to national dietary recommendations, and also reported differences in average school hour quality scores among children living in different provinces and between older and younger children(Reference Tugault-Lafleur, Black and Barr5). In 2015, Statistics Canada conducted a follow-up national nutrition survey (the 2015 CCHS – Nutrition) using methods that were similar to the ones used in 2004(14). This provided an opportunity to compare differences in children’s school hour and school day dietary intakes in 2004 v. 2015 and to assess whether differences in mean dietary quality scores found among sociodemographic subgroups (previously reported in 2004(Reference Tugault-Lafleur, Black and Barr5)) were also observed in 2015.
The purpose of the present study was to compare school hour and school day dietary quality among Canadian children from 2004 to 2015. We hypothesized that: (i) school hour and school day dietary quality would improve from 2004 to 2015; (ii) differences in school hour dietary quality among sociodemographic subgroups (i.e. based on province of residence and age group) would persist from 2004 to 2015; and (iii) the magnitude of changes over time in school hour diet quality would be similar across province of residence and other sociodemographic factors.
Participants and methods
Data source and study sample
Nationally representative data were obtained from the 2004 and 2015 CCHS. Both surveys used a multistage stratified cluster sample that was nationally representative for age, sex, geography and socio-economic status (n 35 107, response rate 76·5 % in 2004(15); n 20 487, response rate 61·6 % in 2015(14)). The surveys targeted residents of all ages (in 2004) and ages 1 year and above (in 2015) living in private dwellings in Canada’s ten provinces(14). The target population did not include individuals who were full-time members of the Canadian Forces or who lived in the Territories, on reserves and other Aboriginal settlements, in some remote areas or in institutions (e.g. prisons or care facilities)(14). A computer-assisted 24 h dietary recall method asked respondents about all foods and beverages consumed from midnight to midnight on the previous day, including types and amounts of foods consumed, eating occasion (e.g. breakfast, lunch, snack) and time of consumption(15). The approach used for the 24 h recall was based on the US Department of Agriculture’s Automated Multiple-Pass Method. This method is an automated questionnaire that guides the interviewer through a series of questions and probes to maximize the interviewee’s opportunities for remembering and reporting foods and beverages consumed(16). Interviews for children aged 6–11 years were conducted with parental assistance. Children aged 12 years or above were asked to provide their own information. The present study used the first interviewer-administered 24 h recall for both survey years (2004 and 2015). The mean of one-day intakes is an acceptable estimate of the mean ‘usual’, or long-term daily average, intake of a population when it is properly estimated; that is, when the days of the week and seasons of the year are adequately represented(Reference Freedman, Guenther and Krebs-Smith17), which was the case for both the 2004(15) and 2015(14) waves of the CCHS. All foods and beverages in 2004 were analysed using the food composition data from the 2001b version of the Canadian Nutrient File database(18). In the case of the CCHS 2015 – Nutrition, the 2015 version of the Canadian Nutrient File was used. Permission to conduct these analyses and access to these data was provided by Statistics Canada’s Research Data Center Program.
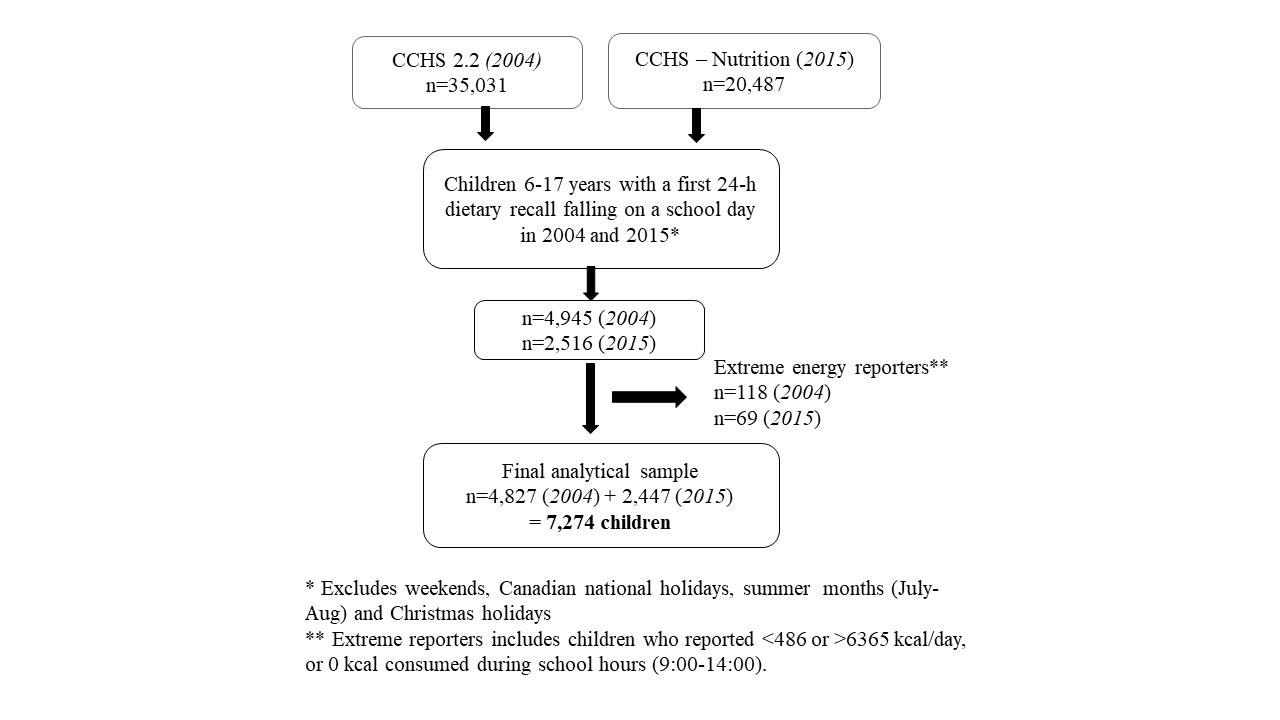
Analyses included respondents (n 4945 in 2004 and n 2516 in 2015) aged 6–17 years who completed a first 24 h dietary recall which fell on a weekday (Monday through Friday) but excluded recalls which fell on any days from 22 December through the end of the first week of January (typical Christmas/winter break), other national holidays or during summer months (from 21 June through Labour Day in September). This sample comprised 55 and 57 % of all surveyed children aged 6–17 years in 2004 and 2015, respectively. Similar to the approach used by Sheehy et al. (Reference Sheehy, Kolahdooz and Schaefer19), diet recalls with reported daily energy intakes below 2033 kJ (486 kcal) and above 26 631 kJ (6365 kcal) were considered to reflect extreme energy reporting and therefore dropped (n 28 in 2004 and n 15 in 2015). Children who reported 0 kJ (0 kcal) intake during (or outside) school hours were also excluded (n 90 in 2004 and n 54 in 2015). This resulted in a final analytical sample of 7274 children (n 4827 children in 2004 and n 2447 in 2015; see online supplementary material, Supplemental Fig. S1).
Measures
Time of consumption was used to classify foods and beverages as falling either within or outside school hours as the first CCHS in 2004 did not ask respondents to state where the food or beverage was consumed(18). Since school hours vary among Canadian jurisdictions(20), it was not possible to determine the exact time window which would include school hours for all Canadian children. Foods consumed between 09.00 and 14.00 hours were classified as foods consumed during school hours since this time was most likely to include school hours for most Canadian children.
Dependent variables included school hour and school day intakes of energy, macro- and micronutrients, food group servings (using standard servings from the 2007 Canadian Food Guide(21)), tier 4 food group servings (described below) and energy from other foods (foods not part of the food guide). In addition to providing recommendations for the number of daily servings from each of the four major food groups (vegetables and fruit, grain products, milk and alternatives, meat and alternatives), the 2007 Canada’s Food Guide provided guidance on the types of foods to choose from each group through directional statements (e.g. ‘choose vegetables and fruit prepared with little or no added fat, sugar or salt’(21)). Created by Health Canada in 2014(22, Reference Elvidge Munene, Dumais and Esslinger23), the tier system was based on this guidance and categorizes foods within each of the four food groups from the 2007 Canadian Food Guide as falling within one of four tiers – where tier 1 foods are considered the most nutritious foods and tier 4 the least nutritious foods. Tier 1 and 2 foods are foods described as ‘foods in line with the Canadian Food Guide guidance’, tier 3 foods are foods that are ‘partially in line with the Canadian Food Guide guidance’ and tier 4 foods are described as ‘foods not in line with the Canadian Food Guide guidance’(22). For example, tier 4 foods from the vegetables and fruit group exceed at least two of the upper thresholds for total fat (>10 g per reference amount), saturated fat (>2 g per reference amount), total sugars (>19 g per reference amount) and sodium (>360 mg per reference amount). Examples include deep-fried or battered foods (e.g. French fries in the vegetables and fruit food group). Within this framework, 100 % fruit juices count towards total servings of vegetables and fruit (where 1 serving is equivalent to 125 ml)(21). 100 % fruit juices are classified as either a tier 2 or tier 3 food, depending on their content of total sugars(22). Tier 4 foods are not counted towards the total number of food guide servings, and thus were reported separately. Other foods are foods which fall outside the four food groups of the 2007 Canadian Food Guide and may include, for example, sugar-sweetened beverages, chocolate bars, and salty snacks such as potato chips.
To provide an overall measure of dietary quality (measuring adherence to Canadian national dietary guidelines that existed at the time of the study), we used the Canadian Healthy Eating Index (C-HEI(Reference Garriguet2)). The C-HEI scoring system is based on daily intake standards. That is, maximum scores are given when a respondent’s intake met the recommended number of daily servings for a given food group (e.g. 2 servings of milk and alternatives/d recommended for children aged 6–8 years)(Reference Garriguet2). To provide a measure of diet quality specific to the school context, we also used an adaptation of the C-HEI for school hours (the school Healthy Eating Index, or school-HEI)(Reference Tugault-Lafleur, Black and Barr5). The scoring criteria for the school-HEI have been described previously(Reference Tugault-Lafleur, Black and Barr5). Briefly, preliminary analyses were conducted to examine the average energy contribution of foods and beverages consumed during school hours (09.00–14.00 hours) in 2004 and 2015. The mean proportion of energy from foods consumed during school hours (se) relative to whole day intake was 33·6 (0·4) % in 2004 compared with 34·3 (0·4) % in 2015 (P value from two sample t test = 0·222). Therefore, similar to the US Department of Agriculture’s National School Lunch Program nutrient criteria approach(24), the scoring criteria for each component of the school-HEI index were scaled by one-third in 2004 and 2015.
Sociodemographic variables included sex, age, age group, ethnicity (White v. non-White), rural v. urban location of residence, province of residence, parental education level and household food security status. Respondents were classified as living either in urban population centres or rural areas, where urban areas were defined as ‘those continuously built-up areas having a population concentration of 1000 or more and a population density of 400 or more per square kilometer based on current census population counts’(25, 26). Parental education was recoded into a dichotomous variable, classifying respondents living in a household where household member(s) had either no post-secondary education or at least some post-secondary education (or higher). In both 2004 and 2015, household-level food security status was measured using the Household Food Security Survey Module (HFSSM). This module, completed by the adult member of the household, contained eighteen questions used to assess ‘uncertain, insufficient or inadequate food access, availability and utilization due to limited financial resources, and the compromised eating patterns and food consumption that may result’ in the previous 12 months’(27). Ten of the eighteen items are specific to the experiences of adults in the household or the household in general (adult scale), while eight are specific to the experiences of children under the age of 18 years in the household (child scale). The food security status of child and adult members of the household was determined by the number of food-insecure conditions reported; that is, by the number of questions in the HFSSM that the respondent answered affirmatively. To be considered food-secure, no items, or only one item, in the adult or child scale were affirmed. In these analyses, food insecurity was recoded as a dichotomous variable (food-secure v. food-insecure which collapsed the moderate and severely food-insecure children) to facilitate comparisons between survey cycles. Since no household sampling weight was created for estimating the prevalence of household-level food insecurity, the prevalence of food insecurity was estimated using respondent (individual) sampling survey weights for 2004 and 2015. The prevalence of food insecurity can therefore not be considered nationally representative of household-level food insecurity status.
Statistical analyses
Rao–Scott χ 2 tests were used to test whether the sociodemographic characteristics of Canadian schoolchildren differed between 2004 and 2015. The main independent variable of interest was survey cycle year (a dichotomous variable). The primary dependent variables included intakes of nutrients, food group servings, C-HEI and school-HEI scores. Multivariable-adjusted linear regression models were used to compare differences in dietary outcomes between 2004 and 2015. All models were adjusted for energy intake (during school hours or for the whole school day, as appropriate) and for the potentially confounding effects of the sociodemographic differences between the 2004 and 2015 samples. Given the normal distribution of C-HEI scores and use of energy adjustment within all regression models, we believe that the normality of the dependent variables was not a concern for these analyses.
Because energy misreporting changed over time between 2004 and 2015(Reference Garriguet28), sensitivity analyses were conducted among the sample of respondents deemed to be plausible energy reporters to assess the potential impact of energy misreporting on changes in dependent variables. Plausible energy reporters were identified using the Institute of Medicine’s total energy expenditure requirements equations in the sub-sample of children with measured heights and weights using the method developed by McCrory et al.(Reference McCrory, Hajduk and Roberts29) (which had been previously used with the 2004 CCHS(Reference Garriguet30)). Physical activity was assessed differently in 2004 and 2015, precluding the use of self-reported physical activity estimates from individual respondents in the calculations of total energy expenditure. Instead, fixed levels of physical activity (by age group) were assumed for the entire population(Reference Garriguet28). Children younger than 14 years of age were assumed to be low active, while adolescents aged 14 years or older and adults were assumed to be sedentary. These levels are consistent with the average physical activity levels measured directly among Canadian children and adolescents from 2007 to 2015(Reference Colley, Carson and Garriguet31).
To test for significant differences in school-HEI scores among sociodemographic subgroups (in 2004 and 2015), simple linear regression models were used with the sociodemographic characteristic (sex, age group, ethnicity, urban/rural residential location, province of residence, household-level education and food security status) as the independent variable and school-HEI score as the dependent variable. A Bonferroni adjustment was used to account for multiple comparisons in models with multiple dummy variables (e.g. province of residence). To determine whether sociodemographic variables moderated any change in school-HEI over time, Wald tests for the joint significance of the interaction product terms were used.
Missing data (respondents who answered ‘don’t know’, ‘refused’ or ‘not stated’ for questions related to ethnicity or food security status; n 63) were handled with case-wise deletion. Therefore, analytical sample sizes varied slightly across analyses. Survey sampling weights were applied to generate nationally representative estimates. Each set of the 500 sets of bootstrap weights (2004 and 2015) supplied by Statistics Canada was used to derive robust se. All analyses were conducted using the statistical software package Stata version 13, with significance defined as P < 0·05 (Bonferroni-adjusted P < 0·05/n, with n being the number of comparisons).
Results
Table 1 provides the sample characteristics of Canadian children aged 6–17 years whose first 24 h dietary recall fell on a Canadian school day in each of the survey waves. The sociodemographic profile of the children was generally similar between survey cycles. However, the proportion of respondents self-identifying as non-White rose from 18 % in 2004 to 31 % in 2015. The prevalence of reported food insecurity also differed between the two survey cycles, with a higher prevalence of food-insecure households in 2015.
Table 1 Characteristics of Canadian children aged 6–17 years who provided a 24 h dietary recall on a school day in 2004 and 2015
CCHS, Canadian Community Health Survey.
* Differences in the sociodemographic profile of children between sample years were tested using Rao–Scott χ 2 tests.
† Missing data (don’t know, refusals or not stated) for two respondents (n 7272).
‡ Missing data (don’t know, refusals or not stated) for seventy-nine respondents (n 7195).
§ Missing data (‘not stated’) for sixty-two respondents (n 7212). In 2015, no household sample weight was created for the analysis of the prevalence of food security. The prevalence of food insecurity was estimated using respondent (individual) sampling survey weights for 2004 and 2015. Hence, the prevalence of food insecurity may not be reflective of all the respondents living in the households (and was not representative of national household-level food insecurity status).
Reported mean energy intake was, on average, 377 kJ (90 kcal) lower during school hours in 2015 (Table 2). Therefore, when comparing school hour nutrient and food group intakes between 2004 and 2015, all models were adjusted for energy intake during school hours, ethnicity and food security status. From 2004 to 2015, Canadian children’s average intakes of fibre, PUFA, linoleic acid, cholesterol and protein increased, while intakes of total sugars and MUFA decreased during school hours. Children reported higher intakes of vitamin A, thiamin, niacin, vitamin B6, folate, calcium, phosphorus, magnesium, zinc and potassium during school hours in 2015 compared with 2004. Table 3 shows covariate-adjusted mean intakes of food groups reported during school hours by Canadian children in 2004 and 2015. Children reported higher intakes of grain products, vegetables and fruit, milk and alternatives, and meat and alternatives in 2015 compared with 2004. At the same time, children reported, on average, close to 335 kJ (80 kcal) less from the combination of tier 4 foods and other foods in 2004 than in 2015.
Table 2 Nutrient intakes during school hours (09.00–14.00 hours) for Canadian children aged 6–17 years in 2004 and 2015

CCHS, Canadian Community Health Survey; RAE, retinol activity equivalents (µg); DFE, dietary folate equivalents (µg).
* Differences in energy intake between survey cycle tested using a simple linear model.
† Differences in covariate-adjusted nutrient intakes were tested using multivariable linear regression models adjusted for school hour energy intake, ethnicity and household food security status (n 4791 in 2004 and n 2420 in 2015) due to missing data for ethnicity and food security status in 2004 and 2015.
Table 3 Food group intakes during school hours (09.00–14.00 hours) for Canadian children aged 6–17 years in 2004 and 2015

CCHS, Canadian Community Health Survey.
* Differences in covariate-adjusted intakes were tested using multivariable linear models adjusted for school hour energy, ethnicity and food security status (n 4791 in 2004 and n 2420 in 2015 due to missing data for ethnicity and food security status).
† Servings for each food group are defined according the 2007 Canadian Food Guide (e.g. 1 slice of bread (~35 g) is equivalent to 1 serving of grain products, 250 ml of milk is equivalent to 1 serving of milk and alternatives)(21).
‡ Tier 4 foods are minimally nutritious food choices within a food group (e.g. French fries in the vegetables and fruit food group, doughnuts and cookies in the grain products group), and do not count towards the total number of food guide servings since they exceed thresholds for total sugars, fat, saturated fat and/or sodium(22).
§ Other foods are foods that do not fall within the core food groups of the 2007 Canadian Food Guide (fats and oils, high-energy beverages, condiments, alcoholic beverages, high-fat and/or high-sugar foods that could not be assigned into one of the four food groups, as well as high-fat/sugar foods that are usually eaten in small quantities (i.e. not large enough to contribute to a food guide serving, e.g. fruit jam)).
Table 4 compares the covariate-adjusted means from multivariable models of school-HEI scores in 2004 and 2015. Total school-HEI score increased by ~13 % (approximately 7 points out of a possible maximum score of 100 points) from 2004 to 2015. Sub-scores for total vegetables and fruit, whole fruit, dark green and orange vegetables, milk and alternatives, and meat and alternatives all increased significantly over time. However, the effect sizes were small for many sub-scores. A more substantial improvement was found for the vegetable and fruit sub-score. Sub-scores for other foods also improved, indicating that the proportion of school hour energy coming from these minimally nutritious foods declined from 2004 to 2015. Indeed, the improvement in sub-score for the other foods accounted for a substantial proportion of the difference in total school-HEI score from 2004 to 2015 (~39 % of the total change). Sub-scores for grain products, whole grains, unsaturated fat, saturated fat and sodium remained unchanged. Despite overall improvements, most mean sub-scores remained, in relative terms, low (defined as being below 50 % of their maximum possible score) for dietary components such as dark green and orange vegetables, whole grains, and milk and alternatives (see Fig. 1).
Table 4 Diet quality during school hours by cycle year, as measured by the school Healthy Eating Index (school-HEI)*, of Canadian children aged 6–17 years
CCHS, Canadian Community Health Survey.
* The scoring criteria for computing school-HEI scores have been previously described(Reference Tugault-Lafleur, Black and Barr5).
† Differences in covariate-adjusted school-HEI total and sub-scores between 2004 and 2015 were tested using multivariable linear models adjusted for school hour energy intake, ethnicity and household food security status (n 4791 in 2004 and n 2420 in 2015 due to missing data for ethnicity and food security status).
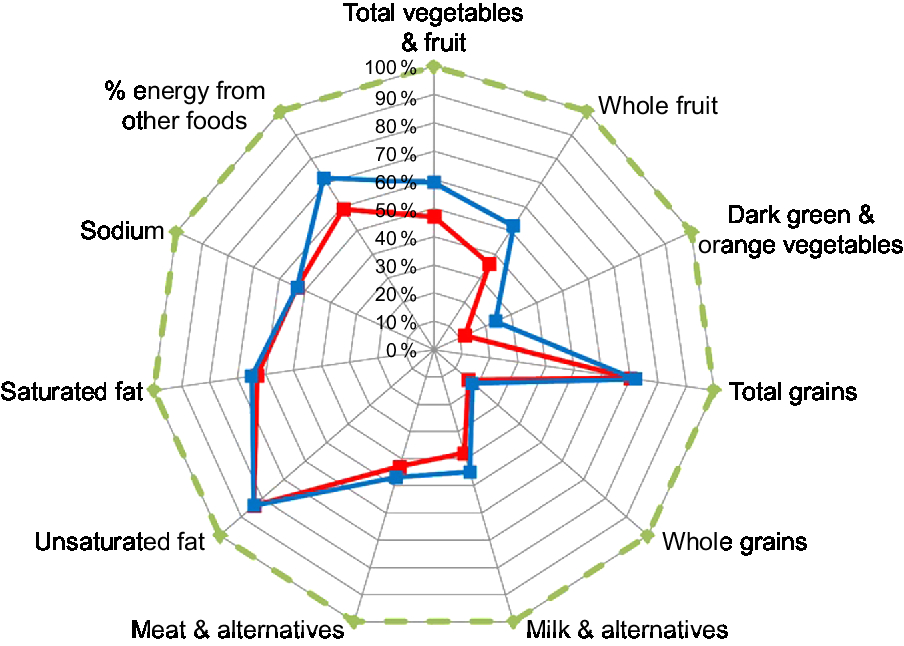
Fig. 1 School-HEI sub-scores for Canadian children aged 6–17 years from 2004 (CCHS 2.2; ![]() ) to 2015 (CCHS – Nutrition;
) to 2015 (CCHS – Nutrition; ![]() ). Each component score is scaled as a percentage of the maximum score (
). Each component score is scaled as a percentage of the maximum score (![]() ) for that component. For moderation components (saturated fat, sodium and percentage of energy from other foods), higher scores indicate lower consumption (school-HEI, school Healthy Eating Index; CCHS, Canadian Community Health Survey)
) for that component. For moderation components (saturated fat, sodium and percentage of energy from other foods), higher scores indicate lower consumption (school-HEI, school Healthy Eating Index; CCHS, Canadian Community Health Survey)
Sensitivity analyses conducted among only plausible energy reporters revealed that estimated energy intake during school hours declined by 138 kJ (33 kcal) from 2004 to 2015 (compared with a difference of 377 kJ (90 kcal) for the entire sample). After adjusting for energy intake during school hours, ethnicity and food security status, changes over time in school-HEI total score (51·3 in 2004 v. 58·7 in 2015) and sub-score components among plausible energy reporters were similar in magnitude and statistical significance to those observed for the entire sample, with the exception of grain products (which increased from 2004 to 2015; see online supplementary material, Supplemental Table S1).
Table 5 compares the covariate-adjusted means from multivariable models examining differences in mean C-HEI total and sub-scores between 2004 and 2015. Reported daily energy intake was, on average, 1209 kJ (289 kcal) lower in 2015 compared with 2004 (9414 (se 88) kJ/d (2250 (se 21) kcal/d) and 8205 (se 100) kJ/d (1961 (se 24) kcal/d) in 2004 and 2015, respectively; P value from two sample t test < 0·001). After adjusting for covariates (daily energy intake, ethnicity and food security status), whole day C-HEI scores increased, on average, by approximately 6 points from 2004 to 2015. Some of the changes in school-HEI sub-scores paralleled changes in C-HEI (whole day) sub-scores. For example, during school hours and for the whole school day, sub-scores improved for total vegetables and fruit, whole fruit, dark green and orange vegetables, and percentage of energy from other foods. However, school-HEI sub-scores for whole grains, unsaturated and saturated fats remained unchanged from 2004 to 2015, yet C-HEI scores improved slightly for whole grains, unsaturated fat and declined slightly for the percentage of energy from saturated fat. School-HEI sub-scores for milk and alternatives, and meat and alternatives all improved significantly from 2004 to 2015, but there was no difference in C-HEI sub-scores for these dietary components.
Table 5 Diet quality during school days by cycle year, as measured by the whole day Canadian Heathy Eating Index (C-HEI)(2), of Canadian children aged 6–17 years

CCHS, Canadian Community Health Survey.
* Differences in covariate-adjusted C-HEI scores between 2004 and 2015 were tested using multivariable linear regression models adjusted for whole day energy intake, ethnicity and food security status (n 4791 in 2004 and n 2420 in 2015 due to missing data for ethnicity and food security status).
Table 6 shows the mean (unadjusted) school-HEI scores across various sociodemographic groups for each survey cycle year. In both survey years, younger children reported higher school hour dietary quality compared with older peers and there were provincial-level differences in school-HEI scores for each survey cycle. In 2015 (but not 2004), children in food-insecure households had significantly lower school-HEI score compared with their peers in food-secure households.
Table 6 Average school Healthy Eating Index (school-HEI) scores by selected sociodemographic and geographic characteristics among Canadian children aged 6–17 years in 2004 and 2015*
CCHS, Canadian Community Health Survey.
a,b,c Mean scores within each group in a column with unlike superscript letters were significantly different. For example, 6–8-year-old children had significantly different school-HEI scores compared with children aged 9–13 years and 14–17 years, both in 2004 and in 2015. Differences in school-HEI scores associated with sociodemographic characteristics were tested using survey-weighted simple linear regression models with a Bonferroni correction for variables with more than two levels in each of the cycle years.
* This table shows average school-HEI scores among children by sociodemographic characteristics within each survey year (n 4827 children in 2004; n 2447 children in 2015); samples sizes may vary slightly due to missing data for ethnicity, household-level education and food security status.
There was no evidence of a moderation effect for any of the sociodemographic variables examined including age group and sex (see online supplementary material, Supplemental Table S2). In other words, the magnitude of the change in school-HEI score was similar between boys and girls and between younger and older children. Across all provinces, children reported higher school hour dietary quality in 2015 compared with 2004 (P value from the Wald test joint interaction for the product terms = 0·115).
Discussion
The purpose of the present study was to compare school hour and school day dietary quality among Canadian children from 2004 to 2015. Findings confirmed hypotheses that the dietary quality of Canadian children and adolescents during school hours and on school days improved from 2004 to 2015, but the magnitude of the change was modest, and the average dietary quality of foods consumed on school days remained below national dietary recommendations in place at the time of the survey. Similar to our estimates from 2004, we also confirmed that mean school hour dietary quality was lower among older children compared with their younger counterparts in 2015 and school hour dietary quality continued to vary across provinces in 2015. Finally, we found that none of the sociodemographic variables examined moderated associations between survey year and school hour dietary quality. That is, the magnitude of the change over time in school hour dietary quality was similar across provinces and across sociodemographically diverse groups.
The finding that Canadian children improved their dietary quality from 2004 to 2015 is consistent with a recent study reporting a 9-point increase in US children’s HEI-2010 scores (for the whole day) from 1999 to 2012(Reference Gu and Tucker32). Although that US study used a different diet quality index, the magnitude of the difference (a 9-point difference on a 100-point scale from 1999 to 2012)Footnote * appears to be relatively larger compared to what was found among Canadian children (only a 6-point increase out of 100 from 2004 to 2015) for the whole school day.
Greater intake of multiple dietary components, including increased intakes of vegetables and fruit, milk and alternatives, and meat and alternatives, and less energy from minimally nutritious foods (tier 4 foods and other foods) led to 7-point increase in school hour dietary quality in 2015. When whole day intakes were considered, increased intakes of vegetables and fruit, whole fruit, dark green and orange vegetables and less energy from minimally nutritious foods also led to comparable improvement in whole day diet quality scores (a 6-point difference in whole day C-HEI score between 2004 and 2015). Although differences in school hour and full day scores over time cannot be directly (or statistically) compared due to differences in the scoring algorithm of its components, it appears that Canadian children’s diets improved similarly during school hours and when whole day intakes were considered. However, for some sub-scores such as total vegetables and fruit and minimally nutritious foods, the magnitude of the differences appeared greater during school hours compared with when all whole day intakes were considered.
Since 2004, some provinces have issued province-wide bans on the sale of minimally nutritious foods (foods high in fat, sugar and sodium) in public schools(Reference Leonard8). Limited Canadian research has documented changes in students’ dietary practices associated with changing school nutrition policies and studies have often focused on regional samples with children aged 11–12 years(Reference Fung, McIsaac and Kuhle33, Reference Mullally, Taylor and Kuhle34). Our findings are consistent with the small Canadian literature which has reported modest improvements in children’s dietary intakes over time following the implementation of new province-wide school nutrition standards(Reference Fung, McIsaac and Kuhle33–Reference Cullen, Watson and Zakeri35). For example, in Nova Scotia, children’s dietary intakes were compared before (2003) and after the implementation of a provincial-level school nutrition policy (2011)(Reference Fung, McIsaac and Kuhle33). This policy included nutrition-based criteria for foods sold in schools, mandatory policies regarding the sale of foods and beverages in schools, regulations on advertising and price interventions to promote the affordability of school meals. From 2003 to 2011, children reported lower (daily) intakes of sugar-sweetened beverages (−0·20 cans/d, 95 % CI −0·27, −0·12), with concurrent increases in milk products (+0·24 servings/d, 95 % CI 0·18, 0·31)(Reference Fung, McIsaac and Kuhle33). However, there were no changes in reported daily intake of vegetables and fruit. A study(Reference Mullally, Taylor and Kuhle34) in a neighbouring province (Prince Edward Island) described changes in children’s total daily dietary intakes following a 2006 school nutrition policy aimed at improving students’ access to healthy foods, improving the quality of the school food environment and promoting nutrition education in schools(36). Compared with grade 5–6 students surveyed in 2001, students surveyed in 2007 were more likely to consume the number of daily servings of vegetables and fruit recommended in the 2007 Canadian Food Guide, and less likely to consume more than three servings of minimally nutritious foods daily(Reference Mullally, Taylor and Kuhle34). Similarly, we found that Canadian children (all provinces combined) reported significantly higher amounts of vegetables and fruit but less energy from minimally nutritious foods over an 11-year period, both during school hours and for the whole school day. It is possible that provincial, regional and local policies regarding the sale of ‘junk’ foods in schools may have had an impact, although the repeated cross-sectional nature of the present study does not allow for a direct examination of the impact of such policies. Since the majority of children in Canada bring a home-packed lunch to school(Reference Tugault-Lafleur, Black and Barr13), it is also possible that nutrition education campaigns and public dialogues led to increased awareness among parents of the health risk of minimally nutritious foods, leading them to pack more healthful foods in children’s lunch bags.
In analyses drawing from the 2004 CCHS, we previously reported differences in school hour dietary quality among age groups and province of residence(Reference Tugault-Lafleur, Black and Barr5). In 2015, we also found a significant difference in school-HEI score across age groups (younger children having higher school-HEI score) and variations across Canadian provinces. However, no significant interaction effects were found between age group and survey year in predicting school hour dietary quality, suggesting that gains in school hour dietary quality were similar across age groups. Similarly, we found no interaction between province of residence and survey year in models predicting school hour dietary quality. Variation in the type of provincial-level school nutrition policies (e.g. mandatory v. voluntary) has been reported in Canada(Reference Godin, Kirkpatrick and Hanning37–Reference Acton, Nguyen and Minaker40). For example, nutrition standards regarding the sale of foods and beverages in schools are voluntary in some provinces (e.g. in Alberta(41)) as opposed to being mandatory in others (e.g. Ontario(42), Nova Scotia(Reference Fung, McIsaac and Kuhle33)). Non-compliance with school nutrition policies has been reported in studies examining beverages and foods sold in school vending machines in Alberta and Ontario(Reference Vine, Harrington and Butler43, Reference Orava, Manske and Hanning44). Despite these variations in the implementation of school nutrition policies and guidelines, recent research has suggested no association between school nutrition policy enforcement level (mandatory v. voluntary) and school day dietary behaviours among Canadian youth and adolescents(Reference Acton, Nguyen and Minaker40). Our findings suggest that Canadian children’s school hour dietary quality improved similarly across provinces from 2004 to 2015.
In unadjusted models, children from food-insecure households had significantly lower school hour dietary quality compared with their peers in food-secure households in 2015 (a difference that was not found in 2004). While the magnitude of the difference between children from food-secure and food-insecure households was relatively small (a difference of ~2 points) and average diet quality increased in 2015 regardless of food security status, this finding emphasizes the need for continued attention to the impacts of food insecurity on Canadian children. Canadian children living in food-insecure households may have access to charity-based local school meals in some regions, but their expected impact on overall diet at the population level is likely low since (in 2004 when last measured nationally) very few Canadian school-aged children (~10 %) reported consuming foods sold or provided by schools during school hours(Reference Tugault-Lafleur, Black and Barr13). Unfortunately, neither the 2004 nor 2015 CCHS included any more specific questions regarding children’s participation in school meal programmes with which to more closely examine the associations between meal programme participation and food insecurity or dietary quality.
Key strengths of the present study include the use of large, nationally representative dietary surveys and the use of 24 h dietary recall data to capture detailed dietary intakes on school days. However, there are important limitations that deserve consideration. First, these analyses likely included days or time periods when some children were not physically in school (e.g. spring break), as the CCHS 2004 did not include a question asking respondents where food was consumed. However, we limited the potential to include such days by eliminating any reporting days which occurred on a Canadian national holiday or likely school break. Second, there were differences in the execution of the survey (e.g. different sample sizes, response rates, changes to the food booklet used to help estimate portion sizes) and data processing (e.g. changes to the nutrient databases used to analyse the 24 h dietary recalls) between survey cycles, which could have implications when comparing dietary intakes between survey years(14). For example, a lower response rate (61·6 % in 2015 compared with 76·5 % in 2004) increases the potential for non-response bias. Third, differences in misreporting – specifically increases in energy under-reporting and a decrease in energy over-reporting from 2004 to 2015(Reference Garriguet28) – could alter these findings. However, in sensitivity analyses where we only included plausible energy reporters, the direction and magnitude of changes in school-HEI scores over time were consistent with those found for the full sample. This suggests that misreporting had limited impact on our findings regarding the improvement in dietary quality over time. Nevertheless, it is possible that nutrition education policies and campaigns could have resulted in respondents’ tendency to minimize the reporting of minimally nutritious foods (and/or exaggerate the reporting of healthy foods such as fruit and vegetables) even among reporters with plausible reported energy intakes, thereby leading to an overestimation of the improvement observed in school hour dietary quality. Additionally, we did not have data with which to compare students attending private v. publicly funded schools or to assess other potentially salient school food environment exposures.
In summary, the average dietary quality of Canadian children during school hours and on school days improved modestly from 2004 to 2015 but remains below 2007 national dietary recommendations. These findings suggest that more effective efforts are needed to improve the quality of foods consumed by Canadian children during school hours and on school days. Interventions which aim to increase children’s consumption of vegetables and fruit, whole grains and dairy products have potential to help Canadian children move closer towards 2007 national dietary recommendations.
Acknowledgements
Acknowledgements: The authors gratefully acknowledge the staff of the British Columbia Inter-University Research Data Centre (UBC-RDC) for their technical support in accessing and using the CCHS 2.2 data. Financial support: This research was supported by the Canadian Institutes of Health Research (CIHR) (grant numbers FRN 151549 and FRN 119577). The services and activities provided by the UBC-RDC are made possible by the financial or in-kind support of the Social Sciences and Humanities Research Council (SSHRC), the Canadian Institutes of Health Research (CIHR), the Canada Foundation for Innovation (CFI), Statistics Canada, and UBC. The views expressed in this paper do not necessarily represent the Canadian Research Data Centre Network (CRDCN) or that of its partners. Conflict of interest: C.N.T.-L., J.L.B. and S.I.B. declare no conflict of interest. Authorship: C.N.T.-L. and J.L.B. designed the research; C.N.T.-L. conducted the research; C.N.T.-L. analysed the data; C.N.T.-L., J.L.B. and S.I.B. wrote the paper; C.N.T.-L. had primary responsibility for the final content. All authors read and approved the final manuscript. Ethics of human subject participation: Ethics approval was granted by the Statistics Act of Canada and data were accessed through the Statistics Canada Data Centre program.
Supplementary material
To view supplementary material for this article, please visit https://doi.org/10.1017/S1368980019000788