


Being overweight or obese has been identified as the primary aetiological factor for the development of type 2 diabetes (T2D) in adults(Reference Astrup and Finer1). With the prevalence of obesity within most populations rising, the WHO have predicted a 39 % increase in the global rate of diabetes from 2000 to 2030(2), although recent reports suggest this may be an underestimate(Reference Lipscombe and Hux3). The cost implications to the health service for treatment of T2D and its associated complications, both macro- and microvascular, are enormous. Historically, T2D was regarded as a ‘mild’ type of diabetes and was rarely treated with exogenous insulin. The publication of the United Kingdom Prospective Diabetes Study(4) provided the evidence to change treatment protocols, as it demonstrated improving glycaemic control in T2D significantly reduced the incidence of microvascular complications. The UK Prospective Diabetes Study (UKPDS) found no significant benefit of tight glycaemic control on the risk of developing macrovascular disease and it was suggested that ‘follow up is required to determine the risk-benefit ratio of the glycaemic improvement, side effects, changes in body weight, and plasma insulin concentration’(4, Reference Turner, Cull and Holman5). Treatment of T2D with insulin is now widely used with the specific intention to gain tighter control over blood glucose levels; insulin therapy is now an integral part of management of this chronic and widespread disease(6).
A commonly associated problem of commencing insulin therapy in T2D is the associated weight gain. Studies that have reported weight gains have observed an average gain of 5–7 kg during the first 6 months of insulin therapy(Reference Davidson, Hauptman and DiGirolamo7–Reference Khan9). The reasons for the weight gain are not clearly understood but in the already overweight or obese patient it is an unwelcome occurrence. There is strong evidence in the non-diabetic population that weight status itself and, more interestingly, the process of weight gain in middle age increases CVD risk(Reference Willett, Manson, Stampfer, Colditz, Rosner, Speizer and Hennekens10–Reference Garrow12). A directly proportional relationship between weight gain after the age of 18 years and risk of CVD has been documented(Reference Davies13). The health consequences of additional weight gain associated with insulin therapy in T2D remain unclear but are certainly a clinical challenge; with a background of high coronary risk it would be expected that further weight gain induced by insulin therapy would increase that risk(Reference Davies13). However, this has yet to be proven. Very few studies to date have investigated whether it is possible to limit the weight gain experienced in patients with T2D starting insulin therapy.
The primary aim of the present study was to investigate, using a randomised controlled design, whether an intensive programme of dietetic lifestyle and weight management advice could be effective in reducing weight gain (achieving weight maintenance) over the first 6 months of insulin treatment in adults with T2D. The study hypothesis was that adults with T2D who start insulin therapy and have access to standard care would experience significant weight gain in the first 6 months compared with those who undertook an intensive lifestyle intervention. It was predicted that all patients with T2D who commenced on insulin therapy would experience an improvement in glycaemic control.
Methods
This trial was an unblinded randomised parallel intervention study with a control group receiving standard care and the intervention being a 6-month dietitian-led ‘Lifestyle change’ programme.
Recruitment took place at two tertiary hospitals in South East England over a 2-year period (2004–5). Potential participants were identified by clinic staff as patients with T2D who were about to be commenced on insulin therapy. These subjects were then approached by the first author (R. B.) to ascertain their willingness to participate in the study. All potential participants had a diagnosis of T2D and were within 4 weeks of starting insulin therapy. Subjects were included if they had a BMI > 27 and < 50 kg/m2, aged between 18–75 years, able to read and understand written English and able to give informed consent. Exclusion criteria were the presence of co-morbidities that may affect nutritional intake such as inflammatory bowel disease, cancer, or renal or liver disease. Individuals receiving medication to assist with weight loss such as Reductil or Orlistat were also excluded. Females were excluded if they were pregnant, lactating or planning a pregnancy.
Protocol assignment
The primary outcome measure was change in weight over 6 months following initiation of insulin therapy. Power calculations were based upon an expected 3·5 kg difference in weight change and standard deviation of 4 kg between the control and intervention groups. These calculations indicated that twenty-one subjects in each group were required for a statistical strength of 80 % and a significance of 0·05. Allowing for an estimated drop-out rate of 20 %, the total target number to recruit was forty-eight subjects.
Randomisation
Subjects were randomly assigned to either the control or intervention groups following a computer generated randomisation table according to the order in which they were recruited. There were two levels of stratification for sex (male and female) and three levels of stratification for ethnicity (White, Black and Asian).
Intervention
The intervention consisted of a 6-month intensive weight and lifestyle intervention, the details of which are summarised in Table 1. The intervention followed the ‘Lifestyle Clinic’ developed by Frost et al. (Reference Frost, Lyons, Bovill-Taylor, Carter, Stuttard and Dornhorst14), which was itself based upon the interventions used in the US Diabetes Prevention Program(15). The Lifestyle Clinic uses a holistic approach, aiming to improve overall health through motivational interviewing, initiation of patient empowerment and providing support and advice, with the overall aim of achieving a 2092 kJ (500 kcal)/d energy deficit. The subjects in the intervention group were seen by a registered dietitian (R. B.) on each clinic visit for continuity of care and were seen six times over 6 months. Appointment times were approximately 90 min for the first appointment and 30 min thereafter. At each appointment, individualised targets were agreed and documented. Achievement of these targets was checked at the subsequent appointment and motivational interviewing techniques were used to encourage goal attainment and maintenance of diet and lifestyle change.
Table 1 Summary of topics and details of each topic covered in the ‘Lifestyle intervention’
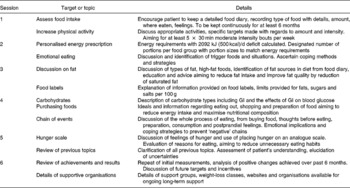
GI, glycaemic index.
Subjects in the control group continued to receive standard care which followed general procedures that would occur regardless of participation in the study. Standard care for this population group at the time of the study included an annual review in the endocrinology clinic, appointments and phone contact with diabetes specialist nurses and, if required, referral to other health professionals. Normal referrals or appointments with allied health professionals, such as dietitians, were unaffected for those in the control group but were documented for the purposes of the study.
Study protocol and monitoring
All measurements were taken at baseline, and repeated after 6 months (except height). The anthropometric measurements taken were height (cm), weight (0·1 kg electronic scales), waist circumference (at naval level and correct to 0·2 cm) and percentage body fat, which was estimated using bioelectrical impedance analysis (Biospace InBody 3·0; Biospace, Soeul, South Korea). BMI was calculated by dividing the weight in kg by the height in metres squared. A number of measurements were taken, which on an individual basis provide an indication of CVD risk, but include measurements which can be used in combination to estimate actual CVD risk through the use of a risk model. These measurements include blood pressure and fasting lipid levels. Blood pressure was measured using an electronic sphygmomanometer (Omron M4; Omron, Kyoto, Japan). A fasting venous blood sample was taken and subjects were asked to refrain from strenuous exercise for 24 h before the appointment. The plasma was analysed for HbA1c, glucose, total cholesterol, HDL-cholesterol, LDL-cholesterol and TAG. The total cholesterol:HDL-cholesterol ratio was calculated. The CV of all plasma analysis were below 5 %. To assess cardiovascular risk the UKPDS risk engine(Reference Stevens, Kothari, Adler and Stratton16) was used. Four estimated risk scores were provided by the model; CHD, fatal CHD, stroke and fatal stroke. These estimated CVD risk scores were calculated at the start and end of the study for each patient.
Statistical analysis
All data were tested for normality using the Kolmogorov–Smirnov statistic. Primary analysis was carried out using an intention-to-treat analysis with baseline values carried forward to account for missing values. Parametric tests were used for the data found to be normally distributed. Intra-group analysis was conducted using paired t tests, analysing the difference between the start and end measurements. Paired t tests were carried out on all the patients collectively and the control and intervention groups separately. Independent t tests were used for inter-group analysis, comparing the start and end measurements, in addition to the absolute change and percentage change in each parameter. Pearson χ2 tests were used to explore the relationships between categorical data, such as the randomised group compared with the direction in which blood pressure changed. ANOVA showed that site of recruitment did not affect weight change nor attrition rate, so we analysed all data together.
Results
Participant flow
One hundred and eighty-nine patients were referred to the study. Of those patients referred, 29 % were recruited; 71 % did not enter the study due to either not meeting the study criteria or the patient not wishing to participate. Fig. 1 shows the flow of patients through the study. At the end of 6 months, the overall attrition rate was 6 % from the study.

Fig. 1 Participant flow.
Baseline data
Clinical and anthropometric characteristics were assessed at baseline and there were no significant differences in sex, ethnicity, age, BMI, percentage body fat or HbA1c between the control and intervention groups. The mean age of subjects was 55·8 (sd 11·3) years. Subjects were centrally obese (mean waist circumference 111·3 (sd 12·0) cm), had systolic hypertension (143·0 (sd 23·5) mmHg) and poor glycaemic control (mean HbA1c 9·7 (sd 1·4) mmol/l; mean glucose 11·4 (sd 3·2) mmol/l). According to The International Diabetes Federation worldwide definition(17) forty-seven (94 %) out of fifty subjects exhibited the metabolic syndrome. There were no differences between the groups in the duration of T2D (control 93·8 (sd 54) v. 96·8 (sd 64) months intervention) or the time since commencing on insulin therapy (control 2·6 (sd 1·1) v. 2·3 (sd 1·1) weeks intervention) or the number of insulin units prescribed (control 33·3 (sd 7·8) v. 29·5 (sd 9·8) units intervention).
The primary outcome measure was change in weight over the first 6 months following the initiation of insulin therapy. The control group gained a significant amount of weight 4·6 (sd 3·7) kg (P < 0·001), whilst the intervention group managed to maintain their original weight (mean weight change − 0·6 (sd 5·0) kg). The difference in weight change between the intervention and control groups equated to 5·2 kg which was highly significant (P < 0·001). In terms of percentage body weight, the control group gained an additional 5·1 % of body weight in the 6 months after commencing insulin whilst the intervention group lost 0·5 % body weight (P < 0·001). All other anthropometric measures followed similar patterns (see Table 2).
Table 2 Summary of baseline anthropometric and biochemical data and the changes observed in the intervention and control groups after 6 months of insulin therapy
(Mean values and standard deviations)
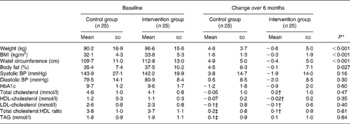
BP, blood pressure.
* Difference between control and intervention groups (t test).
† n 20.
‡ n 24.
Over the 6 months of the study, both groups experienced a significant reduction in HbA1c from baseline; the control group had a reduction from 9·7 to 8·5 % (P < 0·001) and the intervention group had a reduction from 9·6 to 8·7 % (P < 0·05). There were no differences in the initial, final or change in HbA1c or fasting glucose between the control and intervention groups.
There were only minor alterations in blood lipids throughout the study. The lipid profile tended to worsen from the initial reading to the endpoint in both groups but not significantly, with the only favourable change occurring in the total cholesterol:LDL-cholesterol ratio in the control group. There were no statistical differences in any of the lipid fractions between the groups either at the start or at the end of the study.
There were small but non-significant alterations in blood pressure throughout the 6-month study, but the direction of change in blood pressure differed. The control group had a mean increase in both systolic and diastolic blood pressure of 3·8 and 0·5 mmHg (NS) respectively, whereas the intervention group had a mean decrease in both readings of 1·9 and 2·0 mmHg (NS) respectively. Subjects in the control group were statistically more likely to have an increase in blood pressure whilst those in the intervention group were more likely to have a decrease in blood pressure (χ2 3·92; P < 0·05). Regardless of study group, overall, there was a positive correlation between percentage weight loss and fall in systolic blood pressure (r 0·288; P = 0·043).
There was an increase in the all CVD risk scores in both groups in the 6 months following insulin therapy, except for a very slight decrease in risk of a fatal CHD event in the intervention group (see Fig. 2). The changes that occurred over the 6 months and the difference between the groups were not significant. The percentages of patients that had decreases in CHD risk in the control and intervention groups were 56·1 v. 61·1 %, decreases in fatal CHD risk 60·9 and 66·7 %, decrease in cerebral vascular accident risk 21·7 and 22·2 % and decreases in fatal cerebral vascular accident risk 26·1 and 33·3 % respectively. Pearson χ2 analysis on the direction of change in risks was not significant. An individual is considered at high risk of CHD if their score exceeds 15 %(Reference Guzder, Gatling, Mullee, Mehta and Byrne18). At baseline, twelve subjects in the control and nine in the intervention group exceeded this score and at the end of the study there were two subjects in each group that would be considered to have a high CHD risk using this scoring system.

Fig. 2 Mean calculated coronary heart disease (CVD) risk and cerebral vascular accident (CVA) risk at baseline and after 6 months for control and intervention groups. Values are means, with their standard errors represented by vertical bars. (![]() ),Baseline control; (
),Baseline control; (![]() ), end-point control; (
), end-point control; (![]() ), baseline intervention; (
), baseline intervention; (![]() ), end-point intervention.
), end-point intervention.
When there is a major change in treatment for T2D, such as when insulin therapy is started, hospital protocols state that the patient should be referred to a dietitian. Despite this protocol, in the 6-month duration of the study only 18 % of the whole cohort was seen by another dietitian and 25 % were referred to a dietitian at the time of commencing on insulin. Fewer patients in the intervention group were seen by another dietitian than those the in control group, potentially because staff knew that the patients were receiving dietetic follow-up as part of the study and therefore did not refer those in the intervention group as frequently.
Discussion
The present study demonstrates that subjects with T2D can gain a statistically and clinically significant amount of weight in the 6 months after starting insulin. Those with access to intensive intervention are able to maintain their original body weight with the early introduction of dietetic care. We conclude from these findings that weight gain is not necessarily an inevitable consequence of starting insulin therapy, but attenuation of the weight gain requires a high level of intervention. The present study supports the suggestion of Dickinson et al. (Reference Dickinson, Dornhorst and Frost8) and UKPDS(6) that most weight gain occurs soon after the initiation of insulin therapy and slows with time, suggesting that the first 6 months to 1 year after initiating insulin therapy is the ideal ‘window of opportunity’ for intensive lifestyle and diet advice to prevent weight gain. These findings are similar to another intensive lifestyle intervention in T2D that was carried out in individuals who were not receiving insulin therapy(Reference Ash, Reeves, Yeo, Morrison, Carey and Capra19).
The aim of starting insulin therapy is to improve glycaemic control. It has been shown that a decrease in HbA1c is associated with reductions in microvascular complications(Reference Genuth, Eastman, Kahn, Klein, Lachin, Lebovitz, Nathan and Vinicor20, Reference Klein21), with any reduction in HbA1c having benefits. However, the relationship between HbA1c and macrovascular disease is less defined. The American Diabetes Association has stated that ‘the role of hyperglycaemia in cardiovascular complications is still unclear’(Reference Genuth, Eastman, Kahn, Klein, Lachin, Lebovitz, Nathan and Vinicor20). A recent meta-analysis of the relationship between glycated Hb and CVD concluded that ‘improvements in glycaemia may lower the risk for cardiovascular disease’(Reference Selvin, Marinopoulos, Berkenblit, Rami, Brancati, Powe and Golden22), a finding which is not particularly compelling. The lowest risk of CVD was associated with HbA1c < 6 %, a level suggestive of normal metabolism and rarely achieved by individuals with T2D.
As was anticipated, insulin therapy significantly improved glycaemic control, regardless of the level of dietetic intervention. However, after 6 months of treatment both groups had HbA1c that remained high (> 8 %). The reduction in HbA1c observed would be sufficient to reduce diabetic symptoms, but insufficient to minimise the risk of diabetic co-morbidities(Reference Selvin, Marinopoulos, Berkenblit, Rami, Brancati, Powe and Golden22, 23). Insulin therapy is undoubtedly a necessary treatment for patients with T2D, particularly as β-cells fail and glycaemic control deteriorates. However, it appears that when used, treatment with insulin may not be sufficiently intensive to achieve the targets for glycaemic control. If insulin therapy is not used effectively the negative side effects, such as weight gain and the effects of weight gain, may outweigh the minor benefits, potentially negating its use.
The present study was not sufficiently powered to investigate changes in blood lipids and therefore the minor changes that occurred in the lipid profiles were not statistically significant. The control group experienced a trend towards greater deterioration in the risk of CHD, fatal CHD and fatal cerebral vascular accident, but not in risk of cerebral vascular accident, indicating that increasing body weight does impact negatively upon overall CVD risk. The lack of significant difference can in part be explained by the strict control of the CVD risk factors which are used for UKPDS risk engine calculation. It would be expected that if a patient's blood pressure, lipids or glycaemic control exceeded the recommended target levels, additional pharmacotherapy would be instigated to counteract the rise and therefore reduce cardiovascular risk. Indeed, eight (32 %) of twenty-five patients in the control group and three (12 %) of the twenty-five patients in the intervention group had additional antihypertensive agents or lipid-lowering medications prescribed throughout the study period and all patients had increases in insulin dose to improve glycaemic control. To fully assess the effects of initiating insulin therapy and the associated weight gain no other changes should be made to pharmacotherapy, but this would be unethical.
A limitation of all studies that require participant consent is selection bias. In the present study, recruitment into the study proved to be difficult, with 59 % of subjects who would have been eligible refusing to participate. Extensive exploration of why subjects refused to take part in a study where they had a 50 % chance of receiving improved treatment was not possible. It is perhaps a reflection of the general public's lack of awareness of the complications of diabetes or perhaps a lack of self-efficacy about weight management that leads to patients not believing that time spent attending an intensive lifestyle intervention is worthwhile. It is interesting to note that while recruitment was problematic, the overall attrition rate from the intervention group was extremely small, indicating that once engaged in the process of change, patients are keen to be involved. A recent qualitative study showed that those with T2D were not aware of the progressive nature of the disease and, although fearful of starting insulin, adapted well on converting to insulin therapy(Reference Phillips24). The effect of selection bias could work in both directions; it could include patients who are actively trying to lose weight or patients who feel that they are likely to experience significant weight gain, such as those with recent weight loss as a result of glucosuria. The similar degree of weight gain of those in the control group as compared with previous retrospective studies(Reference Ash, Reeves, Yeo, Morrison, Carey and Capra19) indicates that the effect of selection bias, in this case, was minimal.
The present study shows that it is possible to prevent the negative side effect of weight gain following insulin therapy through an intensive programme of diet and lifestyle advice. With only one-quarter of the subjects referred for any dietetic advice around the time of insulin commencement, it is not surprising that the control group experienced weight gain. If an intensive lifestyle intervention were made available for patients with T2D as they start insulin therapy, targeted treatment would be necessary to ensure the best use of this limited resource to achieve optimal outcomes which are most likely to relate to attenuation of weight gain rather than the expectation of weight loss.
Acknowledgements
R. B., formerly a postgraduate student at the Faculty of Health and Medical Sciences, University of Surrey (Guildford, UK), was supported by a UK Medical Research Council PhD Scholarship. We would like to thank Dr John Wright and Jackie Patterson at the Royal Surrey County Hospital and Marie O'Connor, Debbie Hutchings, Brenda Lawrence, Jo Reed and Anne Dornhorst at the Hammersmith and Charing Cross Hospitals for their assistance with recruiting subjects. G. F. was formerly the Chief Dietitian, Hammersmith Hospital NHS Trust (London, UK). None of the authors has any conflicts of interest to declare.


