


The adipose tissue derives from different cell lines and is divided into two compartments: subcutaneous (SUB) and visceral, which present functional and morphological differences(Reference Lee, Wu and Fried1). It is essentially distinguished by white adipose tissue (WAT) and brown adipose tissue (BAT), exercising functions of energy storage and thermogenesis, respectively(Reference Sanchez-Gurmaches and Guertin2,Reference Esteve Ràfols3) . Additionally, both tissues exert an endocrine function, secreting a set of substances, such as hormones, adipokines and cytokines, which regulate energy homoeostasis, glucose, lipids and inflammation(Reference Luo and Liu4,Reference Wang, Zhao and Lin5) .
The principal difference between WAT and BAT compartments can be explained by different gene expressions and different progenitor cells(Reference Vohl, Sladek and Robitaille6). BAT’s colour stems from the density of mitochondria and rich vascularisation(Reference Cinti7), its adipocytes in response to sympathetic nervous system action and other hormones oxidise their stored lipids, to produce heat, contributing to thermogenesis(Reference Farmer8).
WAT has aroused clinical interest due to its expansion potential. The excessive accumulation of this tissue promotes the release of macrophages and the production of inflammatory cytokines, characterising the inflammatory process, observed in obesity, and determining other metabolic disorders(Reference Carobbio, Pellegrinelli and Vidal-Puig9,Reference Engin10) . Thus, the main objective of restrictive diets should be the loss of body weight accompanied by the reduction of WAT in order to promote a reduction in metabolic risks(Reference van Baak and Mariman11).
Some dietary patterns may increase adiposity, including saturated fat and refined sugar consumption(Reference Bake, Morgan and Mercer12–Reference Piaggio15). On the other hand, the high prevalence of obesity in the world has led to the practice of several dietary strategies suggested as inducing loss of body mass, which can result in physiological losses and establish a pro-obesogenic cycle in the body, with repercussions on adipogenesis(Reference Dulloo, Jacquet and Montani16). From an observational point of view, in Brazil, these practices are often developed by individuals without compromise with healthier eating practices and deal with temporary behaviours and subsequent return to consumption of palatable diets, rich in energy, fat and sugar(Reference Chapuis-de-Andrade, de Araujo and Lara17,Reference Machado, Silveira and Silveira18) .
Rapid weight loss protocols are more practised by women than by men, due to the desire to lose weight resulting from greater body dissatisfaction(Reference Leal, Philippi and Alvarenga19–Reference Kashubeck-West, Mintz and Weigold21). Intermittent food restriction (IFR), also called intermittent fasting or fasting–refeeding (RF) cycles, is a strategy that became popular with the promise of loss of body mass. It consists of total or partial food restriction for hours in the day, on alternate days or on selected days during the week, followed by periods of RF, without limiting the amount of food eaten(Reference Patterson and Sears22). The proposal meets the expectations of some individuals who seek to lose weight, but with freedom in food consumption outside the short periods of food restriction, that is, after the restriction, they return to ingesting palatable foods, establishing eating behaviour that alternates between food restriction and hyperenergetic consumption.
In humans and experimental obese rodents, IFR seems to produce positive results in the loss of body mass, as well as in the improvement of markers related to cardiometabolic diseases(Reference Seimon, Roekenes and Zibellini23,Reference Stockman, Thomas and Burke24) . These findings, however, are controversial, with evidence that IFR also has a negative effect on health, due to the increased activity of adipogenic enzymes and the consequent gain in fat mass(Reference Dorighello, Rovani and Luhman25–Reference Wronska, Lawniczak and Wierzbicki30).
Therefore, herein, we tried to represent human behaviour, in which women consume a hyperenergetic diet pattern during their youth; then in an attempt to lose weight quickly, they carry out restrictive diets, a period in which they strive to consume a healthy diet; however, they are unable to maintain this pattern of restriction and end up abandoning it, returning to the habitual consumption of a hyperenergetic diet. Considering the few investigations on the relationship of IFR on morphology and function of SUB and visceral adiposity, this study aimed to evaluate, in female rats, the effect of the alternation between periods of diet that induces obesity (DIO) and IFR in the morphological dynamics of white and brown fat deposits.
Materials and methods
Animal care and ethics
Wistar female rats were provided by our breeding facility and were housed in individual cages, under a 12 h light–12 h dark cycle with lights off at 20.00 hours, at 22 ± 1°C room temperature. The handling of rats and experimental procedures were performed according to ARRIVE guidelines, the rules of the National Council of Animal Experiments Control, and all experimentation received approval from the Institutional Animal Care and Use Committee of the Federal University of Rio de Janeiro, Campus Macaé, under reference number MAC030. The same rats were used for all experiments, following the 3Rs principle reduction.
Experimental model
Forty-five-day-old Wistar females rats (n 40, 10 per group; 153·34 (SEM 1·57) g) were randomly distributed into four groups: standard control (ST-C; n 10), DIO control (DIO-C; n 10), standard restricted (ST-R; n 10) and DIO restricted (DIO-R; n 10), during 60 d of treatment. Groups ST-C and ST-R had access to filtered water and a standard diet (Nuvilab). The DIO-C and DIO-R groups received an obesity-induced diet (DIO) during the first 15 d, as well as, the last 15 d of treatment and consumed a standard diet and filtered water ad libitum between the 16th and 45th d of treatment. ST-R and DIO-R rats were submitted to IFR between the 16th and 45th d of treatment. IFR consisted of 2 d of food restriction in which the restricted groups received 50 % of the amount of chow consumed by the ST-C group, followed by 3 d of ad libitum feeding, completing six restriction cycles for 30 d (Fig. 1 shows the representation of diet treatments and IFR of experimental groups).
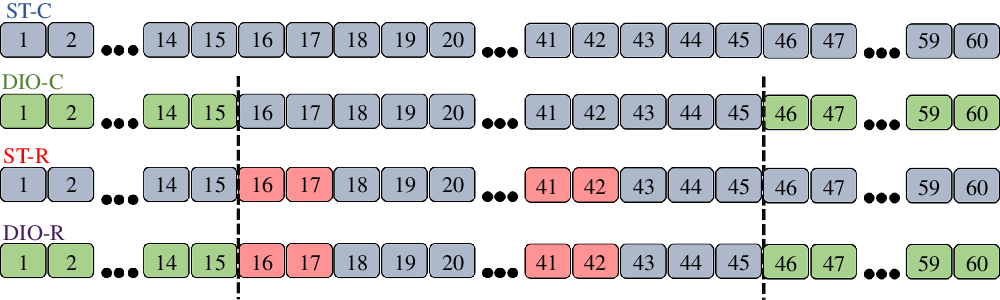
Fig. 1. Experimental design. Treatment timeline of standard control (ST-C), DIO control (DIO-C), standard restricted (ST-R), DIO restricted (DIO-R) groups. ST-C rats consumed standard chow during all experimental period. DIO-C rats consumed DIO diet in the first and last 15 d of treatment, but between the 16th and 45th day of the experimental period fed on a standard diet and filtered water ad libitum. During the first and last 15 d, ST-R and DIO-R were fed with commercial standard chow or diet-induced obesity (DIO), respectively, and were submitted to intermittent food restriction (IFR) cycles between 16th and 45th day, receiving commercial chow and filtered water. ![]() , Standard diet: ad libitum standard chow + ad libitum filtered water;
, Standard diet: ad libitum standard chow + ad libitum filtered water; ![]() , IFR: 50 % of ST-C intake + ad libitum filtered water;
, IFR: 50 % of ST-C intake + ad libitum filtered water; ![]() , DIO diet: 45 % hyperlipidic chow ad libitum + 20 % sucrose solution ad libitum.
, DIO diet: 45 % hyperlipidic chow ad libitum + 20 % sucrose solution ad libitum.
The standard diet consisted of commercial rodent chow (Nuvilab) and filtered water, both ad libitum. The chow composition was 4 % fat, 22 % protein, 42 % carbohydrates, 10 % minerals, 0·8 % P, 1 % vitamins; 8 % fibres and 12·5 % humidity, with an energy density of 12·2 kJ/g. The DIO diet consisted of high-fat chow (46 % fat of total energy) and 20 % sucrose in its drinking water, both ad libitum. The DIO diet was prepared in our laboratory and consists of 60 % of the standard chow, 2 % soya oil, 18 % lard, 13 % sugar and 7 % casein (Synth). The energy distribution was 46 % fat, 19 % protein and 35 % carbohydrates with an estimated supply of 18·2 kJ/g.
Assessment of food intake, body mass energy efficiency and visceral fat
Food and drinking water consumption and body mass were registered daily, between 08.00 and 09.00 hours, throughout the 60 d of treatment using an electronic balance (TOLEDO DO BRASIL). Body weight was assessed at the exact moment when the rat was resting on all four paws without moving for 3 s. Energy efficiency (EE) was obtained from the equation: EE = ((average body mass gain (g)/average energy consumption (kJ)) × (100)). At the end of the experimental period, after euthanasia of all rat groups, the visceral fat deposits (retroperitoneal (RET), mesenteric and gonadal) were removed and weighed and the visceral fat content (TOTAL) was estimated.
Serum biochemical analysis
After 60 d of DIO and/or IFR experimental period, all rat groups were food-deprived for 12 h and were euthanised by beheading with guillotine, between 08.00 and 10.00 hours. The blood was collected for analysis of TAG and total cholesterol using a colorimetric kit according to the manufacturer’s instructions (TAG Liquiform/total cholesterol; Analisa) and was performed with a 505 nm wavelength spectrophotometer reading (Asys Expert 96; Biochrom).
Histological analysis
At the end of the experimental period, SUB and visceral WAT (from the thigh and RET areas, respectively) and the interscapular BAT were collected on histological cassettes, remaining in phosphate buffer (formaldehyde 10 %, methane 1·5 % and PBS 88·5 %) for 48 h. Afterwards, tissues were washed under running water and kept in 70 % alcohol until analysis. Before paraffin embedding, the tissue was dehydrated in increasing concentrations of alcohol and diaphanised in xylol. The samples were cut in sections of 5 μm in thickness, using a microtome (Lupetec MRP2015), and arranged in sheets, which were immersed in xylol, followed by decreasing concentrations of alcohol for hydration. Subsequently, the WAT and BAT sections were stained with haematoxylin and eosin, and BAT was also stained with picrosirius red (Sigma-Aldrich, Diadema), and the coverslips were quickly assembled. Images from WAT and BAT sections stained with haematoxylin and eosin or picrosirius red were captured using a digital camera (Olympus DP71; Olympus Optical) coupled with an optical microscope (Olympus BX51; Olympus Optical). For each female rat (n 10 per experimental group), eight histological random fields from each haematoxylin and eosin stained section obtained from the SUB or RET WAT, and BAT were registered. All morphometric measurements were performed with the aid of the Image J software (https://imagej.nih.gov/ij/download.html). All white or brown adipocyte per field registered were manually counting. The diameter of all SUB and RET adipocytes per field registered and the areas of at least fifty brown adipocytes per field registered were measured using the ‘straight’ and ‘freehand’ tools of Image J software, respectively. The pixel number obtained in each measure was automatically converted to micrometres through software calibration with a micrometre scale slide. In addition, all lipid vacuoles per brown adipocyte measured were manually counted(Reference Li, Xie and Lu31,Reference Dankel, Degerud and Borkowski32) . For the quantification of BAT collagen deposition, the percentage area that was positive for picrosirius red staining was calculated in the BAT sections by determining the specific threshold for pink/red colour that represents stained collagen fibres, and a square was applied on this colour for recording, using Image J Software. Positive picrosirius red areas were automatically obtained through the conversion of total pixel numbers/intensities to micrometres. Data are expressed as the percentage of the positive-stained area/total tissue area examined(Reference Rojas-Rodriguez, Lifshitz and Bellve33).
Statistical analysis
The G*Power 3.1.9.2(Reference Faul, Erdfelder and Buchner34) software was used to design sample size in this study; the power analysis was carried out a priori during the design stage of the study. We calculated the sample size needed in each group to obtain a power of 0·80 and a significance level of 0·05, the effect size f was defined as 0·56 (η 2 p = 0·24) based on our previous study(Reference Rosas Fernández, Concha Vilca and Batista28) and in the literature(Reference Kim, Kim and Son35–Reference Tung, Hsu and Chien37). The sample size obtained was of ten rats per group.
For multiple comparisons, one-way ANOVA was used, followed by the Bonferroni post-test, and a significance level of P < 0·05 was adopted. The ST-C and DIO-C groups were considered controls, respectively, of the ST-R and DIO-R groups. The analyses were performed using the GraphPad Prism 6.0 Software, and the results are presented as mean values with their standard errors. The effect size was calculated using the statistical package Jamovi version 1.1.9.0 (https://www.jamovi.org/download.html). Eta-squared (η 2; small effect = 0·01, medium effect = 0·06, large effect = 0·14) and Cohen’s d (small effect = 0·2, medium effect = 0·5, large effect = 0. 8) are reported when analyses were performed by ANOVA and in post hoc tests, respectively(Reference Lakens38).
Results
Body mass behaviour
When observed per week, the difference in weight between the groups was not detected (Fig. 2(a)). No differences were observed before (PRE) and during the IFR; however, ANOVA revealed a main effect of diet in this period on the groups (P < 0·001, η 2 = 0·505). DIO-C and DIO-R groups showed significant body weight gain (1·16 (SEM 0·19) g, P = 0·0073 and 1·83 (SEM 0·18) g, P < 0·0001, respectively) than ST-C (0·63 (SEM 0·07) g). In addition, body weight gain, in the period following IFR (POS), was higher in DIO-R rats than that observed for DIO-C (P = 0·0008). In this same period, the ST-R group showed significantly less body mass gain (P < 0·0001), compared with the DIO-R group (Fig. 2(b)). The final body weight gain was significantly different among groups (P = 0·019, η 2 = 0·195). The DIO-R group showed greater final body weight gain (102·69 (SEM 4·40) g, P = 0·0254, Cohen’s d = 0·134) compared with the ST-C (87·64 (SEM 3·22) g) (Fig. 2(c)).
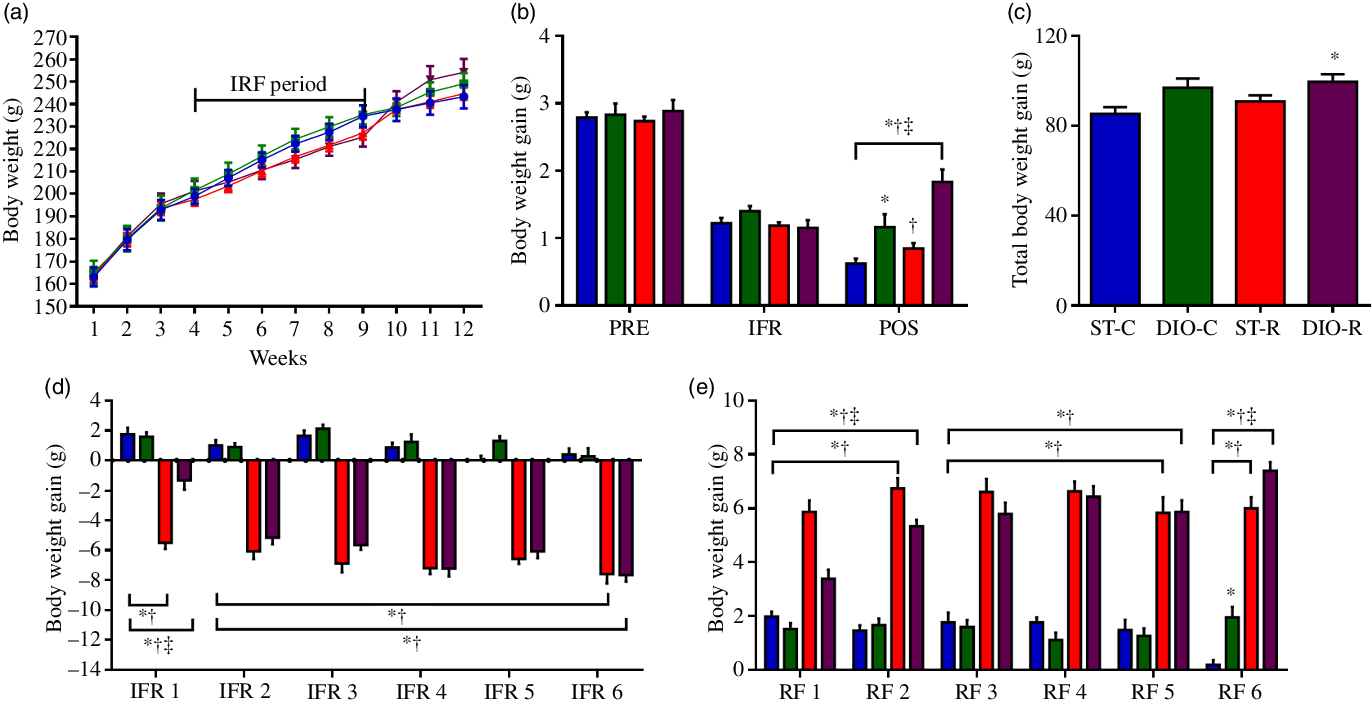
Fig. 2. Diet that induces obesity (DIO) consumption after intermittent food restriction (IFR) exacerbates body mass gain in female rats. (a) Timeline of body weight changes. ![]() , ST-C;
, ST-C; ![]() , DIO-C;
, DIO-C; ![]() , ST-R;
, ST-R; ![]() , DIO-R. (b) Body weight gain, before (PRE), during (IFR) and after (POS) IFR. (c) Total body weight gain at the end of the trial period. (d) Body weight gain on each effective restraint cycle during IFR. (e) Body weight gain in each refeeding (RF) cycle during IFR.
, DIO-R. (b) Body weight gain, before (PRE), during (IFR) and after (POS) IFR. (c) Total body weight gain at the end of the trial period. (d) Body weight gain on each effective restraint cycle during IFR. (e) Body weight gain in each refeeding (RF) cycle during IFR. ![]() , ST-C;
, ST-C; ![]() , DIO-C;
, DIO-C; ![]() , ST-R;
, ST-R; ![]() , DIO-R. Experimental groups: standard control (ST-C), DIO control (DIO-C), standard restricted (ST-R), DIO restricted (DIO-R). Values are mean values with their standard errors (n 10). Data were analysed using one-way ANOVA followed by Bonferroni post-test. P < 0·05 * v. ST-C, † v. DIO-C, ‡ v. ST-R.
, DIO-R. Experimental groups: standard control (ST-C), DIO control (DIO-C), standard restricted (ST-R), DIO restricted (DIO-R). Values are mean values with their standard errors (n 10). Data were analysed using one-way ANOVA followed by Bonferroni post-test. P < 0·05 * v. ST-C, † v. DIO-C, ‡ v. ST-R.
Throughout the six feed restriction cycles, the ST-R and DIO-R groups showed similar reductions of body mass, except in the first IFR cycle, in which DIO-R rats (−1·33 (SEM 0·59) g, P < 0·0001) displayed a minor reduction when compared with that observed for ST-R (−5·55 (SEM 0·40) g) (Fig. 2(d)). Fig. 2(e) shows the six RF cycles of the IFR period; it is possible to observe that body mass gain was significantly higher in the ST-R and DIO-R groups, compared with the ST-C in all cycles. In the first two RF cycles (RF1 and RF2), the DIO-R rats showed a lower body mass gain (RF1 3·38 (SEM 0·34) g, P < 0·0001 and RF2 5·33 (SEM 0·23) g, P = 0·0242), than the ST-R group (RF1 5·87 (SEM 0·42) g and RF2 6·74 (SEM 0·38) g). But, at RF3, RF4 and RF5, DIO-R and ST-R groups maintained a similar body mass gain; however, in the last RF cycle (RF6), a significant difference was observed among these groups (P = 0·019, η 2 = 0·195), in which the body mass gain of the DIO-R group was significantly higher (7·38 (SEM 0·33) g, P = 0·0283, Cohen’s d = 0·148) than that observed for the ST-R group (6·00 (SEM 0·42) g) (Fig. 2(e)).
Intermittent food restriction increases intake and energy efficiency
DIO-C and DIO-R rats maintained a higher energy intake than the ST-C group, before (2820·96 (SEM 106·01) kJ/g, P = 0·0015, Cohen’s d = 1·021 and 2872·81 (SEM 93·51) kJ/g, P = 0·0003, Cohen’s d = 1·074 v. 1787·59 (SEM 43·9) kJ/g) (PRE), during (3978·65 (SEM 124·21) kJ/g, P = 0·036, Cohen’s d = 0·797 and 4322·17 (SEM 260·37) kJ/g, P < 0·0001, Cohen’s d = 1·034 v. 2784·17 (SEM 61·02) kJ/g) (IFR) and after (2537·50 (SEM 109·76) kJ/g, P < 0·0001, Cohen’s d = 1·726 and 2806·70 (SEM 133·30) kJ/g, P < 0·0001, Cohen’s d = 1·978 v. 1109·47 (SEM 63·55) kJ/g) (POS) IFR. ANOVA revealed a main effect of diet on the total amount of energy consumed throughout the whole treatment (P < 0·0001, η 2 = 0·829); all groups were significantly different from ST-C, even DIO-R (10 768·00 (SEM 357·52) kJ/g, P = 0·0006, Cohen’s d = 0·722) group differed significantly from its own control (DIO-C) (8868·60 (SEM 249·25) kJ/g) (Fig. 3(a)).
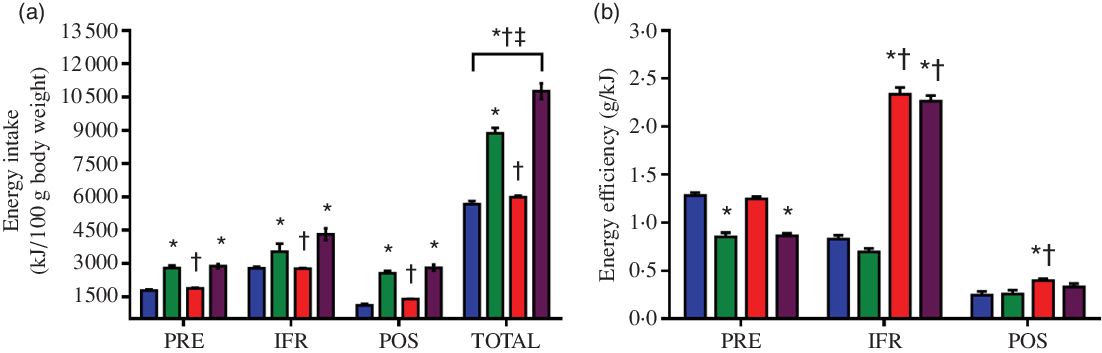
Fig. 3. Intermittent food restriction (IFR) increased energy intake and feed efficiency in female rats fed on a standard diet or diet that induces obesity (DIO). (a) Energy intake (in kJ) before (PRE), during (IFR) and after (POS) IFR and total (accumulated at the end of the experimental period). (b) Energy efficiency in the 15 d before IFR (PRE), in IFR and in the last 15 d of treatment (POS). Experimental groups: standard control (ST-C), DIO control (DIO-C), standard restricted (ST-R) and DIO restricted (DIO-R). ![]() , ST-C;
, ST-C; ![]() , DIO-C;
, DIO-C; ![]() , ST-R;
, ST-R; ![]() , DIO-R. Values are mean values with their standard errors (n 10). Data were analysed by one-way ANOVA followed by Bonferroni post-test. P < 0·05 * v. ST-C, † v. DIO-C, ‡ v. ST-R.
, DIO-R. Values are mean values with their standard errors (n 10). Data were analysed by one-way ANOVA followed by Bonferroni post-test. P < 0·05 * v. ST-C, † v. DIO-C, ‡ v. ST-R.
EE was significantly lower in the DIO-C and DIO-R groups (0·86 (SEM 0·04) g/kJ, P < 0·0001, Cohen’s d = 0·05 and 0·87 (SEM 0·03) g/kJ, P < 0·0001, Cohen’s d = 0·05 v. ST-C 1·28 (SEM 0·03) g/kJ) during the first 15 d of treatment, when these rats received a DIO. However, over the IFR period, ANOVA revealed a main effect of diet on EE (P < 0·0001, η 2 = 0·957), in which EE was significantly higher in both ST-R and DIO-R groups, regardless of diet, indicating a greater anabolic capacity of these rodents in the feeding periods (2·35 (SEM 0·06) g/kJ, P < 0·0001, Cohen’s d = 0·139 and 2·26 (SEM 0·05) g/kJ, P < 0·0001, Cohen’s d = 0·132 v. ST-C 0·83 (SEM 0·04) g/kJ). In the 15 d subsequent of IFR, only ST-R group (0·41 (SEM 0·02) g/kJ, P = 0·044, Cohen’s d = 0·014) maintained a significantly higher EE than the ST-C (0·25 (SEM 0·03) g/kJ; Fig. 3(b)).
Analysis of serum lipids
Fasted DIO-C rats exhibited significantly higher serum TAG levels than ST-C and ST-R groups (P < 0·0001, η 2 = 0·667; Table 1). The total cholesterol levels were not different between the groups (Table 1).
Table 1. Serum content of TAG and total cholesterol (TC) at the end of treatment in standard control (ST-C), DIO control (DIO-C), standard restricted (ST-R) and DIO restricted (DIO-R) female rats (n 8)‡
(Mean values with their standard errors)

‡ Data analysed using one-way ANOVA followed by Bonferroni post-test. P < 0·05 * v. ST-C, † v. DIO-C.
Increase of adipose tissue after intermittent food restriction
At the end of the treatment, ANOVA revealed a significant effect of diet on WAT depots when evaluating RET (P < 0·0001, η 2 = 0·477), mesenteric (P < 0·0001, η 2 = 0·408), gonadal (P < 0·0001, η 2 = 0·509) and total white visceral fat (P < 0·0001, η 2 = 0·529). DIO-C (2·19 (SEM 0·21) g/100 g) and DIO-R rats (2·88 (SEM 0·12) g/100 g) had a significantly higher content of gonadal fat (P < 0·0027 and P < 0·0001, respectively), than the ST-C (1·26 (SEM 0·21) g/100 g). As for the total visceral white fat, DIO-C, DIO-R and ST-R groups (4·56 (SEM 0·30) g/100 g, P < 0·0001, Cohen’s d = 0·054; 5·65 (SEM 0·30) g/100 g, P < 0·0001, Cohen’s d = 0·089 and 3·64 (SEM 0·23) g/100 g, P = 0·0110, Cohen’s d = 0·025) showed significantly higher deposits than ST-C (2·87 (SEM 0·31) g/100 g). Furthermore, DIO-R group displayed higher WAT deposits (P = 0·0006, Cohen’s d = 0·034), when compared with its respective control (DIO-C) (Fig. 4(a)).
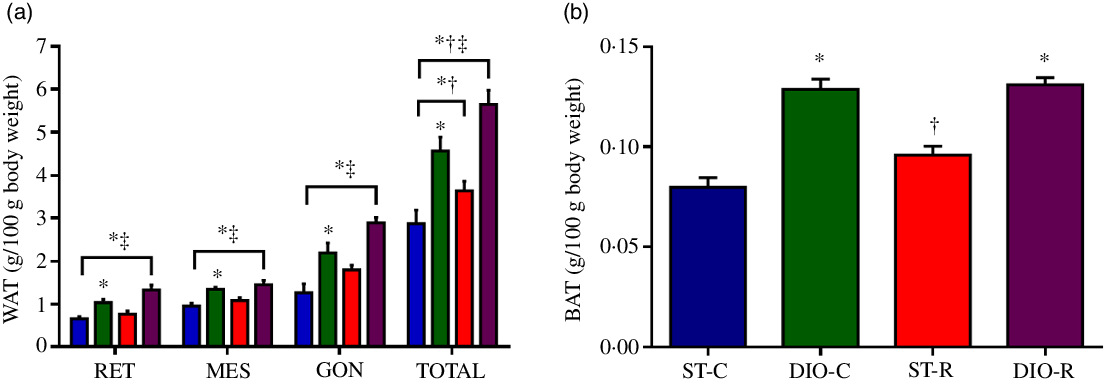
Fig. 4. Increase of adipose tissue after intermittent food restriction (IFR). (a) Mean values with their standard errors (n 10) of retroperitoneal (RET), mesenteric (MES), gonadal (GON) white fat pad weights, total white visceral fat stores (TOTAL), and in (b) interscapular brown adipose tissue weight in standard control (ST-C), DIO control (DIO-C), standard restricted (ST-R) and DIO restricted (DIO-R) female rats at the end of the experimental period. ![]() , ST-C;
, ST-C; ![]() , DIO-C;
, DIO-C; ![]() , ST-R;
, ST-R; ![]() , DIO-R. Data were analysed by one-way ANOVA followed by Bonferroni post-test. P < 0·05 * v. ST-C, † v. DIO-C, ‡ v. ST-R.
, DIO-R. Data were analysed by one-way ANOVA followed by Bonferroni post-test. P < 0·05 * v. ST-C, † v. DIO-C, ‡ v. ST-R.
The DIO diet also had a significant effect on interscapular BAT (P < 0·0001, η 2 = 0·735), since DIO-C and DIO-R (0·13 (SEM 0·005) g/100 g, P < 0·0001 and 0·13 (SEM 0·004) g/100 g, P < 0·0001) groups exhibited significantly higher BAT amounts, than that observed for ST-C rats (0·08 (SEM 0·005) g/100 g). But, in the ST-R rats, BAT deposits were significantly lower (0·0958 (SEM 0·014) g/100 g, P < 0·0001), when compared with the DIO-R group (Fig. 4(b)).
Hyperplasia and hypertrophy of white subcutaneous adipose tissue after intermittent food restriction
The treatment showed significant differences on the size (P < 0·0001, η 2 = 0·427) and number (P < 0·0001, η 2 = 0·854) of the SUB white adipocytes among the groups. Adipocyte hypertrophy in SUB WAT was observed in all groups, when compared with ST-C rats (DIO-C 47·39 (SEM 0·90) µm, P < 0·0001; ST-R 48·88 (SEM 1·68) µm, P < 0·0001, and DIO-R 67·55 (SEM 0·70) µm, P < 0·0001 v. ST-C 36·82 (SEM 0·60) µm). But, DIO-R rats displayed higher hypertrophic adipocytes in SUB WAT (P < 0·0001), when compared with DIO-C (Fig. 5(b)). Also, adipocyte hyperplasia was observed in the SUB WAT of DIO-R (104·00 (SEM 3·75)) and ST-R groups (32·18 (SEM 3·44)), when compared with their controls (P < 0·0001, Cohen’s d = 0·544). Notably, adipocyte hyperplasia in this WAT store was 223 % higher in DIO-R rats, when compared with the ST-R group (P < 0·0001, Cohen’s d = 0·629; Fig. 5(c)).
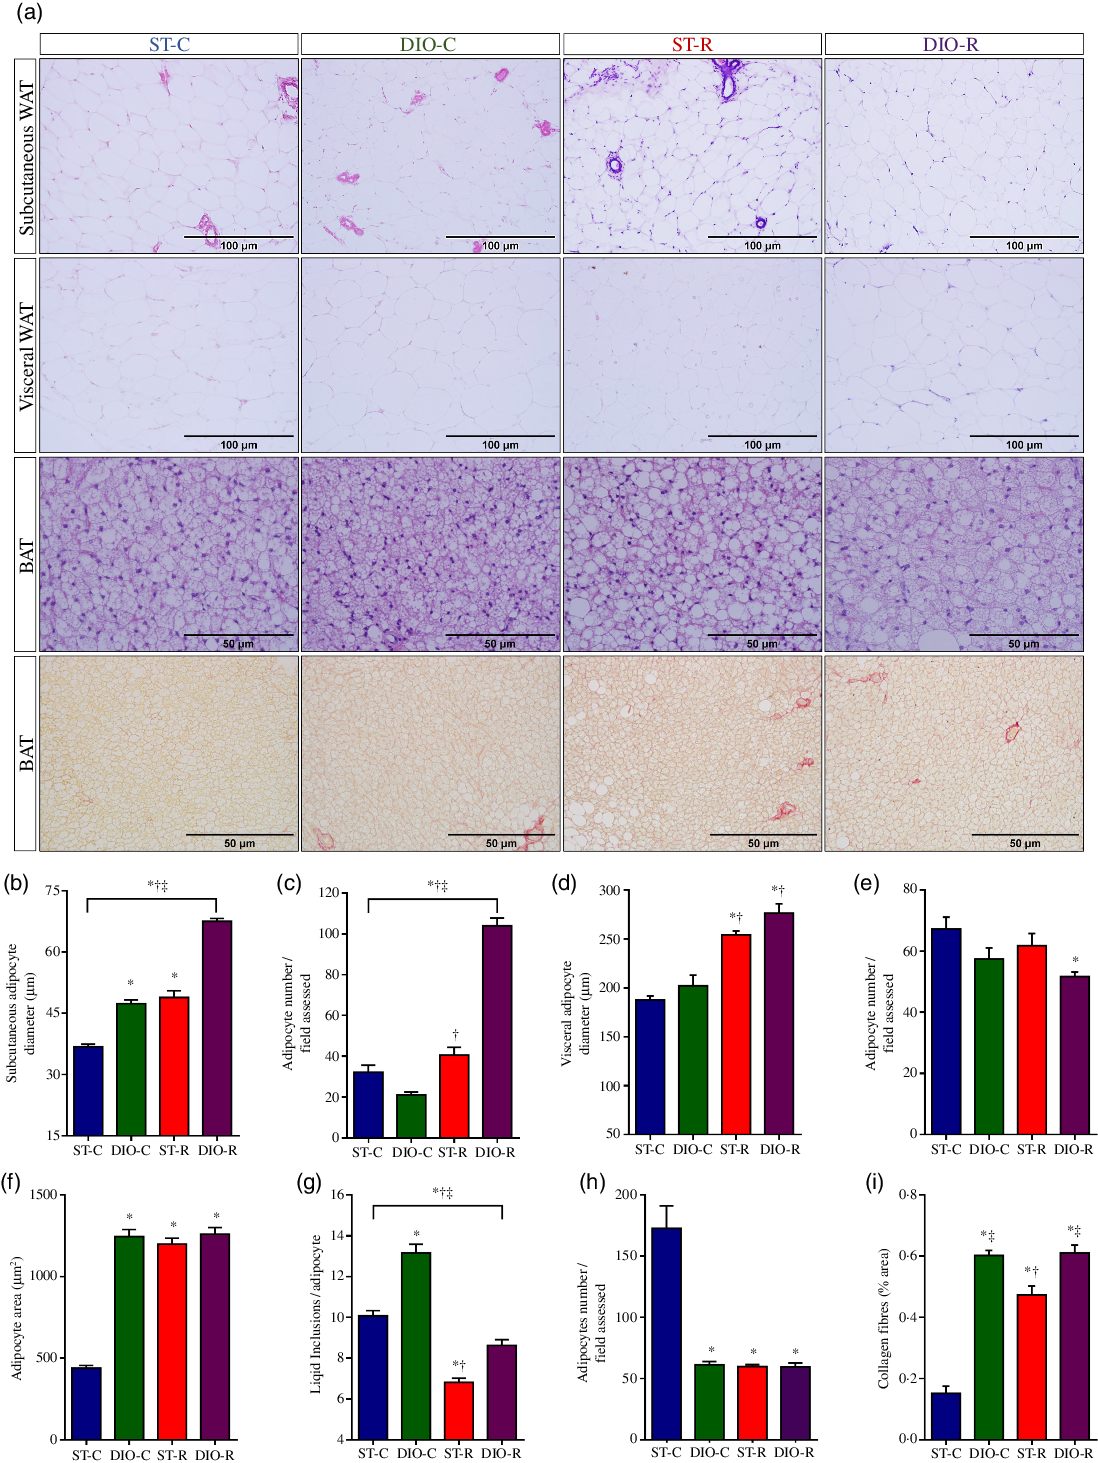
Fig. 5. Morphological alterations of white adipose tissue (WAT) and brown adipose tissue (BAT). (a) Representative images of histological sections (5 μm in thickness) of subcutaneous (thigh region) and visceral (retroperitoneal) WAT (scale bars 100 μm), and interscapular BAT (scale bars 50 μm) stained with haematoxylin and eosin. The lower panel shows representative histological sections of the intrascapular BAT stained with picrosirius red, for collagen deposition measurement in BAT of standard control (ST-C), DIO control (DIO-C), standard restricted (ST-R) and DIO restricted (DIO-R) female rats. Mean values with their standard errors (n 10) of diameter or number of white adipocytes from subcutaneous (b and c, respectively) or visceral fat pads (d and e, respectively), and the areas and number of brown adipocyte (f and g) and the number of lipid inclusions per brown adipocyte (h). Percentage of the picrosirius-positive area in BAT (i) of ST-C, DIO-C, ST-R and DIO-R female rats. Data were analysed by one-way ANOVA followed by Bonferroni post-test. P < 0·05 * v. ST-C, † v. DIO-C, ‡ v. ST-R.
Visceral adipose tissue hypoplasia and hypertrophy after intermittent food restriction
At the end of the treatment, significant differences on the size (P < 0·0001, η 2 = 0·543) and number (P < 0·0001, η 2 = 0·121) of adipocytes from the visceral WAT were observed between the groups. ST-R (254·12 (SEM 3·94) µm, P < 0·0001, Cohen’s d = 0·29) and DIO-R groups (276·23 (SEM 9·83) µm, P < 0·0001, Cohen’s d = 0·36) showed adipocyte hypertrophy (P < 0·0001, Cohen’s d = 0·30), when compared with the ST-C (187·59 (SEM 4·14) µm) and DIO-C rats (202·17 (SEM 10·88) µm), respectively (Fig. 5(d)). Hypoplasia was observed only in DIO-R rats (51·71 (SEM 1·45), P = 0·0133), when compared with ST-C (67·22 (SEM 3·86)) (Fig. 5(e)).
Intermittent food restriction induces hypertrophy and fibrosis of brown adipose tissue
ANOVA revealed a significant effect of diet on the adipocytes size (P < 0·0001, η 2 = 0·616), lipid inclusions per field analysed (P < 0·0001, η 2 = 0·346) and adipocytes number (P < 0·0001, η 2 = 0·671) of BAT among the groups. BAT histology showed hypertrophy in all groups compared with ST-C (DIO-C 1244·82 (SEM 43·73) µm, P < 0·0001; ST-R 1198·29 (SEM 36·64) µm, P < 0·0001 and DIO-R 1259·65 (SEM 40·48) µm, P < 0·0001 v. ST-C 440·01 (SEM 17·69) µm; Fig. 5(f)). On the other hand, the number of lipid inclusions per brown adipocyte was significantly lower in ST-R (6·83 (SEM 0·20), P < 0·0001) and DIO-R rats (8·63 (SEM 0·29), P = 0·0007), when compared with the ST-C (10·06 (SEM 0·25)). But, DIO-C rats (13·16 (SEM 0·42), P < 0·0001) exhibited higher number of lipid inclusions per brown adipocyte (Fig. 5(g)). All groups showed BAT hypoplasia (DIO-C 61·36 (SEM 2·57), P < 0·0001; ST-R 59·86 (SEM 1·63), P < 0·0001 and DIO-R 59·56 (SEM 3·12), P < 0·0001; respectively), when compared with ST-C (172·79 (SEM 18·39); Fig. 5(h)).
The percentage of positive-picrosirius area that indicates collagen fibres deposition in BAT of all rat groups can be observed in Fig. 5(a) and (i). Both, DIO diet and IFR increased BAT fibrosis (P < 0·0001, η 2 = 0·655) in DIO-C (0·60 (SEM 0·02) %, P < 0·0001) or in ST-R (0·47 (SEM 0·03) %, P < 0·0001) and DIO-R rats (0·61 (SEM 0·03) %, P < 0·0001), when compared with ST-C (0·15 (SEM 0·02) %). Notably, collagen deposition in BAT of DIO-C and DIO-R groups was higher than that observed in ST-R (Fig. 5(i)).
Discussion
Here, for the first time, we demonstrated that obesity-inducing diet (DIO) consumption, rich in saturated fat and refined sugar, after an IFR period (IFR), characterising popular cyclical behaviour to get rapid loss of body mass, promoted hyperplasia and hypertrophy of SUB WAT in female rats, as well as brown adipocyte hyperplasia and fibrosis. These adiposity changes appear to be linked to a compensatory increase in energy intake and feed efficiency as a result of periods of IFR. Highlighting that at the contrary of which is expected with the reduction of food intake, herein we observed that IFR did not promote the effective reduction of body mass, and when DIO was provided in rats submitted to IFR, a higher body mass gain and adiposity were induced in DIO-R group, suggesting that IFR changes lipid metabolism at least in adipocytes, causing an economic phenotype which exacerbates body fat storage.
Rodents treated with DIO and submitted to IFR (DIO-R group) showed higher body mass gain at the end of the treatment, which may be due to the fact that in the last 15 d of treatment, a period in which the groups received DIO again (groups DIO-C and DIO-R), there was an increase in weight gain, compared with the corresponding controls (groups ST-C and ST-R). Despite this mass gain, the circulating levels of TAG and total cholesterol were not affected by IFR. These findings indicate that the performance of IFR resulted in damage to the DIO-R group, which was able to compensate for the loss of body mass, throughout the RF cycles, ending the treatment with body mass higher than the ST-C group. Additionally, food restriction, which occurred after the consumption of DIO, resulted in excessive energy consumption. Studies carried out in both experimental rodents and humans consider IFR to be an efficient strategy for a loss of body mass and improvement in the markers of metabolic diseases(Reference Cho, Hong and Kim39,Reference Harvie and Howell40) . In the present study, the absence of differences in body mass between the ST-R and DIO-R groups, at the end of the treatment, can be partly explained by the energy compensation in the RF periods, which may lead to greater mass regain in the long term.
The consumption of DIO during the first 15 d of treatment reduced EE. In this sense, it was shown that rats fed exclusively with foods rich in saturated fat showed less EE, increasing the oxidation of fatty acids, in order to disadvantage the accumulation of lipids(Reference So, Gaidhu and Maghdoori41). Here, during the IFR period, ST-R and DIO-R rats tripled the EE compared with their respective controls, demonstrating the body’s effectiveness in recovering the loss of body mass during the IFR periods, a fact that justifies the absence of difference in the final body mass between the groups. However, in the last 15 d of treatment, the ST-R group was the most affected by IFR, since even returning to ad libitum consumption of a standard diet, it maintained high EE. As for DIO-R rats, the difference was not significant, but it seems to remain greater during this period. Similarly, but in male mice, Dankel et al. (Reference Dankel, Degerud and Borkowski32) also observed an increase in body mass gain and EE in animals that intercalated IFR with a hyperenergetic diet, resulting in greater recruitment of adipocytes in epididymal WAT.
The improvement in EE may also explain the increase in the total white visceral fat deposits of the ST-R and DIO-R rats in relation to their respective controls, allowing greater energy storage in the WAT. In addition, increased deposits of interscapular BAT were identified in the DIO-C and DIO-R groups, indicating that the obesogenic diet negatively affects BAT. The high energy consumption results in higher TAG storage in the visceral and SUB WAT; however, with the maintenance of this dietary pattern, there is a storage of fatty acids in other tissues, characterising ectopic fat(Reference Engin10). It is recognised that through excessive consumption of fatty acids, WAT adipocytes suffer from hyperplasia and hypertrophy; however, this growth is limited(Reference Carobbio, Pellegrinelli and Vidal-Puig9). Thus, despite is not addressed in our study, it is possible that the IFR protocol performed here could also increase fat storage ectopically, which will be considered in future investigations.
Changes in the morphology of SUB WAT of DIO-R rats demonstrated that IFR aggravated the increase in adiposity induced by DIO. The growth dynamics of the tissue was impaired by both hypertrophy and hyperplasia of the cells. These findings diverge from other studies carried out with male mice, which indicated that IFR improves the damage caused by the consumption of an obesogenic diet. A decrease in inguinal and epididymal tissue has been demonstrated due to the transdifferentiation process of white adipocytes, known as browning. This process leads to increased expression of uncoupling protein 1(Reference Li, Xie and Lu31,Reference Kim, Kim and Son35) , which increases thermogenesis in the tissues that store energy and reduces the overload in BAT(Reference Kuipers, Held and In Het Panhuis42). However, in our study, ST-R and DIO-R rats showed hypertrophy in visceral WAT, whereas hypoplasia was observed only in DIO-R, which could be the cause of lipolysis of this tissue due to IFR treatment. Studies using experimental rodents and in humans have shown that sex can determine differences in the energy storage, so that in females there is greater hypertrophy and hyperplasia of SUB WAT compared with visceral, as a way of protecting against insulin resistance(Reference Amengual-Cladera, Lladó and Proenza36,Reference Lee and Fried43) . The difference in fat deposition is mainly due to hormonal differences, such as the oestrogen that favours lipolysis; hormone receptors of the β type present in greater quantity in the abdominal area or of the α type in greater proportion in the gluteus femoral area; enzyme concentrations and increased insulin sensitivity in females(Reference Vella and Kravitz44).
Obesity establishes a profile of adipose tissue hyperplasia, mainly to protect the body from damage caused by the circulation of high amounts of NEFA. When the adipose tissue loses its expansion capacity, becoming more lipolytic, thus, the lipotoxicity process begins, with consequent ectopic adipogenesis(Reference Broetto and Brito45,Reference Silva, Caetano and Alvim46) . Okuno et al. (Reference Okuno, Fukuhara and Hashimoto47) showed that adipose tissue presents healthy expansion, featuring protective properties, and that oxidative stress inhibits this expansion, modifying the tissue architecture and exacerbating inflammation. Studies showed that prolonged IFR caused increased stress and elevated serum corticosterone concentration in rats(Reference Lenglos, Mitra and Guèvremont48), as well as increased net ROS production, leading to oxidative imbalance(Reference Munhoz, Vilas-Boas and Panveloski-Costa49). In our study, although the content of reactive oxygen and corticosterone species was not assessed, hypertrophy was identified in BAT and WAT, as well as fibrosis in BAT, which could be resulted from the increase in the number of reactive oxygen species.
We also verified hypertrophy of BAT in DIO rats, which may constitute a physiological response aimed at minimising the damage caused by the diet. It was described that palatable diets cause an increase in thermogenesis in BAT, as a mechanism to dissipate excess energy in the form of heat(Reference Ohtomo, Ino and Miyashita50). Kuipers et al. (Reference Kuipers, Held and In Het Panhuis42) showed that 1 d of exposure to a high-fat diet may be enough to promote the first signs of BAT bleaching. In fact, we verified that the BAT of the DIO-C and DIO-R groups presented hypoplasia, while the restricted groups (ST-R and DIO-R) lost the multilocularity characteristic of this tissue. The presence of small lipid vacuoles in BAT increases the area of contact with the lipase, promoting effective lipolysis and consequent thermogenesis(Reference Nishimoto and Tamori51). Therefore, the decrease in multilocularity, which was an effect evidenced in both ST-R and DIO-R rats, is an important indicative of loss of the main function of BAT in these rodents, leading the BAT to storage than dissipate energy as heat.
In addition, intense thermogenesis in BAT also causes tissue injury through the depletion of the mitochondrial complex, leading to loss of main function and tissue atrophy(Reference Bajzer, Haas and Obici52). In our study, DIO-C as well as restricted groups (ST-R and DIO-R) exhibited BAT fibrosis, indicative of BAT impaired function. The expansion of WAT causes hypoxia, leading to increased expression of hypoxia-inducible factor 1-alpha, stimulating changes in the extracellular structure, and fibrillar collagen deposition in the tissue(Reference Halberg, Khan and Trujillo53).
Both hypertrophy in SUB and visceral WAT as well as hypertrophy, hypoplasia and decreased lipid inclusions in BAT observed in the ST-R and DIO-R groups can result from the frequency of restriction cycles. It has been shown that in humans, the 24-h fast increases lipolysis and fatty acid re-esterification by 2·8 and 2·5 times, respectively(Reference Carlson, Snead and Campbell54,Reference Salgin, Marcovecchio and Humphreys55) . Repeated restraint and RF cycles lead to an increase in lipolysis during the fasting period, an increase in circulating fatty acids and re-esterification, generating an increase in abdominal and hepatic fat deposits(Reference Dorighello, Rovani and Luhman25,Reference Cerqueira, da Cunha and Caldeira da Silva56) . Thus, the increase in EE and compensatory energy consumption in rats may have concomitantly promoted the increase in WAT and BAT.
In summary, IFR, when associated with DIO, results in synergistic effects, favouring long-term gain in body mass, with increased deposits of total visceral fat and BAT content, as well as promoting hypertrophy in WAT and BAT. These results indicate that IFR, in female rats, in this experimental design that tried to mimic the human eating behaviour, in the pursuit of weight loss, does not favour effective prolonged body mass loss, since it induces greater energy consumption, increased EE and adiposity effects aggravated by alternating periods of consumption of DIO and IFR.
Acknowledgements
The authors would like to thank Magnus Lundblad, native Swedish, English-Portuguese teacher, for his help in manuscript English translation.
This work was supported by the Graduate Student Agreement Program – PEC-PG – by CAPES/CNPq/MRE – Brazil.
Conception and design of the study: M. R. F., C. C. V. and K. T. A.; supervision of post-graduate activities: L. O. B., M. G. T. C. and K. T. A.; histological analysis: M. R. F., L. S. F. and R. A. R.; generation, collection and assembly of data: M. R. F. and C. C. V.; statistical analysis, interpretation data and manuscript: M. R. F., C. C. V. and K. T. A. All authors have read and approved the final manuscript.
The authors declare that there are no conflicts of interest.


