


Examining dietary patterns, rather than individual foods, provides a more accurate account of dietary intake(Reference Hu1,Reference Ritchie, Woodward-Lopez and Gerstein2) . The study of dietary patterns facilitates the study of the whole diet, examining the interactive effect of individual nutrients, interactions often not detected in isolated analyses of nutrients(Reference Hu1). The increasing prevalence of overweight, low levels of fitness and elevated blood pressure (BP) in Irish children is a growing health concern(3) and there is strong evidence to suggest that ‘unhealthy’ dietary patterns are associated with CVD risk factors(Reference Rocha, Milagres and Longo4,Reference Funtikova, Benítez-Arciniega and Fitó5) . Since dietary habits established in childhood are known to track into later life(Reference Mikkilä, Räsänen and Raitakari6), the early establishment of healthy dietary patterns is important for reducing future cardiometabolic risk(Reference Ambrosini, Huang and Mori7).
Several international studies have examined dietary patterns in children(Reference Mikkilä, Räsänen and Raitakari6,Reference North and Emmett8–Reference Gubbels, Kremers and Goldbohm12) , describing children’s diets as ‘healthy/health conscious’(Reference Mikkilä, Räsänen and Raitakari6,Reference Northstone, Smith and Newby10,Reference Craig, McNeill and Macdiarmid11) as well as ‘traditional’(Reference Mikkilä, Räsänen and Raitakari6,Reference Northstone, Smith and Newby10,Reference Craig, McNeill and Macdiarmid11,Reference Shin, Oh and Park13) . While a small number of studies have identified dietary patterns in Irish children(Reference O’Brien, Feeney and Scannell14,Reference Walton, McNulty and Nugent15) , none have examined their relationship with health markers, particularly over time. O’Brien et al. (Reference O’Brien, Feeney and Scannell14) derived two clusters, ‘more healthful’ (higher intake of fruits and vegetables, rice, pasta, starches and grains, wholemeal bread and products, breakfast cereals, low-fat milk, fish and fresh poultry) and ‘less healthful’ (higher intake of white bread and products, butters and spreads, chips and processed potato products, processed red meats, sugars and confectioneries and high-energy beverages). Walton et al.(Reference Walton, McNulty and Nugent15) explored dietary patterns in relation to change in dietary energy density with age and found that children moved from a less energy-dense diet in pre-school to a more energy-dense diet (consuming less fruit and vegetables, and more fat, confectionery, snacks and sugar-sweetened beverages) as they got older.
Identifying dietary patterns and their association with markers of health may provide a better prediction of diet–disease relationships(Reference Slattery16). Shang et al. (Reference Shang, Li and Liu17) found that children with ‘healthy’ dietary patterns (high in fruits, vegetables and white meat) had a lower prevalence of obesity, and Smith et al. (Reference Smith, Emmett and Newby18) established that a ‘Health Aware’ dietary pattern (high in fibre, fruit and vegetables) was linked with decreased fat mass gain in girls aged 9–11 years. However, evidence is not yet conclusive, as Saeedi et al. (Reference Saeedi19) found no significant associations between dietary patterns and markers of CVD, including cardiorespiratory fitness, hand grip strength, fat mass index and arterial stiffness in their study of New Zealand children aged 9–11 years.
There is evidence that school-based obesity prevention interventions have some success in improving dietary intake by increasing fruit and vegetable consumption(Reference Anderson, Porteous and Foster20–Reference Te Velde, Brug and Wind23) and reducing fat intake(Reference Luepker, Perry and McKinlay24,Reference Caballero, Clay and Davis25) . An example of one such intervention in Ireland, Project Spraoi(Reference Coppinger, Lacey and O’Neill26), has shown success in increasing fibre and protein intake in children, while also improving nutritional knowledge, waist-to-height ratio (WHtR) and BP(Reference Merrotsy, McCarthy and Flack27). Yet, to date, no Irish study has examined differences in nutritional knowledge and markers of health with respect to dietary patterns or investigated the effect of a school-based obesity prevention intervention on overall dietary patterns in children.
The present study aims to identify dietary patterns in 6- and 10-year-old primary schoolchildren from Cork, Ireland, attending one intervention school and to examine any associations they may have with nutritional knowledge, cardiorespiratory fitness, BP, BMI and WHtR over a 2-year period. The ability of the Project Spraoi (http://www.isrctn.com/ISRCTN92611015) intervention to change dietary patterns over time will also be examined.
Methods
Study design and subject participation
Project Spraoi (http://www.cit.ie/projectspraoi) is a primary school health promotion intervention that aims to promote physical activity (PA), improve dietary intake and increase nutritional knowledge of Irish schoolchildren and has been described in detail elsewhere(Reference Coppinger, Lacey and O’Neill26,Reference Merrotsy, McCarthy and Flack27) . Briefly, 20-min targeted nutrition and PA classes that included healthy lunch box ideas, healthy food-tasting sessions and education sessions on sugary beverages, takeaways, healthy breakfasts and food groups as well as ‘huff and puff’ games and other PA-centred activities were delivered by an ‘Energizer’ from October 2014 to June 2016. Two schools from Cork were selected via convenience sampling to participate and gain an initial insight into dietary patterns. The design of the present study was exploratory, to inform the direction of a larger study. Inclusion criteria for schools included mixed sex, middle/high socio-economic status, urban/rural, medium sized, proximity of 20 km to the research institute, willingness to implement the ‘Project Spraoi’ intervention and not currently participating in another PA and/or healthy eating intervention in their school. All students from the intervention school (n 274) received the PA and nutrition intervention; children in the control school (n 567) did not receive any of the intervention components. The evaluation of dietary intake, nutritional knowledge, BP, anthropometric and cardiorespiratory fitness measurements were carried out on 6- and 10-year-old children only.
A total of eighty-eight children (6-year-olds, n 39; males = 22, females = 17; 10-year-olds, n 49; male = 23, females = 26) participated. The mean age was 5·9 (sd 0·6) years for 6-year-olds and 9·8 (sd 0·5) years for 10-year-olds. Data were collected over 4 d (two weekdays and two weekend days) at two time points (baseline, October 2014 and post-intervention, June 2016) by trained postgraduate researchers and staff of Cork Institute of Technology (Cork, Ireland). By the end of the study, following the 2-year intervention, the 6-year-olds were aged 8 and the 10-year-olds were aged 12 years. The same children were assessed at baseline and post-intervention; non-response rate for completed food diaries increased from 25 % (n 25) at baseline to 36 % (n 36) post-intervention. Informed consent and parental consent were required from all children and their parents/guardians before participation. Ethical approval was obtained from Cork Institute of Technology Research Ethics Committee in September 2013.
Dietary analysis
Dietary intake was examined using a 4-d estimated food diary (two weekdays and two weekend days), a validated measure in children(Reference Yang, Kim and Hwang28). The diary was adapted from the Cork Children’s Lifestyle Study (CCLaS) 3-d food diary(Reference Keane, Kearney and Perry29). Written instructions to complete the food diary, including food photographs from the Young Person’s Food Atlas Primary(Reference Foster, Hawkins and Adamson30) to aid portion size estimation, were provided at the beginning of the food diary. The researcher also provided verbal instruction to participants in the classroom on each day of diary completion. Each day of the food diary was broken into six meal sections: breakfast, morning snack, lunch, afternoon snack, dinner and evening snack. Parents of the 6-year-old children were asked to complete the food diary for their child (with the child also present), while the 10-year-old children were advised to seek help with the completion of their diaries from parents/guardian and teachers. The Irish Food Portion Sizes Database(Reference Lyons and Giltinan31) was used to assign an age-appropriate median portion size, where no estimation was given and also to estimate the number of unhealthy snacks (sweets, crisps, chocolate, ice cream, cake, biscuits, bars and pastries) consumed.
All foods and beverages were entered into the Dietplan 7 (Forestfield Software Ltd, 2015) software package. Output measures included fruit and vegetable intake, number of unhealthy snacks per day and macro- (protein, fat, saturated fat and carbohydrate) and micro- (Na, Ca and Fe) nutrient intake.
Nutrition knowledge questionnaire
Participant’s knowledge of healthy eating was assessed using the validated questionnaire ‘Fit Kids “r” Healthy Kids’(Reference Gower, Laurie and Moyer-Mileur32). It was first piloted by the researcher in a primary school in Cork (n 23) to ensure its relevance in an Irish setting and the Irish food pyramid(33) replaced the United States Department of Agriculture (USDA) food pyramid(34) used in the original questionnaire. Fifteen multiple-choice questions assessed knowledge on food groups, healthful foods and food functions.
Anthropometric and blood pressure measurements
Height, body mass, BP, heart rate and waist circumference were measured by trained researchers using standard procedures(Reference Graham, Appleton and Rush35). Height and body mass values were used to derive BMI and BMI Z scores(Reference Cole, Freeman and Preece36,Reference Cole and Lobstein37) . Waist circumference and height measurements were used to calculate WHtR and children were classified into two categories (WHtR < 0·50 and WHtR ≥ 0·50), where a WHtR greater than or equal to 0·50 was considered to be an indicator of central obesity(Reference Ashwell38).
Cardiorespiratory fitness
A validated 550-m walk/run test(Reference Albon, Hamlin and Ross39,Reference Hamlin, Fraser and Lizamore40) was used to measure cardiorespiratory fitness. The run was performed outside on grass, where a 110-m rope was arranged in an oval shape. Children were instructed to run/walk as fast as they could for the five laps of the test. Completion time was recorded using a stopwatch to the nearest minute and second. Run scores were then classified into fast (≤50th centile) and slow (>50th centile) categories based on the Waikato 2011 centile charts for time to complete 550 m(Reference Rush and Obolonkin41).
Dietary patterns
Dietary patterns can be derived using two common approaches: a priori and a posteriori. A priori methods assess diet based on prior knowledge and scientific evidence(Reference Ocké42), while a posteriori methods use statistical approaches to provide information about existing dietary patterns within the population(Reference Ocké42). Cluster analysis is one of the most commonly used methods for deriving dietary patterns, which combines individuals into non-overlapping groups based on similarity of dietary intakes(Reference Moeller, Reedy and Millen43,Reference Newby and Tucker44) . Cluster analysis also provides a simple way of examining changes in dietary patterns over time(Reference Northstone, Smith and Newby10) and allows for the identification of dietary patterns without any pre-defined criteria(Reference Pérez-Rodrigo, Gil and González-Gross45). Cluster analysis, in comparison with the a priori approach, has previously been used to identify relationships between dietary patterns and central obesity(Reference Wadolowska, Kowalkowska and Czarnocinska46) and was thus the method of choice for this research. Dietary patterns were determined using k-means cluster analysis(Reference Newby and Tucker44). Fibre, Na, Ca, Fe, portions of fruit, portions of vegetables, number of unhealthy snacks, fat percentage, carbohydrate percentage, protein percentage, sugar percentage, starch percentage and saturated fat percentage were selected as cluster variables. Energy was adjusted prior to analysis, and all macronutrients were expressed as a percentage of total energy consumed(Reference Coppinger, Lacey and O’Neill26).
Statistical analysis
Data were analysed using IBM SPSS (version 22.0 for Windows). Children absent from school on the day of testing were recorded as missing values (n 15) and excluded from the analysis. A k-means cluster analysis derived two dietary patterns for each age group. Variables were standardised prior to the k-means cluster analysis being performed and analyses were run for 2–4 clusters. The k-means algorithm converged after three and four iterations for 6-year-olds and seven and three iterations for 10-year-olds. The best cluster solution was chosen based on the size of the clusters. ANOVA was then used to explore the differences in nutritional knowledge, BP, BMI, WHtR and cardiorespiratory fitness with respect to dietary patterns. Changes in dietary patterns over the 2-year period were analysed with χ 2 analyses.
A multivariate ANOVA was conducted to explore differences in results of BMI, WHtR, BP, cardiorespiratory fitness and nutritional knowledge from baseline to post-intervention with respect to dietary patterns and treatment groups (intervention or control). The results are complemented by corresponding measures of effect sizes (standardised mean difference) using the partial eta-squared (η 2) classification (small 0·01 ≤ η² < 0·06; medium 0·06 ≤ η² < 0·14; large η² ≥ 0·14)(Reference Cohen47) and observed power. Shapiro–Wilk test, Box’s test and Levene’s test were used as criteria for satisfying the assumptions of measurements being normally distributed, covariance and homogeneity of variances, respectively. All statistical testing was performed using a 5 % level of significance.
Results
Baseline anthropometric and dietary intake data
Descriptive statistics of baseline data has previously been reported(Reference Merrotsy, McCarthy and Flack27) and revealed that 84·2 % of children were normal weight, 10·9 % were overweight, 4 % were obese and 1 % were underweight. A total of 69 % of 6-year-old children had normal BP, 18 % had high-normal and 12 % had high BP, respectively, whereas 56·9 % of 10-year-olds had normal BP, 27·5 % had high-normal and 15·7 % had high BP. Intakes of Ca, Fe and fibre were below recommended levels and Na and saturated fat intakes were higher than recommended(Reference Merrotsy, McCarthy and Flack27). As previous research(Reference Merrotsy, McCarthy and Flack27) found no statistical differences between sexes, results for boys only and girls only were not included in this manuscript’s statistical inference.
Baseline dietary patterns and differences
K-means clustering derived clusters based on the selected cluster variables. Due to the small sample size, the two-cluster solution was found to give the best fit. At baseline, these clusters for 6-year-olds were labelled as: (1) unhealthy (n 19) and (2) nutrient-dense (n 12) (see Fig. 1). Fig. 2 shows dietary patterns at baseline for 10-year-olds, which were labelled as: (1) processed (n 22) and (2) Western diet (n 19).
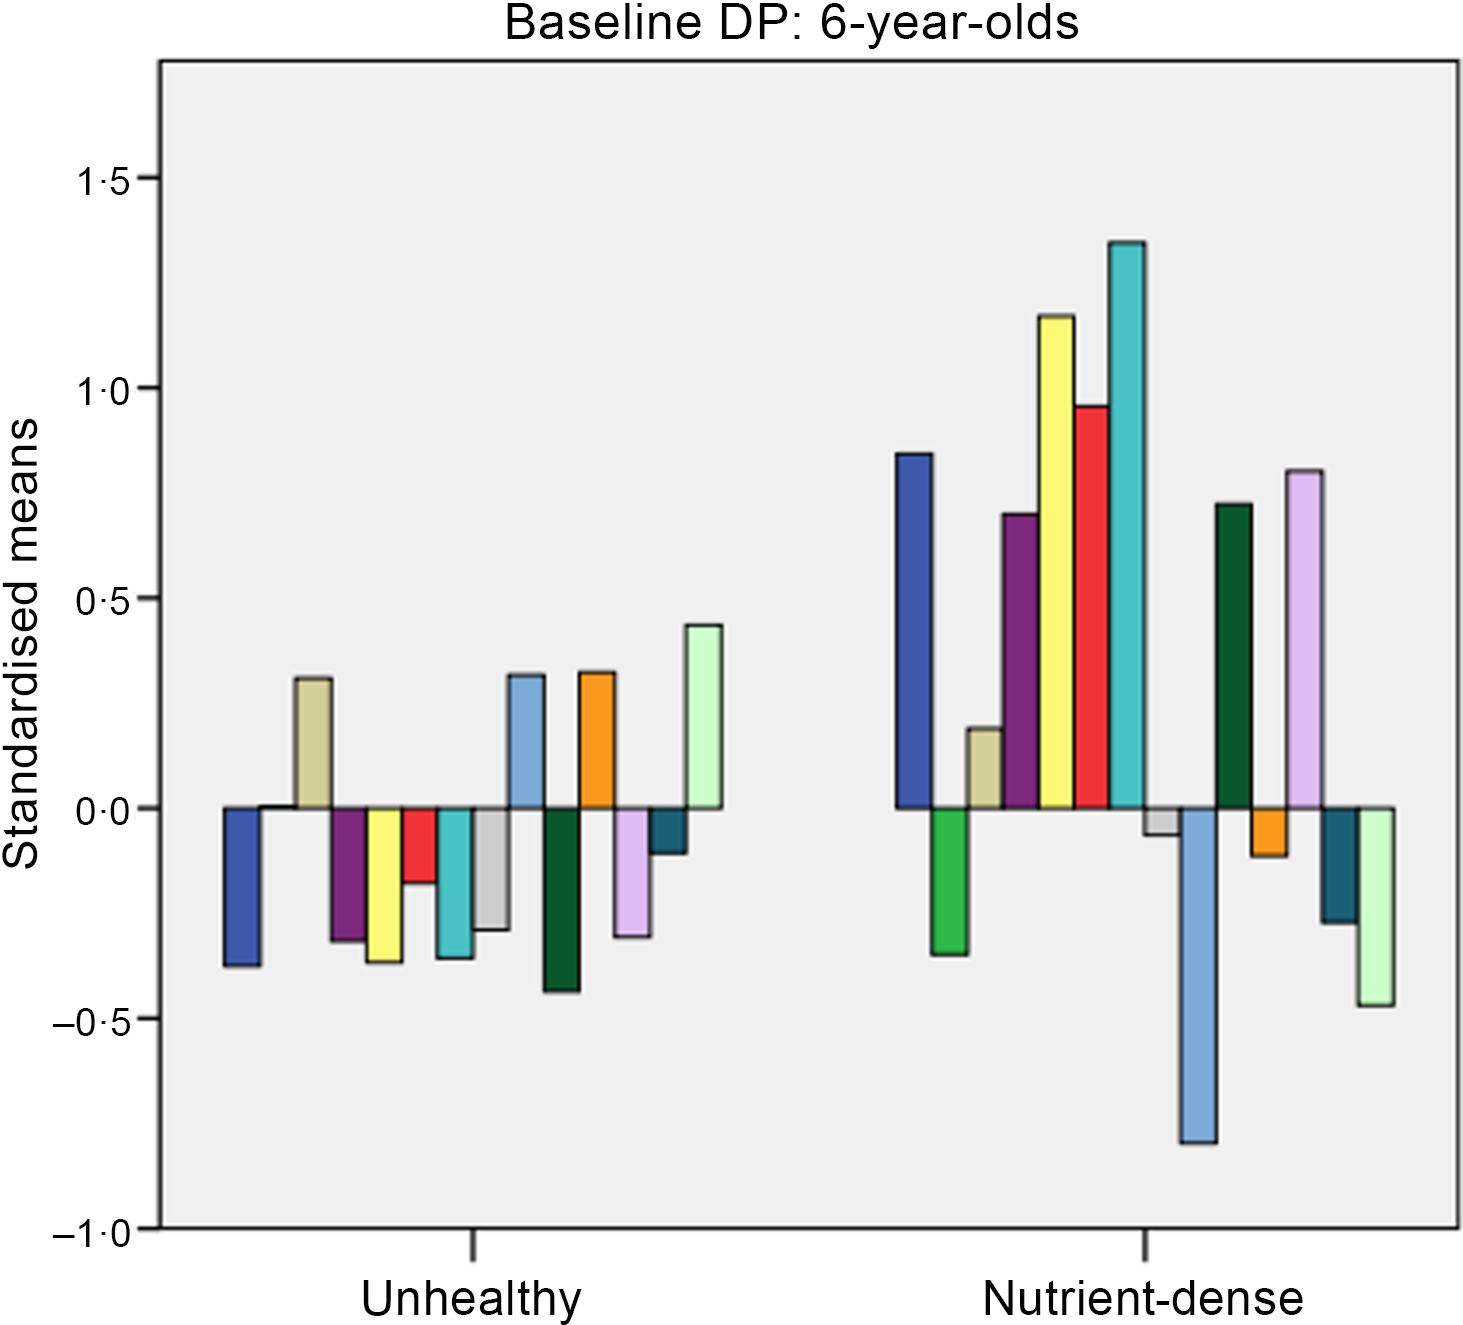
Fig. 1. Baseline dietary patterns (DP) for 6-year-olds. Dietary intake: ![]() , fibre;
, fibre; ![]() , sodium;
, sodium; ![]() , calcium;
, calcium; ![]() , iron;
, iron; ![]() , portions of fruits;
, portions of fruits; ![]() , portions of vegetables;
, portions of vegetables; ![]() , total fruits and vegetables;
, total fruits and vegetables; ![]() , number of unhealthy snacks;
, number of unhealthy snacks; ![]() , fat;
, fat; ![]() , cholesterol;
, cholesterol; ![]() , protein;
, protein; ![]() , sugars;
, sugars; ![]() , starch;
, starch; ![]() , saturated fat.
, saturated fat.
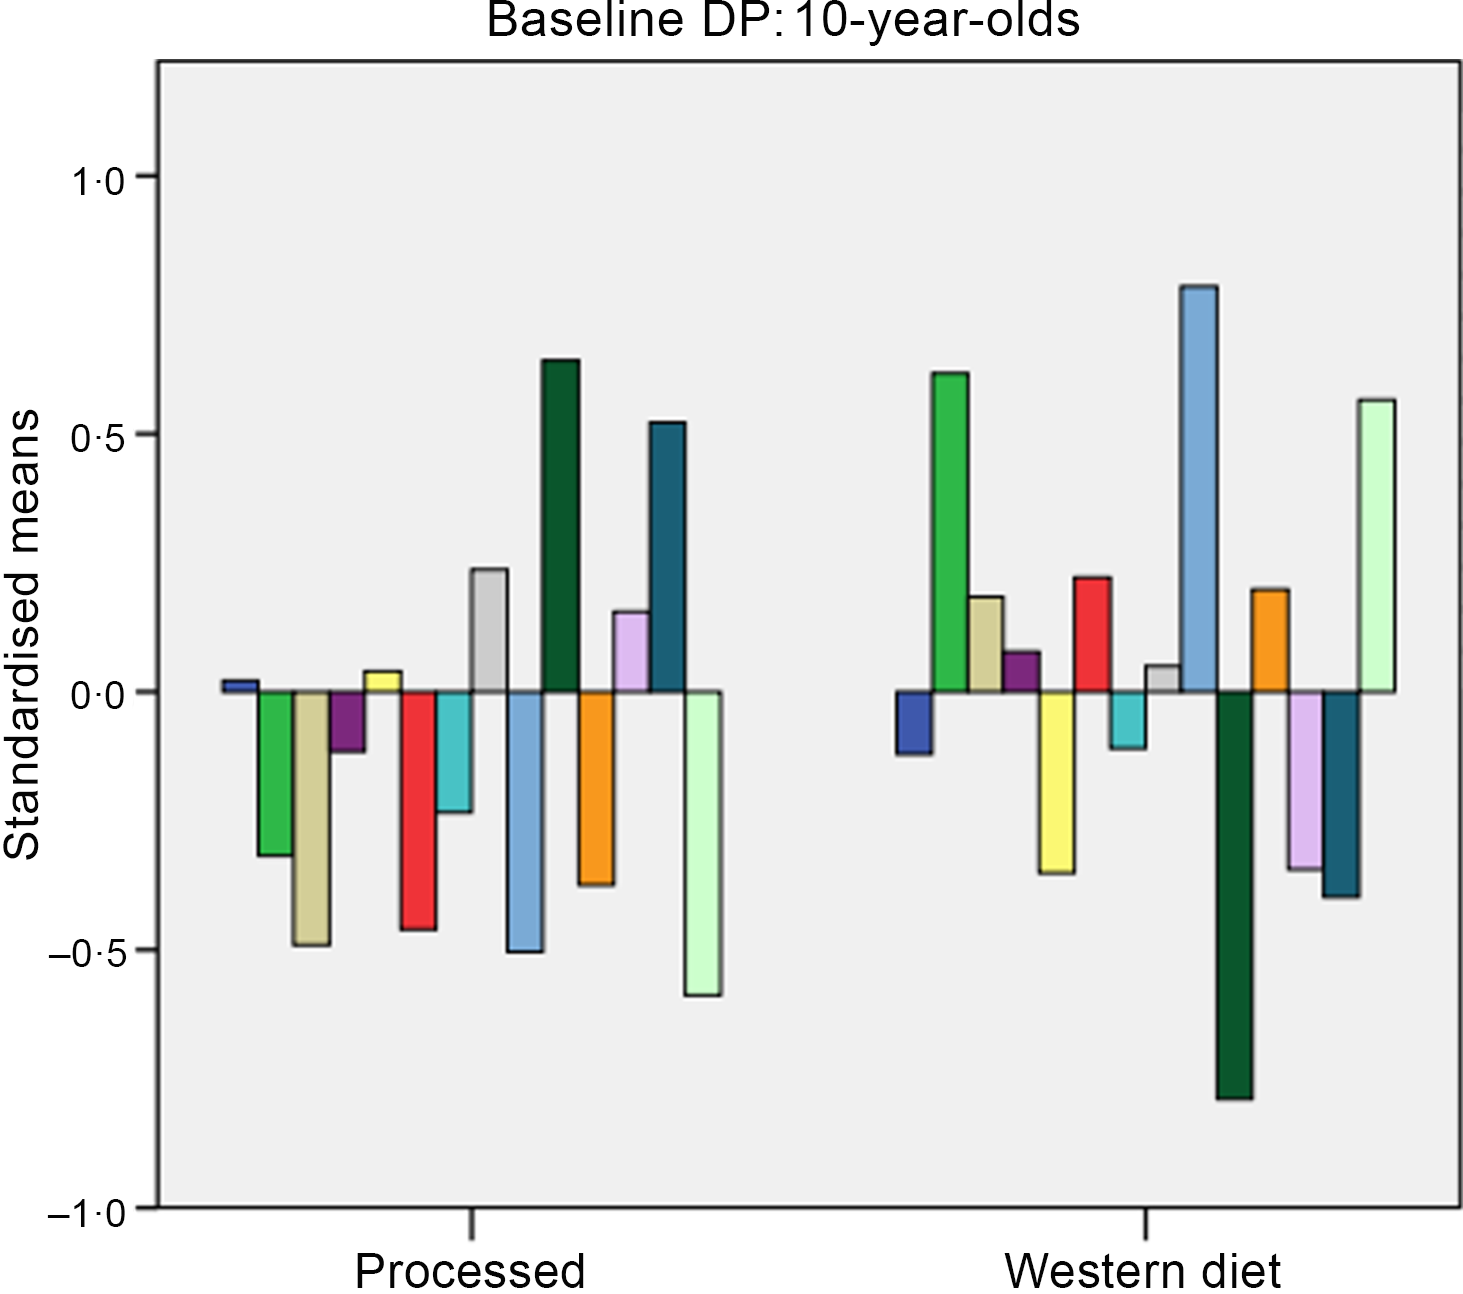
Fig. 2. Baseline dietary patterns (DP) for 10-year-olds. Dietary intake: ![]() , fibre;
, fibre; ![]() , sodium;
, sodium; ![]() , calcium;
, calcium; ![]() , iron;
, iron; ![]() , portions of fruit;
, portions of fruit; ![]() , portions of vegetables;
, portions of vegetables; ![]() , total fruits and vegetables;
, total fruits and vegetables; ![]() , number of unhealthy snacks;
, number of unhealthy snacks; ![]() , fat;
, fat; ![]() , cholesterol;
, cholesterol; ![]() , protein;
, protein; ![]() , sugars;
, sugars; ![]() , starch;
, starch; ![]() , saturated fat.
, saturated fat.
For 6-year-olds, the ‘unhealthy’ cluster had higher intakes of fat and saturated fat, while the ‘nutrient-dense’ cluster had higher intakes of fruit, vegetables and fibre. For 10-year-olds, the ‘processed’ cluster had higher intakes of carbohydrates and starch, while the ‘Western diet’ had higher intakes of fat, saturated fat and Na.
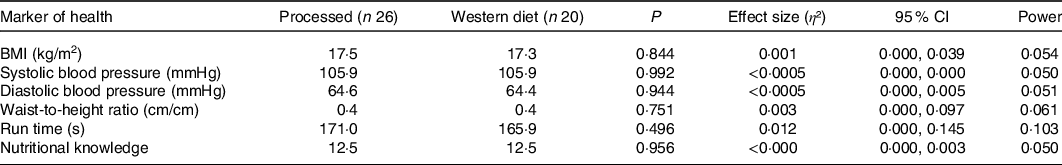
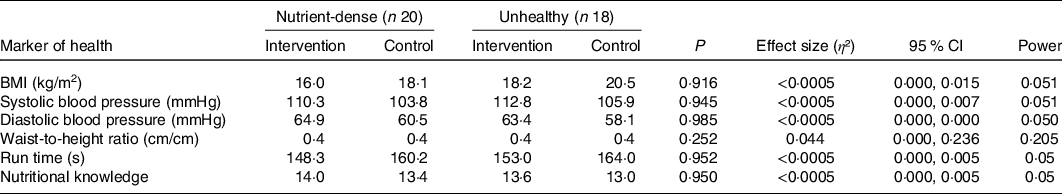
A one-way multivariate ANOVA showed there were no statistical differences for nutritional knowledge, BMI, WHtR, cardiorespiratory fitness and BP combined with respect to dietary patterns for 6-year-olds (P = 0·924) and 10-year-olds (P = 0·997). Tables 1 and 2 present the results to the one-way ANOVAs undertaken for the individual variables (nutritional knowledge, BMI, WHtR, cardiorespiratory fitness and BP) for 6- and 10-year-olds, respectively, and there were no statistical differences (P > 0·05). The corresponding effect size and observed power statistics to the mean differences are also presented in Tables 1 and 2.
Table 1. Baseline differences for 6-year-olds in markers of health and nutritional knowledge of Irish primary schoolchildren with respect to dietary patterns (n 34)
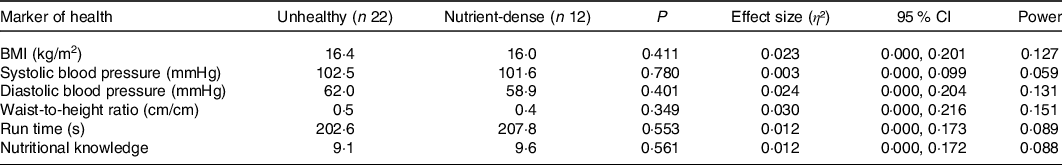
Table 2. Baseline differences for 10-year-olds in markers of health and nutritional knowledge of Irish primary schoolchildren with respect to dietary patterns (n 46)
Post-intervention dietary patterns and differences
At post-intervention, clusters were labelled for 6-year-olds as: (1) plant-based and (2) processed foods (see Fig. 3) and for 10-year-olds as: (1) nutrient-dense and (2) unhealthy (see Fig. 4). For 6-year-olds, the ‘plant-based’ cluster had higher intakes of fruit and vegetables, while the ‘processed’ cluster had higher intakes of carbohydrates and starch. For 10-year-olds, the ‘nutrient-dense’ cluster had higher intakes of fibre, fruit and vegetables, while the ‘unhealthy’ cluster had higher intakes of fat, saturated fat protein and Na.
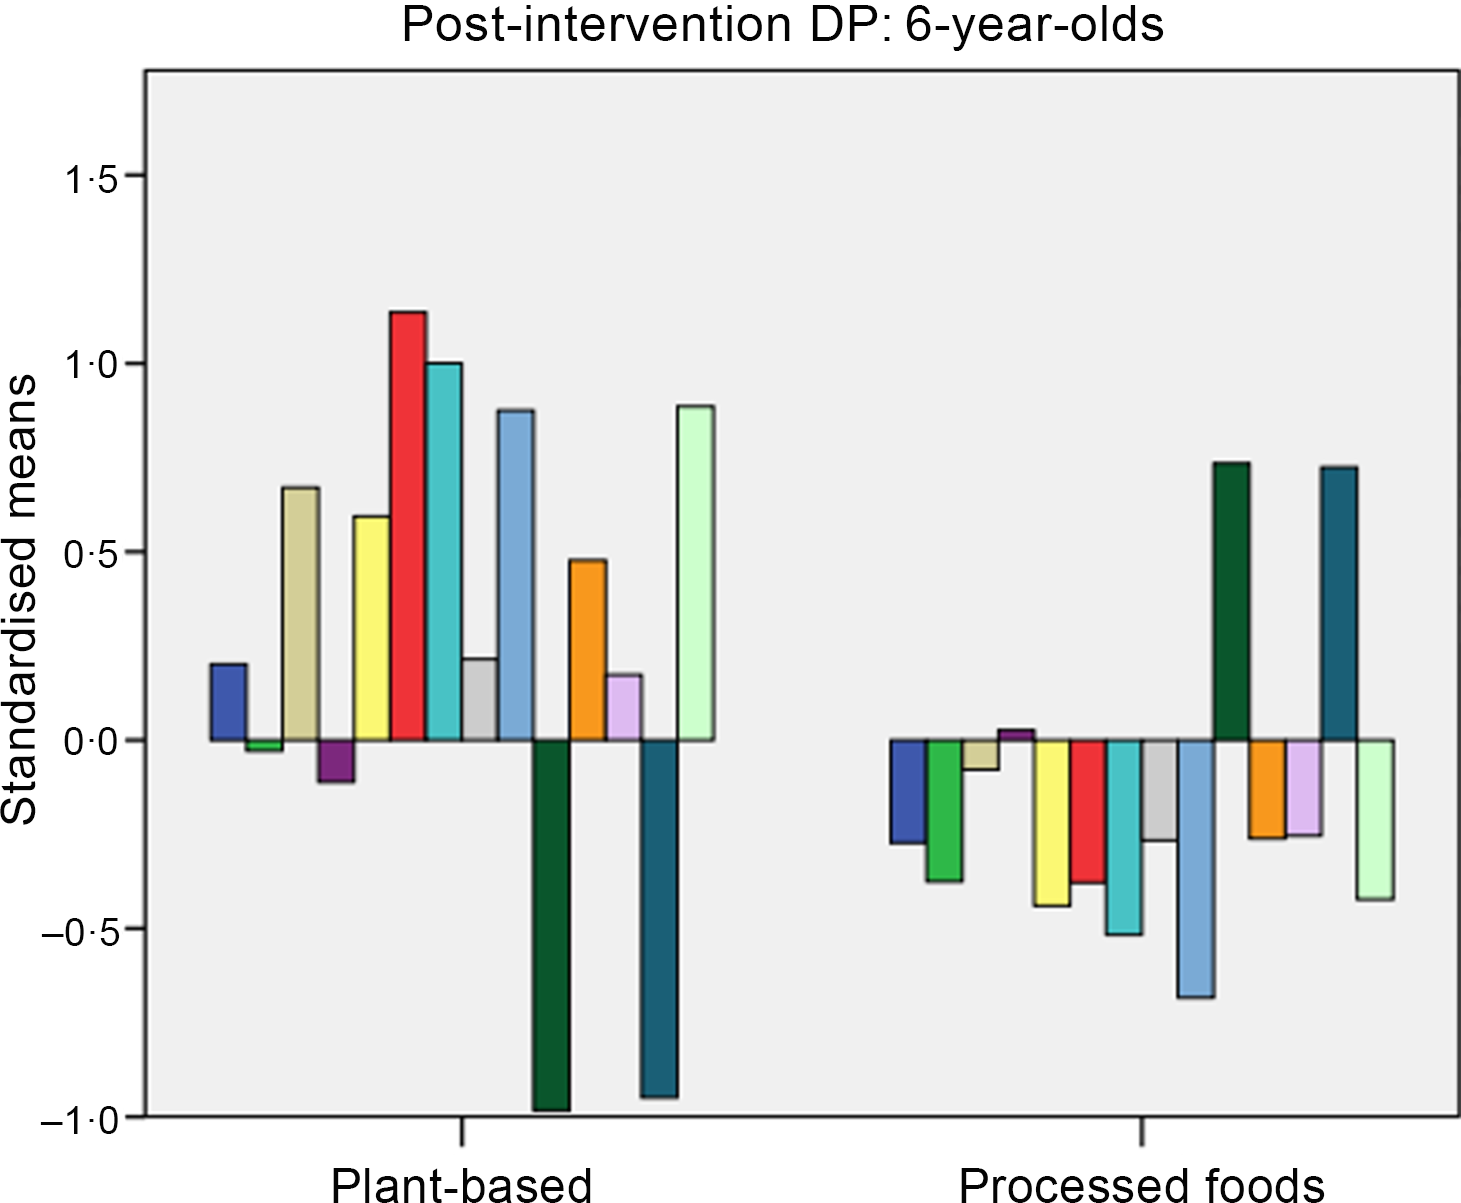
Fig. 3. Post-intervention dietary patterns (DP) for 6-year-olds. Dietary intake: ![]() , fibre;
, fibre; ![]() , sodium;
, sodium; ![]() , calcium;
, calcium; ![]() , iron;
, iron; ![]() , fruits;
, fruits; ![]() , vegetables;
, vegetables; ![]() , fruits and vegetables;
, fruits and vegetables; ![]() , unhealthy snacks;
, unhealthy snacks; ![]() , fat;
, fat; ![]() , cholesterol;
, cholesterol; ![]() , protein;
, protein; ![]() , sugars;
, sugars; ![]() , starch;
, starch; ![]() , saturated fat.
, saturated fat.
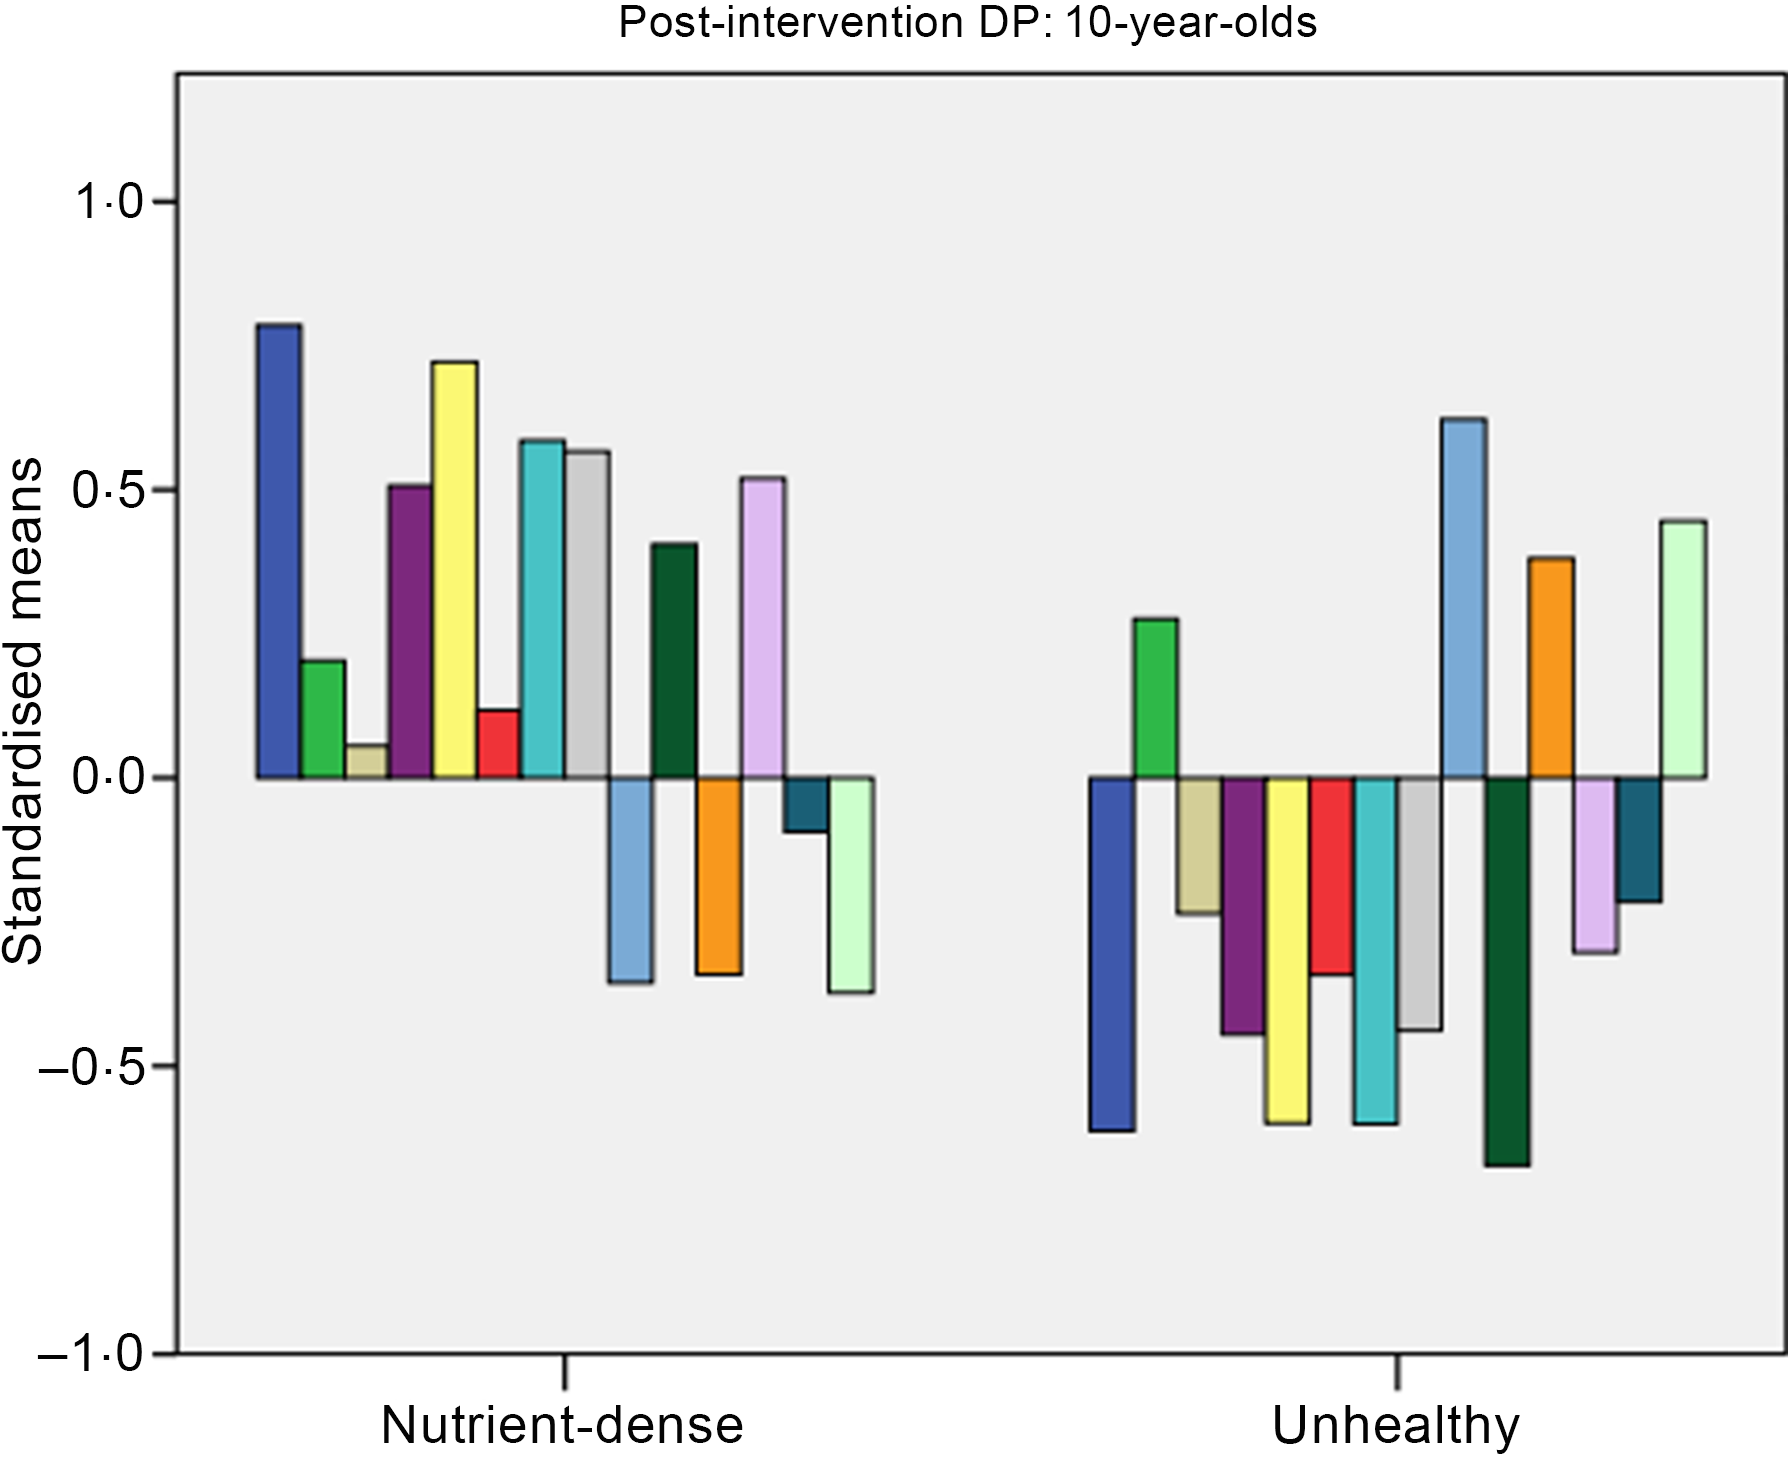
Fig. 4. Post-intervention dietary patterns (DP) for 10-year-olds. Dietary intake: ![]() , fibre;
, fibre; ![]() , sodium;
, sodium; ![]() , calcium;
, calcium; ![]() , iron;
, iron; ![]() , fruits;
, fruits; ![]() , vegetables;
, vegetables; ![]() , fruits and vegetables;
, fruits and vegetables; ![]() , unhealthy snacks;
, unhealthy snacks; ![]() , fat;
, fat; ![]() , cholesterol;
, cholesterol; ![]() , protein;
, protein; ![]() , sugars;
, sugars; ![]() , starch;
, starch; ![]() , saturated fat.
, saturated fat.
A two-way multivariate ANOVA showed there were no statistical differences for mean nutritional knowledge, BMI, WHtR, cardiorespiratory fitness and BP combined based on the interaction effect between dietary patterns and intervention/control group for 6-year-olds (P = 0·162) and 10-year-olds (P = 0·746). Tables 3 and 4 present the results to the following two-way ANOVAs for the individual variables (nutritional knowledge, BMI, WHtR, cardiorespiratory fitness and BP) for 6- and 10-year-olds, respectively. The corresponding effect size and observed power statistics to the mean differences are also presented in Tables 3 and 4.
Table 3. Intervention effect on dietary pattern for 6-year-olds in relation to nutritional knowledge and markers of health (n 31)
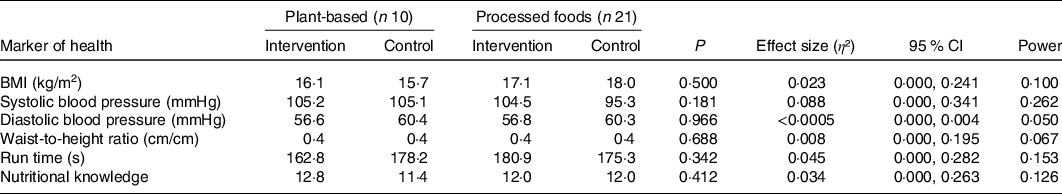
Table 4. Intervention effect on dietary pattern for 10-year-olds in relation to nutritional knowledge and markers of health (n 38)
Changes in dietary patterns following intervention
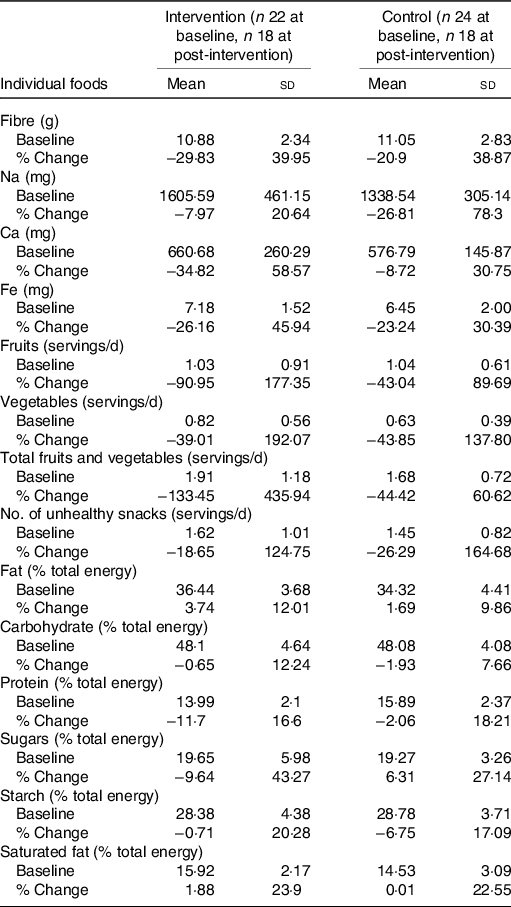
A χ 2 analysis revealed there was no significant association in dietary patterns for 6- (P = 0·661) and 10-year-olds (P = 0·738) at baseline and post-intervention (see Table 5). Baseline and percentage change (baseline to post-intervention) descriptive statistics on individual foods included in the k-means cluster analysis are presented in Tables 6 and 7.
Table 5. Cluster solution for 6- and 10-year-olds, baseline and post-intervention*
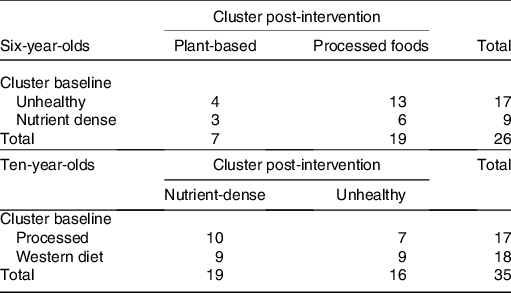
Table 6. Baseline measurements and percentage change (baseline to post-intervention) in individual foods for 6- year-olds
(Mean values and standard deviations)
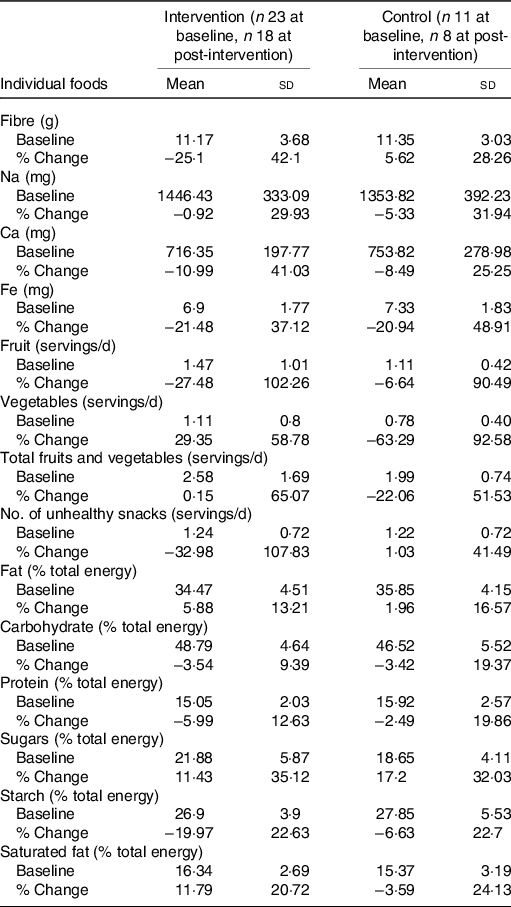
Table 7. Baseline measurements and percentage change (baseline to post-intervention) in individual foods for 10-year-olds
(Mean values and standard deviations)
Discussion
Identification of the overall combination of foods consumed is essential to understanding the relationships between diet and disease(Reference Harrington, Perry and Lutomski48). The aim of the present study was to identify dietary patterns and investigate their relationship with nutritional knowledge, cardiorespiratory fitness, BP, BMI and WHtR and to examine the effect of the intervention on dietary patterns.
The present study identified two dietary patterns at baseline for 6-year-old (unhealthy and nutrient-dense) and 10-year-old (processed and Western) Irish children. Dietary patterns derived post-intervention were (1) plant-based and (2) processed foods for 6-year-olds and (1) nutrient-dense and (2) unhealthy for 10-year-olds. Although not statistically significant and the effect sizes being low, the positive change in dietary patterns towards more nutrient-dense diets for 10-year-olds may be indicative of a healthier trend emerging, which could have substantial clinical implications if proved significant in a larger sample size and/or longer intervention delivery time.
Previous research examining the overall diets of children identified ‘unhealthy’ dietary patterns to consist of high intakes of processed foods, low intakes of fibre and high intakes of Na, fat and refined carbohydrates(Reference Shang, Li and Liu17,Reference Karatzi, Moschonis and Barouti49–Reference Romero-Polvo, Denova-Gutiérrez and Rivera-Paredez51) . Contrastingly, ‘healthy’ dietary patterns in the literature are characterised by high intakes of fruit and vegetables, milk/yogurt, eggs and legumes(Reference Shang, Li and Liu17,Reference Romero-Polvo, Denova-Gutiérrez and Rivera-Paredez51,Reference Mikkilä, Räsänen and Raitakari52) . O’Brien et al. (Reference O’Brien, Feeney and Scannell14) identified two patterns in Irish children aged 7–13 years and termed these as ‘more healthful’ or ‘less healthful’. These clusters are similar to the two clusters identified for 6-year-olds in the present study.
Some evidence suggests that ‘unhealthy’ dietary patterns are associated with CVD risk factors(Reference Rocha, Milagres and Longo4,Reference Funtikova, Benítez-Arciniega and Fitó5) , but contrary to these findings, the present study found no significant relationship between dietary pattern and nutritional knowledge, BMI, BP, WHtR or cardiorespiratory fitness. However, evidence for any association between dietary pattern and markers of health is mixed(Reference Rocha, Milagres and Longo4,Reference Craig, McNeill and Macdiarmid11,Reference Smith, Emmett and Newby18,Reference Saeedi19,Reference Akbarzadeh, Nourian and Hovsepian53) . In a study of children from the UK, a ‘Health Aware’ dietary pattern was linked to decreased fat mass gain in girls between the ages of 9 and 11 years(Reference Smith, Emmett and Newby18). Craig et al. (Reference Craig, McNeill and Macdiarmid11) also found that ‘healthier’ dietary patterns were associated with less screen time in Scottish for 5- to 11-year-olds. This is supported by a more recent review by Akbarzadeh et al. (Reference Akbarzadeh, Nourian and Hovsepian53) who found diets with a higher healthy eating index to be inversely associated with the metabolic syndrome in youth, whereas Western-type diets (diets that score lower on the healthy eating index) were positively associated with the condition. A systematic review by Rocha et al. (Reference Rocha, Milagres and Longo4) also found a positive association between ‘unhealthy’ dietary patterns and cardiometabolic alterations in children and adolescents. Similar to the present study’s findings, however, Craig et al. (Reference Craig, McNeill and Macdiarmid11) found little association between dietary patterns and overweight and obesity, and the National Children’s Food Survey(54) found no evidence that overweight or obese children have unhealthy dietary patterns. Saeedi et al. (Reference Saeedi19) also found no significant associations between dietary patterns and markers of cardiovascular health in 9-year-old New Zealand children. The conflicting evidence may be due to differences in sample size, methods used to analyse dietary patterns, duration of the study and the age of participants, which may all effect the ability to detect an association between dietary patterns and health markers. Furthermore, associations between dietary patterns in childhood and health markers may not become clear until later in life(Reference Bull and Northstone55).
Strengths and limitations
A significant strength of the present study is the longitudinal design and the use of a 4-d food diary to investigate dietary intake. Furthermore, examining dietary patterns, as opposed to individual nutrients, is a useful method for examining diet and the association with health markers. This was the first study in Ireland known to investigate the longitudinal association between dietary patterns and obesity-related outcomes in children and to utilise dietary pattern analysis to assess a health promotion intervention in children.
Limitations of the present study include subjective decision-making in determination of the number of clusters and how the clusters were labelled. The dietary patterns identified in the present study, however, were similar to previous research(Reference O’Brien, Feeney and Scannell14). In addition, the food diaries were self-reported; therefore, some misreporting and non-reporting are likely to have occurred(Reference Poslusna, Ruprich and de Vries56). As reporting error is a common limitation associated with the direct measurement of dietary intake in children(Reference Livingstone, Robson and Wallace57), data should be evaluated with caution. Debriefing with the researcher at the end of diary completion may have also introduced reporting bias of dietary intake(Reference Bingham, Cassidy and Cole58). The small sample size also made it more difficult to definitively assess dietary patterns and their association with health markers. As the intervention was only implemented in one intervention school, and only 6-and 10-year-olds were evaluated, the clinical implications of the results are limited. However, the study’s purpose was exploratory in nature to help inform further research, and the 6- and 10-year-old age groups were selected on the basis that they mark sensitive periods of growth for the child (mid-childhood and early adolescence)(Reference Cameron and Demerath59,Reference Graham, Appleton and Rush60) . A potential limitation of the study could be that children may have changed their dietary intake as a result of increasing independence as they near adolescence. However, as these children were all still in primary school at the time of follow-up, these changes may not be substantial, since increasing independence usually coincides with the commencement of secondary school in Ireland.
Public health implications
Project Spraoi is based on Project Energize, which has been implemented in New Zealand since 2004, and proven to be successful and cost-effective(Reference Rush, Cairncross and Williams61). Initial findings from the Project Spraoi research(Reference Merrotsy, McCarthy and Flack27) indicate that the intervention has the potential to improve the health of children in Ireland, which supports recent policy(62). Preventing children from becoming overweight and obese is the best approach and this is the focus of Project Spraoi, which aims to make healthy eating and increased PA a daily habit. Although some of the findings were not statistically significant, there were positive trends emerging for the 10-year-olds and these findings are important given that small cumulative differences may ultimately contribute to significant improvements in dietary intake and markers of health in a public health context. It is widely recognised that childhood obesity is a multidimensional issue; however, the WHO(63) has highlighted that schools are one of the most important sectors to address obesity. Yet, Ireland has very few school-based preventive strategies or interventions that target overweight and obesity in children. These interventions are important as part of the whole school approach recommended by the Irish Obesity Policy and Action Plan(62). From a public health context, therefore, if the small cumulative differences found in this school-based intervention study were explored in more schools, over a longer period of time, significant improvements in dietary intake and markers of health may be found.
Conclusion
This is the first study in Ireland to examine the relationship between dietary patterns and markers of health in children and to assess the impact of a health promotion intervention on dietary patterns over time. Despite finding no statistically significant evidence to support the relationship between dietary patterns and health markers, previous research has shown that dietary patterns established during childhood may track into adulthood and are therefore important to monitor for health outcomes later in life. While no statistically significant evidence of intervention impact was found on dietary patterns, a positive trend was emerging among 10-year-olds in the present study. This exploratory study will inform a future study, which aims to have a larger sample size and be delivered to more schools. Additional studies with larger sample sizes that deliver interventions over a longer period of time are warranted to further clarify the role of dietary patterns with markers of health and inform future interventions.
Acknowledgements
The authors would sincerely like to thank the schools and participants for their involvement in and contribution to the present study.
This research received no specific grant from any funding agency, commercial or not-for-profit sectors.
T. C., A. L. M. and A. M. designed the research project. A. M. conducted the research and T. C. assisted with data collection. A. M. analysed the data and performed the statistical analysis under the guidance of S. L. The lead author was A. M.; however, all authors contributed to the writing of the article. All authors then reviewed the final article for content.
There are no conflicts of interest.


