


INTRODUCTION
In Ethiopia, many programmes have promoted crop and livestock technologies to fully exploit the country's biophysical potential. As Headey et al. (Reference Headey, Dereje and Taffesse2014) highlighted Ethiopia has a long history of agricultural intensification through the adoption of technologies [. . .]. Indeed, many projects have been implemented to understand the needs in terms of agricultural technologies in Ethiopia and adoption strategies by farmers (Feleke and Zegeye, Reference Feleke and Zegeye2006), but none of them has really explained why farming systems still rely mainly on traditional technologies. Von Braun and Olofinbiyi (Reference Von Braun and Olofinbiyi2007) emphasized that Ethiopia's extension system faced challenges in promoting modern technologies such as improved seed, fertilizer and post-harvest technology. They demonstrated that climate variability, lack of access to finance and conflicts were the most important challenges. This highlights the complexity of understanding technology adoption which must include biophysical, socio-economic and even anthropologic dimensions. Of course, heterogeneity within a given community is high for any of these dimensions, but typologies allow for the delineation of relatively homogeneous groups, which are assumed to share similar needs in terms of technologies.
Typologies have been extensively used in the past few years to understand the diversity of farms and in particular (i) to target technologies (understanding which farm type is most likely to adopt and benefit from a particular technology); and (ii) to scale out technologies (where typologies contribute to the necessary but not sufficient understanding of how representative a particular farm is of the larger farm population). In order to embrace diversity and target different technologies to different farms, two different approaches could be used: (i) to engage each and every farmer in discussions about his/her opportunities, constraints and orientation; or (ii) to apply a blanket recommendation of technologies across all farms. Whilst the first approach is not realistic (it would require considerable resources), the second might not increase the rate of adoption of improved technologies. This reductio ad absurdum introduces the core concept of what the objective of a typology is ‘to allow capturing the main features of the diversity of farming systems of a given agronomic context without falling into the “paralysing particularism” (Perrot and Landais, Reference Perrot and Landais1993) that considers each farmer individually’.
In this paper, we illustrate the two approaches mentioned by Jollivet (Reference Jollivet1965): extracted and constructed types. Extracted types are based on data analysis without a priori selection of discriminant variables in a ‘blind work’ process (Landais, Reference Landais1996), and is illustrated in this paper by the implementation of a statistical based typology (PCA-HC method; a combination of Principal Component Analysis and Hierarchical Clustering). On the other hand, constructed types are the product of a number of assumptions regarding the context and are based on a research hypothesis and its logical implication, and will be illustrated in this paper by the expert-based typology.
Using Ethiopia as a case study, the objective of this paper was to compare the discriminant power of expert-based typologies and statistical-based typologies, and to understand their comparative advantages and their complementarities in targeting sustainable intensification technologies. Beyond the empirical exploration of farming system diversity in Ethiopia, our paper explores the intrinsic nature of both approaches (assumptions, temporal dimension, data selection, etc.) and its impact on technology promotion.
MATERIALS AND METHODS
Study area and dataset description
The study area is located in the Southern Nations Nationalities and Peoples Region (SNNPR) of Ethiopa, between 37°45′ and 38°37′ E and 6°54′ and 8°16′ N, at an altitude between 1600 and 2100 m above sea level. It encompasses three districts: Mesrak Badawacho, Meskan and Hawassa Zuriya. The study area is characterized by bimodal rainfalls pattern (between 700 and 1300 mm year−1) received between March and September, and an average annual maximum and minimum temperatures of 27 and 13 °C, respectively. The dominant soil types are Andosols and Lixosols. Population density is high (between 340 and 480 inhabitants km−2) and farming systems are characterized by a high diversity of crop and livestock species (i.e. maize, sorghum, teff, common bean, sheep, cattle, goats). In 2010, a survey was administered to a sample of 273 farm households in the three districts of the study area to understand technology adoption constraints in Eastern and Southern Africa. The sample of households is built on (i) selecting districts according to maize production importance; and (ii) membership to peasant association of different importance.
We decided to focus only on selected variables of the total dataset, some of which were use as discriminant variables and some as explanatory variables (Table 1).
Table 1. Descriptive statistics of the variables used to build typologies and their role in the analysis.

Methodology for expert-based typology
The objective of the expert-based typology presented here was to produce a simple tool to target technologies (i.e. understand quickly which farm type is most likely to adopt and benefit from a particular technology), and to scale out technologies (i.e. understand quickly what type a particular farm belongs to, without complex analysis, to be able to transfer successes from similar farms).
Interventions proposed by CIMMYT and its partners in Southern Ethiopia can be classified as being either (i) crop intensification technologies; (ii) livestock intensification technologies; (iii) crop-livestock integration technologies or (iv) labour-saving technologies. Thus, the expert-based approach purposefully identified: (1) crop-oriented farms, (2) livestock-oriented farms, (3) mixed crop-livestock farms and (4) small farms.
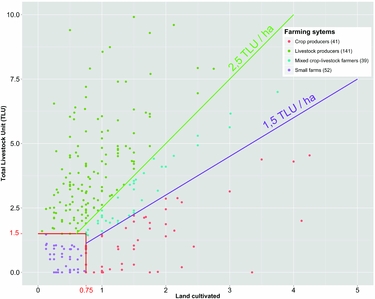
Based on previous work in the area (Duriaux, 2014), small farms were considered to be smaller than 0.75 ha, and 0.5 ha of farmland was considered to provide enough biomass (crop residues, weeds, browse, etc.) to feed one TLU. Accordingly, four farm types were delineated:
– Small farms (Type 1). Selected as farms < 0.75 ha and owning < 1.5 TLU (the livestock that could be sustained by a farm size of 0.75 ha considering a requirement of 0.5 ha TLU−1).
– Livestock-oriented farms (Type 2). Selected as farms owning > 1.5 TLU and having a land: livestock ratio of > 0.625 ha TLU−1 (that is 0.5 + 25% ha TLU−1).
– Mixed crop-livestock farms (Type 3). Selected as farms owning > 1.5 TLU, with a farm size > 0.75 ha, and with land: livestock ratio between 0.375 and 0.625 ha TLU−1 (that is a 0.5 ± 25% ha TLU−1).
– Crop-oriented farms (Type 4). Selected as farms > 0.75 ha and with a land: livestock ratio < 0.375 ha TLU−1 (that is 0.5–25% ha TLU−1).
Small farms with small livestock herd (Type 1) were assumed to depend more on off-farm activities than farming for their livelihoods. Such farms are expected to benefit from the adoption of labour saving technologies that would allow them to free more of their time for more rewarding off-farm activities. Mixed crop-livestock farms (Type 3) were assumed to have the potential to feed their livestock the entire year with biomass produced on-farm and to not face any feed shortage, as well as to produce enough manure to maintain their soil fertility with minimum requirement for mineral fertilizer. However, the total productivity of such farms could potentially be improved through the adoption of crop-livestock integration technologies (e.g. better use of crop residue as feed, more efficient use of manure). Farms with a low livestock density (Type 2) were assumed to not face any feed shortage, but to not produce enough manure to maintain their soil fertility without mineral fertilizers. The productivity of such farm could be improved through the adoption of crop intensification technologies. Finally, farms with a high livestock density (Type 4) were assumed to produce enough manure to maintain their soil fertility with minimum requirement for mineral fertilizer, but not to feed their livestock the entire year with biomass produced on-farm.
This typology is a perfect example of Landais (Reference Landais1998) definition of ‘constructed types’ which ‘derived by methods which proceed from a number of assumptions as to the nature of the object being studied’. Here, the assumption is that focussing on TLU and cultivated land is enough to get a realistic picture of the diversity of farming systems, according to the objective of targeting technologies.
Methodology for statistical-based typology
Here, the objective of the approach is to extract as much information as possible from the dataset with a system perspective, in line with extracted types (Landais, Reference Landais1998). By a system perspective, we mean that the crop and livestock sub-systems are explicitly included in the dataset as well as the main flows within and through the systems (i.e. flows of agricultural production to either home consumption or markets, the main sources of income, the use of labour). The main concern of typology delineation in highly unstable environments (economic and environmental) is that typologies are only a ‘snapshot’ of the diversity of farming systems, which are highly dynamic in such environments (e.g. ‘moving targets’, Valbuena et al., Reference Valbuena, Groot, Mukalama, Gerard and Tittonell2015). Thus, variables that can be considered ‘slow moving variables’ were used as discriminant variables, i.e. land owned, TLU, area dedicated to crop types, herd size and composition. We considered these variables as representing types of systems (i.e. crop, livestock or mixed farms), and although these variables can suddenly suffer changes due to exogenous shocks, such changes (e.g. sale or loss of the livestock herd or no crop production because of drought) are not directly taken into account in the typology of farming systems. Discriminant variables are mainly used as proportions or percentages to capture the structure of the systems in terms of the sub-systems and their interactions, and to avoid the typology being driven by farm size. Once the typology is built, ‘fast moving variables’ or functional variables can then be used to give more information of each type, including time-dependant dimensions such as crop production levels, input use level or income level. In our distinction between slow and quickly moving variables, we are in line with functional and structural typologies described by Lopez-Ridaura and Tittonell (Reference Lopez-Ridaura and Tittonell2011).
The multivariate analysis chosen to build the typology is a classic and well-known two-step method. In a first step, a principal component analysis (PCA) is implemented on the discriminant variables to synthetize the diversity of the sample into few first principal components of the PCA (data- or dimension-reduction process). In a second step, a hierarchical clustering (HC) analysis is implemented on these synthetic principal components. Based on multi-dimensional Euclidian distances, the algorithm simply adds one-by-one farms according to their proximity in this hyper-plan. Both PCA and HC were implemented under R (3.0.0, R Development Core Team, 2005) using the ade4 package (Thioulouse et al., Reference Thioulouse, Chessel, Dol_edec and Olivier1997).
Sub-sample approach to assess data selection effect on total variability tackled in PCA-HC typology
Compared with expert-based typologies, the main advantage of PCA-HC typologies is that it avoids subjectivity in the expert's perception of the agronomic context and reveals the diversity contained in a dataset. In a data scarce environment, data selection is quite straightforward and all data will likely be used. But in cases where many variables are available, such as with household or panel surveys, the issue of data selection becomes a critical one, which will impact the final result of the typology. In many SSA contexts, there is no regular or systematic source of data, and most of the time analyses are implemented on large surveys conducted once or infrequently. These surveys are often very broad and include data on many components of farming and livelihood systems, e.g. livelihood strategies, livestock activities, crop activities, natural resource management and income sources. Delineating a typology based on this diverse dataset will imply explicit and implicit knowledge on the purpose of the typology, the local context and the implementer's background. For instance, typology implemented within the context of crop and livestock production would emphasize all data related to those sub-components whilst a sociologist or economist will prefer to focus on income sources and livelihood strategies. If the explicit part can be explained and justified (data selection according to local context or typology's purpose), the implicit part is difficult to measure: How strong is the influence of the implementer's background, or his a priori perception of the farming systems, of the data selection, and thus of the diversity contained in it?
Here, we decided to test this data selection question within the selected dataset. Amongst the 20 quantitative variables available, we created a simple code to randomly select 15 of them, and for each sub-sample run a PCA and compute the global inertia in the first two PCs. Global inertia is the total diversity contained in the sample which can be explained if we consider not solely the first PCs but all of them. We don't aim to contribute here to complex analytical analysis of PCA robustness as fuzzy robust PCA (Sarbu and Pop, 2005) or robust PCA to deal with skewed data (Hubert et al., Reference Hubert, Rousseeuw and Verdonck2009), but simply to answer the intuitive question: What is the impact of data selection on the overall diversity represented in the first two PC of a classic PCA analysis?
RESULTS
Expert-based typology
Figure 1 illustrates the discriminant key of the expert-based typology. The four farm types appear clearly according to their land and livestock endowment and livestock density.

Figure 1. Graphic illustration of expert-based typology of 273 farm household in Southern Ethiopia (each line represent the threshold defined on expert-based typology).
In order to further interpret the farming types resulting from expert knowledge, Figure 2 shows the average value of adult ha−1, maize production, percentage of female headed household and percentage of farmer selling labour, with significant differences between types.

Figure 2. Average value of selected variables to describe expert-based typology of 273 farm household in Southern Ethiopia (differences between types was assessed through ANOVA tests and were significant (P < 0.001) for all variables).
Based on the nature of expert-based typology, and its construction based on the assumptions of technology promotion, the link between types and technologies is quite straightforward and described below:
– Small farms (Expert type 1, ET1). Labour saving technologies: direct seeding, use of herbicide and mechanization. These technologies will reduce the time required on the farm and maximize the time spend on more rewarding non-farm activities.
– Livestock oriented farms (Expert type 2, ET2). Livestock intensification technologies: genetic improvement, improved nutrition, production of fodder and disease control.
– Mixed cop-livestock farms (Expert type 3, ET3). Crop-livestock technologies: improve use of crop residue as feed, and improved use of manure. These technologies can increase substantially the total productivity by a better integration between these two sub-systems (Herrero et al., Reference Herrero, Thornton, Notenbaert, Wood, Msangi, Freeman, Bossio, Dixon, Peters, van de Steeg, Lynam, Parthasarathy, Macmillan, Gerard, McDermott, Seré and Rosegrant2010).
– Crop-oriented farms (Expert type 4, ET4). Crop intensification technologies: improved germplasms, improved fertilization and irrigation, improved weed, pest and disease control and diversification (e.g. intercropping, relay-cropping).
Statistical-based type description
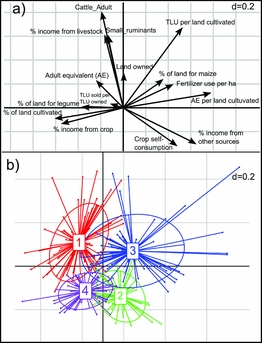
As PCA-HC is widely used in typology construction, we will only interpret briefly the two graphics in Figure 3 to understand the four types built in this approach. For further information on the whole interpretation process, see Alvarez et al. (Reference Alvarez, Paas, Descheemaeker, Tittonell and Groot2014). Here, we decided to select the first three PCs, representing a total of 44% of the overall diversity, and which defined four farm types after consideration of the HC analysis. Figure 3a and Figure 3b can be analysed jointly and represent the projection of variables and farm household on the PC1–PC2 plan.

Figure 3. Graphical exploration of Principal component analysis (PCA) and hierarchical clustering (HC) for 273 farm household in Southern Ethiopia: (a) Projection of variables on the PC1–PC2 plan; (b) Projection of farmers according to their types on the plan PC1–PC2.
Before entering into a precise description of each type, Figure 3a and Figure 3b already provide important information on discriminant sub-systems in Southern Ethiopia. The vertical axis is mainly driven by livestock systems, with livestock-oriented farms on the upper part of the graphics. The horizontal axis is more multivariate and discriminates on the left farms that cultivate a significant proportion of their land with legumes from which they get a major part of their income. On the right side, farms are under land pressure, use high levels of fertilizer and get a significant part of their income from outside. Graphical exploration of PC1–PC3 didn't provide different information and are not represented in Figure 3. Beyond this first visual exploration, the average value per type of discriminant and descriptive variable (Table 2) allowed us to give a full description of these four farming systems, and evaluate their technological needs.
– Livestock owning farming households with crop-legume production (Statistic Type 1, ST1). This type is characterized by significant livestock holdings (4.5 TLU and >2 small ruminants), from which they get 29% of their income. The area of land owned is not enough to feed livestock and household of almost six AE, so additional land is rented or borrowed. With 2.1 t of maize and 710 kg of legume, this group displays the highest production, of which about half is consumed within the household. More interestingly, 12% of the land is allocated to legume production, with low fertilizer use, emphasizing the benefits of crop rotation. Finally, income is significantly higher in this group, with a good balance between crop and livestock derived income. For this type of farm, intensifying crop and livestock production technologies, as well as their interaction, can improve the efficiency of the system.
– Low resource endowment farming households with off-farm income (ST2). With only 1.2 TLU, and low maize and legume production, this type is characterized by a significant proportion of the income (54%) coming from outside the farm. Seventy percent of the crop production is self-consumed and the remaining 30% of production constitutes 40% of total income. With low land availability, low livestock density and fertilization rate, this group is not focussing on agriculture as an income generator but to secure food availability, and relies mainly on external outcome. This farming system may well implement labour saving technologies (e.g. herbicide use, direct seeding) that allow them to pursue more profitable off-farm activities whilst ensuring food security.
– Intensive maize-based farming households under land pressure (ST3). With 3.2 TLU and 1.3 ha land owned, surprisingly this group only cultivated 65% of land available, and then faced high land pressure. These are maize-based systems with 77% of land allocated to maize but with almost no legumes, but compensated for with high fertilization rate. One-third of income is derived from outside the farm and for 57% from crop production. High TLU ha−1 is certainly the indicator of crop-livestock interaction, which also explains the weak level of TLU sold per TLU owned. As for type ST1, technologies for the sustainable intensification of this group of farming systems may include: The design of crop rotations with legumes as well as manure management and crop residue management to improve crop-livestock integration, but also labour-saving technologies regarding contribution of off-farm activities.
– Crop producers (ST4). With low livestock density and a significant amount of land borrowed or rented, this group is characterized by its income source at almost 90% from crop production. Allocating 64% of land to maize to produce 1.8 t of maize and 700 kg of legume; the 44% of production sold is not enough to generate enough income and this group displays the lowest average total income. In spite of 1.5 TLU, livestock is almost not exploited and only represent a small part of the household income (3%). Technologies for the sustainable intensification of these farming systems might be developed and implemented within the cropping systems.
Table 2. Main characteristics of farming systems types according to statistical typology.

***Indicates significant differences between means of the different types at P < 0.001, tested through ANOVA.
Sub-sample approach: questioning the objectivity of statistical analysis
Figure 4 displays the distribution of the global inertia of 1000 random arrays of 15 variables out of the 20 available. The global inertia ranges from 29.6 to 44.2% of the diversity explained. To be more explicit, in the worst choice of 15 variables out of 20 available, the two first components will contain 29.6% of the total information on diversity in this sample. In contrast, when we select the best sample, 44.2 % of information will be contained in the first two PCs. Note that total diversity in those two cases are different, i.e. the percentages are not relative to the same absolute of potential 100 % variability, but to each sample's total variability. We assessed the structure of this variability, whether widespread in several PCs or concentrated in the first few (Table 3) and discussed in section 4.2.

Figure 4. Distribution of global inertia in two first principal components (PCs) for 1000 PCA runs of 15 variables out of the 20 available. Red bar and green bar represent respectively the sample with the minimum (29.6%) and maximum (44.2%) global inertia in two first PCs. The dotted line represents the average value of 37.4 %.
Table 3. Two samples amongst the 1000 draws of 15 variables out of 20 which represent the minimum and the maximum global inertia in the two first PCs (ticks means that the variable is considered in this typology, and crosses that this variable is not considered in this typology).

DISCUSSION
Questioning the assumed objectivity of statistical approaches
As stated by Landais (Reference Landais1996), statistical approaches are assumed to be ‘blind’ approaches where no a priori perception of the context should influence the operator of the typology in determining the drivers of farming system diversity. Indeed, compared to expert-based typology where the discriminant key is clearly based on the local knowledge, statistical tools intend to avoid bias that could be caused by diverse factors such as affinity to certain farmers, expert's background and origin, amongst others. If this is well known, the statistical tool and its objectivity is less often debated. Our sub-sample didactic exercise pursues the objective of demonstrating the impact of data selection, and thus questions the assumed objectivity of statistical tools. Based on 20 variables available, we saw in Figure 4 that the selection of 15 variables can significantly influence the structure of the diversity in the sub-sample and what we called compactness, i.e. the amount of total inertia in the first PCs. This sub-sample exercise mimics data selection occurring frequently in agronomic studies, where researchers are asked to assess farming system diversity based on large surveys. In our case-study, the best choice would have given a total inertia in the two first component of 44.2%. Table 3 shows the five variables which have been removed in the worst-case sub-sample, and which are critical in understanding the diversity of farming systems in Southern Ethiopia, namely, AE per land cultivated, TLU per land cultivated, production of maize, TLU and land cultivated. This result also confirms our assumptions that ratios are important in farming system descriptions, even if numerator and denominators of the ratio are already considered in variables sampled. Some would argue that ratios erase some information (e.g. one farmer with 100 TLU and 100 ha would have the same value of livestock density compared to a farmer with 1 TLU and 1 ha), but our case-study shows that livestock density is itself a variable to consider. In contrast, we can also see that AE per land is an important variable whilst AE itself is not chosen in the best-case sub-sample.
This simple example shows that data selection and calculation of indicators are a topic of interest closely linked to typology research. Within the context of increased interest in scaling-out targeting technologies and increasing adoption rates, researchers must select variables carefully. If for pragmatic reasons data availability and quality should be prioritized, more systemic reflection should lead the choice of selecting data to run a typology in a given context. This data selection should include statistical considerations, i.e. by assessing how to optimize variability in the whole sample, maybe by going one step further in our sub-sample analysis and run cluster analysis on each of the 1000 PCA ran. Nonetheless, we also argue that expert knowledge should be part of this data selection process.
Comparing each typology to target technologies
Figure 5 is a contingency table for the expert and statistical typologies described above and allows the matches and mismatches of both typologies to be seen. In order to compare typologies, the example of 43 farmers in Expert-based Type 1 (ET1, small farms) can be discussed. If they were no correspondence at all between the two typologies, these 43 farmers would be spread equally between the four statistical types (ST); whilst we see that 26 of them are actually in the ST2 (low resources endowment farm household with off-farm activities). This clearly demonstrates similarities in farms of these two types, from different typologies. Indeed, characterized by experts according to their low land availability and their small herd, these criteria also appear in the description of ST2. However, the important additional information here is that statistical-based typology showed that those farmers have high off-farm income, potentially a key characteristic in targeting technologies. Pursuing the same type of reasoning with ET2 (livestock oriented farms), we can see that the 140 farmers are mainly split into types ST1 (livestock farm household with crop-legume production) and ST3 (intensive maize-based farming systems under land pressure). Once again, we can see that indeed they both have high livestock numbers (which explain their classification into ET2), but display significant differences. Whilst ST1 is using legume and low level of fertilizer use, ST3 is under land pressure and uses higher levels of fertilizer on a crop system dominated by maize. In this case, the statistical typology based on a systems approach could help targeting more accurately the crop or livestock technologies suitable for these farmers, mainly in terms of manure and residue management. Figure 5, and specially number of farmers in ET2, emphasizes the unbalanced number of farmers in expert-typology due to the nature of discriminant key and selected thresholds for each variables. The same reflection applies to ET3 (mixed crop-livestock farms) split between ST1 and ST4 (crop producers), which differ mainly in their income sources, which are balanced between crop and livestock for the former, and 90% from crop for the latter. If crop-livestock technologies are promoted for these farmers, they will impact farming systems very differently as livestock is sold in one case and used for crop in the other. Finally, ET4 (crop oriented farms) is separated into ST1, ST2 and ST4, highlighting that this ‘crop producer expert-type’ is quite widely defined with high intra-type variability. Thus, beyond the incorporation of new variables such as income source or AE in the household into the typology, we can see that thresholds themselves can be dealt differently, as some farmers in statistical livestock type can end up in crop producers’ type in expert typology.

Figure 5. Comparison of results of expert-based typology and statistical typology. Figures in each cell represent the number of farmers belonging to the statistical type (read horizontally) and expert-type (read vertically).
Towards a complementary use of the two approaches
Beyond a dogmatic position arguing for a polarized vision of typology based on expert local knowledge and those based on a statistical tool, we think as Pacini et al. (Reference Pacini, Coluccis, Baudron, Righi, Corbeels, Tittonell and Stefanini2013) and Alvarez et al. (Reference Alvarez, Paas, Descheemaeker, Tittonell and Groot2014) do, that both constructed and extracted types can help in designing an integrative framework to assess diversity of farming systems at different scales and through time. On one hand, expert knowledge is interacting very frequently with households for technical support, to provide expertise, and to collect data. A wide range of stakeholders are thus building knowledge capital based on their daily on-field observations. This knowledge is based on a diachronic vision of farming systems, where experts can also observe visually their diversity and change. On the other hand, a statistical typology is most of the time based on data collection at a single point in time. It only provides a ‘snapshot’ of farming system diversity, but in a more detailed way. Indeed, in spite of their synchronic nature, the main advantage of survey tools compared to expert knowledge is that it includes the environment of farming systems (socio-economic consideration, communities, etc.) as well as special insights on current global concern of agriculture (e.g. few years ago, no baseline distinguished gender in labour distribution as it is the case currently). On the time dimension, we thus see that if large data collection are less frequent, they also give different kind of information which can hardly be collected on a day-to-day basis by expert in the field. Statistical-based typology using large datasets and expert-based typology using field-observation clearly offer complementary perceptions of farming system diversity and its change.
In Southern Ethiopia, as a case study to assess farming system diversity, an expert-based typology based on TLU, Land and TLU per land helped define the main characteristics of farming systems to assess their needs in terms of agricultural technologies. This hypothesis is currently being tested. The statistical typology clearly showed that experts were right on selecting those three indicators to tackle diversity of faming systems and Figure 5 illustrates that expert-based and statistical-based typologies were partially matching, in spite of the important number of additional variables in the latter. Nonetheless, the statistical typology emphasized the importance of factors such as source of income, level of fertilizer used, land allocated to maize or legume and livestock productivity. These factors can allow more accurate targeting of certain technologies. For example, to develop technologies for legume production or even develop fodder crop on land available and not cultivated for farmers selling livestock products.
We can clearly see here the connection between the two approaches and the way to move forward by combining advantages of each methods. First of all, surveys should not be purely project-driven and collect data solely for a given project, but should include local knowledge and on-field partners, who can add their expert-based knowledge into the data collection process. Second, if statistical analyses highlight new drivers of diversity into farming systems, it is crucial that on-field expert update their expert-based typology in their day to day interaction with farmers to take into account these new components, i.e. an active feedback loop. As an example, we saw in our case-study that the source of income or fertilizer use should be included, and the threshold for livestock herd size redefined. We argue that combining expert-based and statistical based typologies in both data collection and analysis is the best way to tackle farming system diversity; but this can only be achieved through frequent interactions between on-field experts and researchers. The approach developed by Falconnier et al. (Reference Falconnier, Descheemaeker, Van Mourik, Sanogo and Giller2015), where a statistical typology is used to select five key variables and identify critical thresholds in order to build a simple decision tree to enhance discussion with farmers and experts, is without a doubt a significant step towards a more participatory approach of typology.
CONCLUSION
In this paper, two typologies have been used as a means to target technologies in a very diverse set of farming systems in southern Ethiopia. Our paper confirmed that the two approaches pursue different objectives and display different perception of diversity. In the expert-based approach, the types are ‘built’ in regards of the final purpose of targeting specific technologies and the assumed drivers of their usefulness and adoption. On the other side, the statistical typology pursues the objective to ‘extract’ types from important dataset, in an assumed ‘blind’ process, putatively more objective and reproducible. In our case-study, we indeed showed that the statistical-based typology emphasized more drivers of diversity and their complex interactions, but expert-based typology demonstrated its usefulness to help on-field expert thanks to a simple discriminant key. Landais (Reference Landais1998) argued that ‘building typologies involves a greater or lesser proportion of heuristic phases [. . .]’ but we argue that a well-defined heuristic process beyond dogmatic approach is necessary to tackle farming systems diversity and therefore optimize this diversity for its agro-ecosystemic and socio-economic benefits.
Acknowledgements
This research was funded by ACIAR (Australian Centre for International Agricultural Research) through the project ‘Sustainable Intensification of Maize-Legume Cropping systems for Food Security in Eastern and Southern Africa’ and by AIFSRC (Australian International Food Security Research Centre) through the project ‘Identifying socioeconomic constraints to and incentives for faster technology adoption: Pathways to sustainable intensification in Eastern and Southern Africa’ (http://aciar.gov.au/aifsc/projects/adoption-pathways). The contribution of David Berre and Santiago Lopez Ridaura to this paper was funded through the CGIAR Research Program CCAFS (Climate Change, Agriculture and Food Security). We are grateful to farmers for their time and their willingness to share information.


 Open access