


Introduction
Parasites within the class Kinetoplastea (commonly referred to as kinetoplastids) comprise unicellular pathogens capable of parasitizing most plant and animal species and severely impacting global health and economic well-being (Jackson et al., Reference Jackson, Otto, Aslett, Armstrong, Bringaud, Schlacht, Hartley, Sanders, Wastling, Dacks, Acosta-Serrano, Field, Ginger and Berriman2016; Filardy et al., Reference Filardy, Kelly and Gluenz2018). Three kinetoplastids infect humans, causing widespread disease: Trypanosoma brucei sp. (human African trypanosomiasis or sleeping sickness), Trypanosoma cruzi (Chagas disease) and Leishmania spp. (leishmaniasis). All three are recognized as neglected tropical diseases (NTDs) by the World Health Organization due to the substantial loss of life and disability caused to those living with the infection. Infection of livestock causes further socio-economic burden due to loss in farming production (Swallow, Reference Swallow1999; Muhanguzi et al., Reference Muhanguzi, Mugenyi, Bigirwa, Kamusiime, Kitibwa, Akurut, Ochwo, Amanyire, Okech, Hattendorf and Tweyongyere2017). This is particularly evident in the ‘tsetse belt’ of sub-Saharan Africa, where there are extensive infections of agricultural animals by T. vivax, T. congolense and, to a lesser extent, T. brucei spp. (Giordani et al., Reference Giordani, Morrison, Rowan, DE Koning and Barrett2016), causing wasting diseases. The evolution of mechanical transmission has allowed T. vivax and T. b. evansi to spread further into South America (Desquesnes et al., Reference Desquesnes, Holzmuller, Lai, Dargantes, Lun and Jittaplapong2013), as well as Asia in the case of T. b. evansi (Payne et al., Reference Payne, Sukanto, Djauhari, Partoutomo, Wilson, Jones, Boid and Luckins1991; Lun et al., Reference Lun1993). T. cruzi and Leishmania spp. are also frequently found in wild and domesticated animals providing major reservoirs for human disease (Mazloumi Gavgani et al., Reference Mazloumi Gavgani, Hodjati, Mohite and Davies2002; Kaszak et al., Reference Kaszak, Planellas and Dworecka-Kaszak2015; Jansen et al., Reference Jansen, Xavier and Roque2018; Medkour et al., Reference Medkour, Davoust, Dulieu, Maurizi, Lamour, Marié and Mediannikov2019). Study of these diverse pathogens has largely been dependent on research with relatively few culture-adapted strains and life cycle stages, mostly the replicative forms of T. b. brucei, many Leishmania spp. and T. cruzi. Methods allowing investigation of non-adapted strains, which may be more virulent and transmissible, will be highly valuable to assess the relevance of this research to disease. Additionally, kinetoplastids are frequently found as heterogeneous populations, such as differentiating life cycle phases (Kramer, Reference Kramer2012), including among diverse host cells (both intra and extracellularly) and various tissues. Some rare life cycle forms have also been reported, such as persister-like cells (Barrett et al., Reference Barrett, Kyle, Sibley, Radke and Tarleton2019) and gametes (Peacock et al., Reference Peacock, Ferris, Sharma, Sunter, Bailey, Carrington and Gibson2011; Gibson and Peacock, Reference Gibson and Peacock2019), and these are often difficult to isolate and characterise. Thus, single-cell transcriptomics could be leveraged to provide important new insights into many aspects of kinetoplastid biology and disease.
Unusually, kinetoplastids lack gene expression control via regulation of transcription initiation for virtually all genes (Campbell et al., Reference Campbell, Thomas and Sturm2003; Kramer, Reference Kramer2012; Clayton, Reference Clayton2016) (with the notable exception of variant surface glycoprotein (VSG) expression by African trypanosomes). Genes are arranged in arrays with common promotor regions and are co-transcribed (Berriman, Reference Berriman2005; Kazemi, Reference Kazemi2011; Berná et al., Reference Berná, Pita, Chiribao, Parodi-Talice, Alvarez-Valin and Robello2019). Coordinated trans-splicing of the 5′ RNA splice leader (SL) cap and polyadenylation generates mature individual transcripts. Thus, kinetoplastids primarily rely on mRNA degradation, storage, translation regulation and protein degradation to regulate gene expression. Nonetheless, population-based transcriptomic analyses have revealed extensive modulation of transcript levels across the cell cycle and life cycle, and during stress response regulation (Cohen-Freue et al., Reference Cohen-Freue, Holzer, Forney and McMaster2007; Geiger et al., Reference Geiger, Simo, Grébaut, Peltier, Cuny and Holzmuller2011; Siegel et al., Reference Siegel, Gunasekera, Cross and Ochsenreiter2011; Cantacessi et al., Reference Cantacessi, Dantas-Torres, Nolan and Otranto2015; Haydock et al., Reference Haydock, Terrao, Sekar, Ramasamy, Baugh and Myler2015; Patino and Ramírez, Reference Patino and Ramírez2017).
Profiling gene expression of individual cells with scRNA-seq allows a more detailed analysis of heterogeneous populations, detection of rare cell types and dissection of developmental processes (Wen and Tang, Reference Wen and Tang2018). Recently, scRNA-seq has been applied to the field of parasitology with exciting results. ‘Cell atlases’ have been complied of the complete Plasmodium berghei (Howick et al., Reference Howick, Russell, Andrews, Heaton, Reid, Natarajan, Butungi, Metcalf, Verzier, Rayner, Berriman, Herren, Billker, Hemberg, Talman and Lawniczak2019) and Toxoplasma gondii (Xue et al., Reference Xue, Theisen, Rastogi, Ferrel, Quake and Boothroyd2020) life cycles, where the transcriptomes of parasites from every life cycle stage have been sequenced and compared. Constructing a computational model of the life cycle with these cells allows gene expression changes across the life cycle to be inferred dynamically and in greater detail than is obtainable by bulk-analysis of mixed populations. Additionally, complete atlases provide a resource that can be mined for cell sub-populations, such as male and female Plasmodium falciparum gametes (Real et al., Reference Real, Howick, Dahalan, Witmer, Cudini, Andradi-Brown, Blight, Davidson, Kumar Dogga, Reid, Baum and Lawniczak2020). These, and other, scRNA-seq data sets have allowed apicomplexan parasitologists to study the dynamic gene expression change during developmental processes, such as the sexual commitment of Plasmodium species and T. gondii tachyzoite to bradyzoite differentiation (Waldman et al., Reference Waldman, Schwarz, Wadsworth, Saeij, Shalek and Lourido2020; Xue et al., Reference Xue, Theisen, Rastogi, Ferrel, Quake and Boothroyd2020), and identify putative novel regulators. Additionally, cells from a query scRNA-seq sample can be mapped to these reference atlases to assess their developmental stage and unique gene expression differences (Howick et al., Reference Howick, Russell, Andrews, Heaton, Reid, Natarajan, Butungi, Metcalf, Verzier, Rayner, Berriman, Herren, Billker, Hemberg, Talman and Lawniczak2019; Real et al., Reference Real, Howick, Dahalan, Witmer, Cudini, Andradi-Brown, Blight, Davidson, Kumar Dogga, Reid, Baum and Lawniczak2020). For example, Howick et al., mapped P. malariae and P. falciparum from clinical samples to the P. berghei life cycle atlas to clearly identify the parasite stages present in the infected patients (Howick et al., Reference Howick, Russell, Andrews, Heaton, Reid, Natarajan, Butungi, Metcalf, Verzier, Rayner, Berriman, Herren, Billker, Hemberg, Talman and Lawniczak2019).
In kinetoplastids, published scRNA-seq studies are currently limited to T. brucei and the whole life cycle has not yet been explored. Expression dynamics during differentiation of slender to stumpy bloodstream forms in the mammal (Briggs et al., Reference Briggs, McCulloch, Matthews and Otto2020), and epimastigote to metacyclic development in the tsetse salivary glands (Vigneron et al., Reference Vigneron, O’Neill, Weiss, Savage, Campbell, Kamhawi, Valenzuela and Aksoy2020), have both been dissected using scRNA-seq. We identified transient expression patterns of several genes unidentified by bulk-RNA-seq analysis and generated a bloodstream form T. brucei reference cell atlas, to which we could map perturbed cells for comparison (Briggs et al., Reference Briggs, McCulloch, Matthews and Otto2020). Vigneron et al., were able to separate the mixed population of parasites present in the tsetse fly salivary glands and highlighted the expression of an invariant family of surface proteins specific to metacyclic stages (Vigneron et al., Reference Vigneron, O’Neill, Weiss, Savage, Campbell, Kamhawi, Valenzuela and Aksoy2020). Expression switching of the monoallelic expressed VSGs in bloodstream form T. brucei parasites has also been investigated using scRNA-seq (Müller et al., Reference Müller, Cosentino, Förstner, Guizetti, Wedel, Kaplan, Janzen, Arampatzi, Vogel, Steinbiss, Otto, Saliba, Sebra and Siegel2018). We additionally found scRNA-seq a powerful method for detailing gene expression dynamics during the T. brucei cell cycle (Briggs et al., Reference Briggs, McCulloch, Matthews and Otto2020), as have others for P. falciparum (Reid et al., Reference Reid, Talman, Bennett, Gomes, Sanders, Illingworth, Billker, Berriman and Lawniczak2018) and T. gondii (Xue et al., Reference Xue, Theisen, Rastogi, Ferrel, Quake and Boothroyd2020).
Several reviews have detailed the choices in technology (Ziegenhain et al., Reference Ziegenhain, Vieth, Parekh, Reinius, Guillaumet-Adkins, Smets, Leonhardt, Heyn, Hellmann and Enard2017); Svensson et al., Reference Svensson, Natarajan, Ly, Miragaia, Labalette, Macaulay, Cvejic and Teichmann2017; Hwang et al., Reference Hwang, Lee and Bang2018; Lafzi et al., Reference Lafzi, Moutinho, Picelli and Heyn2018; Chen et al., Reference Chen, Ning and Shi2019; Natarajan et al., Reference Natarajan, Miao, Jiang, Huang, Zhou, Xie, Wang, Qin, Zhao, Wu, Yang, Li, Hou, Liu and Teichmann2019), associated costs (Ziegenhain et al., Reference Ziegenhain, Vieth, Parekh, Reinius, Guillaumet-Adkins, Smets, Leonhardt, Heyn, Hellmann and Enard2017); Natarajan et al., Reference Natarajan, Miao, Jiang, Huang, Zhou, Xie, Wang, Qin, Zhao, Wu, Yang, Li, Hou, Liu and Teichmann2019) and data processing methods (Vallejos et al., Reference Vallejos, Risso, Scialdone, Dudoit and Marioni2017; Hwang et al., Reference Hwang, Lee and Bang2018; Chen et al., Reference Chen, Ning and Shi2019; Luecken and Theis, Reference Luecken and Theis2019; Vieth et al., Reference Vieth, Parekh, Ziegenhain, Enard and Hellmann2019) involved in single-cell transcriptomics, and more options are likely to become available as the field evolves. Here, we review methods reported to date with protozoan parasites and their potential application to kinetoplastid research.
Methodology and challenges
Method selection
Common steps required for scRNA-seq include the isolation of individual cells, lysis to release RNA, barcoding of transcripts with specialized library adaptors, reverse transcription to generate cDNA, and cDNA amplification (summarised in Fig. 1). The result is a library suitable for next-generation sequencing. However, technologies vary in how these steps are achieved. Importantly, the endpoint data captured will vary between technologies and so which is the most applicable will often be dictated by the biological question being addressed. Aspects to consider include the level of expression of the gene(s) of interest, the occurrence of rare cell types within a sample, the sequence similarity between members of the same gene families under investigation, and the effect of preparation methods on parasite viability.
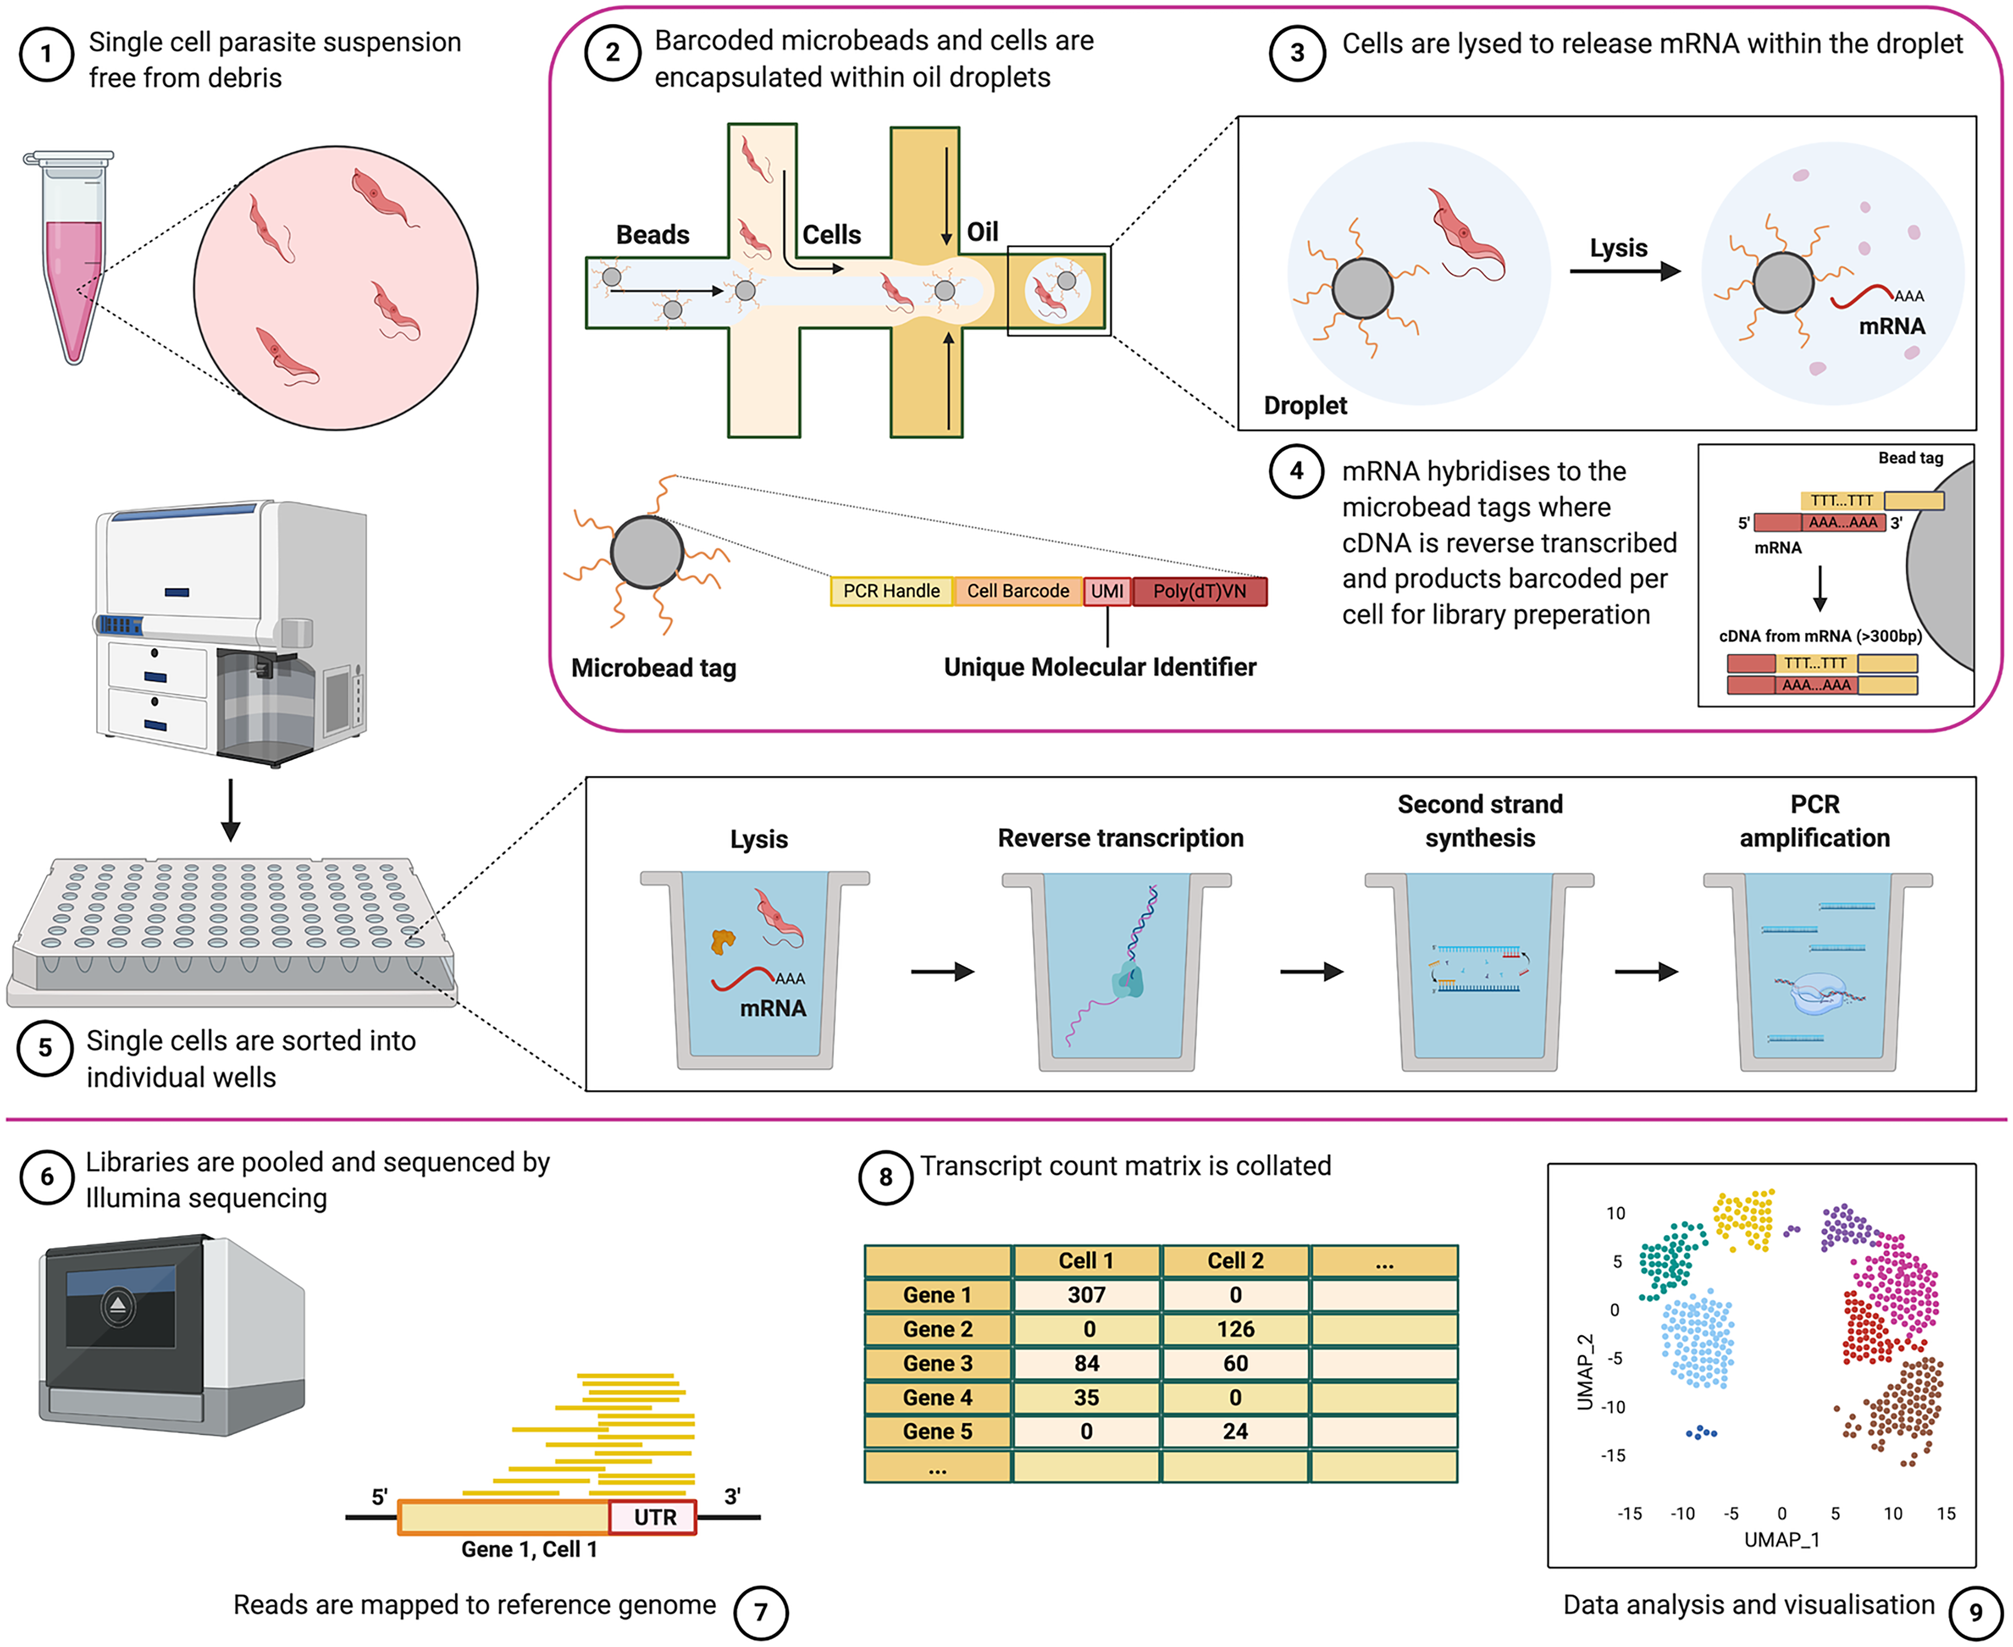
Fig. 1. Overview of the scRNA-seq experimental approach. Single parasites, suspended free from debris and containing ideally >90% viable cells, (1) can be captured individually with barcoded library adaptors and lysis buffer either via droplet-based technology (2) or by sorting into individual plate-wells (5). Cells are then lysed (3) and polyadenylated RNA is reverse transcribed with barcode adaptors into cDNA and amplified (4). The resultant library is then sequenced by next-generation sequencing (6). Reads are mapped to the reference genome (7), and unique reads mapping to each gene are counted to generate raw transcript counts per gene, per cell (8). Quality control filtering, pre-processing and final analysis can then be performed (9). See Fig. 4 for an analysis overview. Note, Seq-well, which uses microarrays to capture cells, is not described in this figure but has been used to study T. gondii parasites (Waldman et al., Reference Waldman, Schwarz, Wadsworth, Saeij, Shalek and Lourido2020) (created with BioRender.com).
All scRNA-seq approaches aim to isolate the RNA of an individual cell and label transcripts with the same uniquely barcoded library adaptor. Each cell is isolated and once lysed, the released polyadenylated transcripts ligate to these adaptors and are labelled with the unique barcode, allowing the user to identify transcripts that originated from the same cell. The most widely used methods can be broadly grouped as droplet-based or plate-based, including droplet capture techniques Drop-seq (Poran et al., Reference Poran, Nötzel, Aly, Mencia-Trinchant, Harris, Guzman, Hassane, Elemento and Kafsack2017) and Chromium (Howick et al., Reference Howick, Russell, Andrews, Heaton, Reid, Natarajan, Butungi, Metcalf, Verzier, Rayner, Berriman, Herren, Billker, Hemberg, Talman and Lawniczak2019; Sà et al., Reference Sà, Cannon M, Caleon, Wellems and Serre2020; Vigneron et al., Reference Vigneron, O’Neill, Weiss, Savage, Campbell, Kamhawi, Valenzuela and Aksoy2020), and the popular plate-based method, SMART-seq2 (Müller et al., Reference Müller, Cosentino, Förstner, Guizetti, Wedel, Kaplan, Janzen, Arampatzi, Vogel, Steinbiss, Otto, Saliba, Sebra and Siegel2018; Ngara et al., Reference Ngara, Palmkvist, Sagasser, Hjelmqvist, Björklund, Wahlgren, Ankarklev and Sandberg2018; Reid et al., Reference Reid, Talman, Bennett, Gomes, Sanders, Illingworth, Billker, Berriman and Lawniczak2018; Howick et al., Reference Howick, Russell, Andrews, Heaton, Reid, Natarajan, Butungi, Metcalf, Verzier, Rayner, Berriman, Herren, Billker, Hemberg, Talman and Lawniczak2019; Xue et al., Reference Xue, Theisen, Rastogi, Ferrel, Quake and Boothroyd2020). The former methods encapsulate each cell with an adaptor-coated bead using microfluidics, whereas the latter sort cells into individual wells of plates along with the unique barcoded adaptors. Alternative plate-based assays include SCRB-seq (Soumillon et al., Reference Soumillon, Cacchiarelli, Semrau, van Oudenaarden and Mikkelsen2014) and the NEBNext® Single Cell/Low Input RNA Library Prep Kit for Illumina® (New England Biolabs Inc. n.d.), both of which have been used to study P. falciparum (Brancucci et al., Reference Brancucci, De Niz, Straub, Ravel, Sollelis, Birren, Voss, Neafsey and Marti2018; Real et al., Reference Real, Howick, Dahalan, Witmer, Cudini, Andradi-Brown, Blight, Davidson, Kumar Dogga, Reid, Baum and Lawniczak2020). Detailed summaries of the available methods can be found in reviews elsewhere (Haque et al., Reference Haque, Engel, Teichmann and Lönnberg2017; Hwang et al., Reference Hwang, Lee and Bang2018). The primary difference between these groups of methods is a trade-off between the higher throughput droplet-based technologies, which capture more cells per experiment, and the higher coverage of plate-based methods, which capture a greater number of transcripts per cell (Table 1). Even a greater number of cells can be captured with the microwell array-based method, Seq-well S3 (Hughes et al., Reference Hughes, Wadsworth, Gierahn, Do, Weiss, Andrade, Ma, de Andrade Silva, Shao, Tsoi, Ordovas-Montanes, Gudjonsson, Modlin, Love and Shalek2020), which outperforms Chromium and Drop-seq in terms of the number of parasites recovered (Table 1).
Table 1. Comparison of scRNA-seq experiments described with protozoan parasites
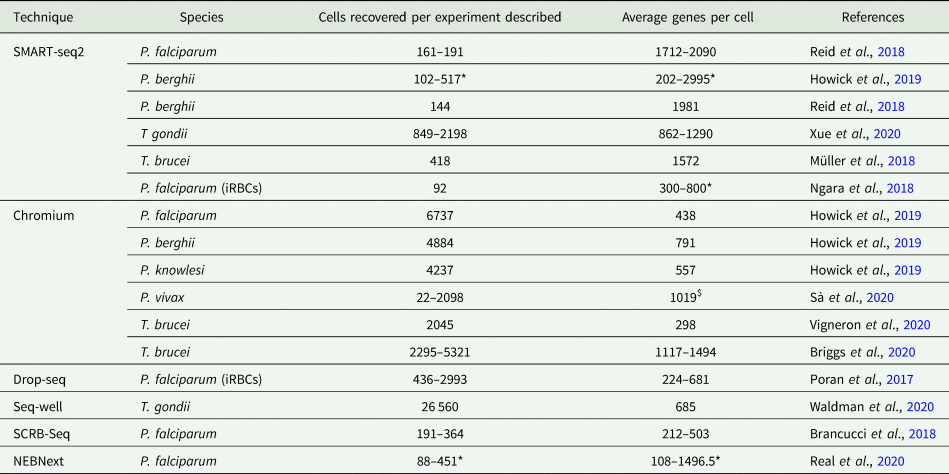
For each experiment, the method and species are given. iRBCs indicate the infected red blood cells were analysed without releasing parasites beforehand. The number of cells recovered after quality control filtering is given per experiment, as reported by the authors.
The asterisk indicates exceptions where the numbers of cell recovered are given for each life cycle stage studied. The average is given for the genes recovered per cell for each experiment or life cycle stage (asterisk), except where the dollar indicates the average of all experiments. NEBNext refers to NEBNext Single Cell/Low Input RNA Library Prep Kit for Illumina (New England Biolabs Inc.).
As only a small number of the total transcripts are recovered per cell with scRNA-seq, the lowest expressed genes are unlikely to be captured. If the aim is to characterize gene expression change for as many genes as possible, or target genes of interest that have known low expression, then a high-coverage approach may be necessary. Some cell types also have low RNA content [e.g. Plasmodium ring stages (Poran et al., Reference Poran, Nötzel, Aly, Mencia-Trinchant, Harris, Guzman, Hassane, Elemento and Kafsack2017; Howick et al., Reference Howick, Russell, Andrews, Heaton, Reid, Natarajan, Butungi, Metcalf, Verzier, Rayner, Berriman, Herren, Billker, Hemberg, Talman and Lawniczak2019) and T. brucei metacyclics (Vigneron et al., Reference Vigneron, O’Neill, Weiss, Savage, Campbell, Kamhawi, Valenzuela and Aksoy2020)] and may require more sensitive approaches. In the protozoan parasite studies discussed here, SMART-seq2 frequently recovered the most genes per cell (Table 1). The plate-based method SCRB-seq (Soumillon et al., Reference Soumillon, Cacchiarelli, Semrau, van Oudenaarden and Mikkelsen2014) has also been used to study protozoan parasites (P. falciparum) (Brancucci et al., Reference Brancucci, De Niz, Straub, Ravel, Sollelis, Birren, Voss, Neafsey and Marti2018), and although the number of genes captured per cell was lower compared to the SMART-seq2 analysis of extracted P. falciparum (Reid et al., Reference Reid, Talman, Bennett, Gomes, Sanders, Illingworth, Billker, Berriman and Lawniczak2018), insight into sexual commitment was still gained. NEB also offers a single cell/low input RNA Illumina library preparation kit (New England Biolabs Inc.), which Real et al., used to perform scRNA-seq of P. falciparum and documented the parasite's journey through the mosquito in detail (Real et al., Reference Real, Howick, Dahalan, Witmer, Cudini, Andradi-Brown, Blight, Davidson, Kumar Dogga, Reid, Baum and Lawniczak2020). These methods all rely on assays being performed in 96- or 384-well plates, limiting the number of cells that can be analysed. If the aim is to characterize a cell type of interest that appears as a low or unknown proportion of the sampled population, then a higher throughput method may be preferable, such as Chromium, Drop-seq or Seq-well (Table 1). Only one available study has used Seq-well to study protozoan parasites; Waldman et al., profiled 26,560 T. gondii parasites, recovering an average of 685 genes comparable with other droplet-based methods, but fewer than the SMART-seq2 analysis of T. gondii in similar culture conditions (862–1290 average genes per cell; Table 1).
Preparation methods (see below) will also impact the number of transcripts recovered. For example, slender and stumpy bloodstream form T. brucei prepared in culture (Briggs et al., Reference Briggs, McCulloch, Matthews and Otto2020) resulted in greater recovery of transcripts compared to T. brucei stages extracted from the tsetse salivary gland (Vigneron et al., Reference Vigneron, O’Neill, Weiss, Savage, Campbell, Kamhawi, Valenzuela and Aksoy2020), despite both studies employing Chromium technology (Table 1). Notably, NEB reports more than three times greater recovery of transcripts compared to SMART-seq2 with the NEBNext® kit for low input RNA (New England Biolabs Inc. n.d.). The studies discussed here (Table 1) can aid users in selecting an appropriate method, considering the depth and cell number required to answer the biological question, in the context of the cell type and the necessary sample preparation steps.
Importantly, most methods (including Drop-seq, 3′ chemistry Chromium kits, Seq-well and SCRB-seq) only sequence the 3′ end of transcripts, whereas SMART-seq2 and NEBNext® sequence full-length transcripts. This consideration can be important, for instance, for studying highly similar paralog families where the 3′ end sequences may be indistinguishable, such as VSGs in T. brucei (Müller et al., Reference Müller, Cosentino, Förstner, Guizetti, Wedel, Kaplan, Janzen, Arampatzi, Vogel, Steinbiss, Otto, Saliba, Sebra and Siegel2018), var genes of Plasmodium species (Reid et al., Reference Reid, Talman, Bennett, Gomes, Sanders, Illingworth, Billker, Berriman and Lawniczak2018) and SAG1-related sequences (SRS) of T. gondii (Xue et al., Reference Xue, Theisen, Rastogi, Ferrel, Quake and Boothroyd2020). Full-length transcripts are also key to studying splicing variation. However, kinetoplastids lack cis-splicing for all but a few genes (Campbell et al., Reference Campbell, Thomas and Sturm2003; Liang et al., Reference Liang, Haritan, Uliel and Michaeli2003) and so this is not a concern for scRNA-seq studies with these parasites.
Cost and equipment availability will undoubtably also impact choice. Drop-seq can be compiled in-house, whereas Chromium technology requires the Chromium controller instrument to encapsulate single cells with barcoded beads. Although, Drop-seq may require more thorough optimization than the commercialized Chromium method. Seq-well, SMART-seq2 and SCRB-seq only need microarrays or plates to separate individual cells; although manual picking can be used, cell sorting machinery is often required to place cells into each well (Hu et al., Reference Hu, Zhang, Xin and Deng2016). The cost of scRNA-seq experiments is largely determined by the high price of library preparation consumables, reviewed here (Ziegenhain et al., Reference Ziegenhain, Vieth, Parekh, Reinius, Guillaumet-Adkins, Smets, Leonhardt, Heyn, Hellmann and Enard2017)). Notably, SCRB-seq (Soumillon et al., Reference Soumillon, Cacchiarelli, Semrau, van Oudenaarden and Mikkelsen2014) employed by Brancucci et al. was highly cost affective, at ~$30 per cell (Brancucci et al., Reference Brancucci, De Niz, Straub, Ravel, Sollelis, Birren, Voss, Neafsey and Marti2018). In the case of high-throughput droplet-based methods, the cost can be reduced by mixing species with distinct transcriptomes that can be easily separated bioinformatically (Tung et al., Reference Tung, Blischak, Hsiao, Knowles, Burnett, Pritchard and Gilad2017; Kang et al., Reference Kang, Subramaniam, Targ, Nguyen, Maliskova, McCarthy, Wan, Wong, Byrnes, Lanata, Gate, Mostafavi, Marson, Zaitlen, Criswell and Ye2018), as has been done with P. berghei and P. knowlesi (Reid et al., Reference Reid, Talman, Bennett, Gomes, Sanders, Illingworth, Billker, Berriman and Lawniczak2018; Howick et al., Reference Howick, Russell, Andrews, Heaton, Reid, Natarajan, Butungi, Metcalf, Verzier, Rayner, Berriman, Herren, Billker, Hemberg, Talman and Lawniczak2019), and T. brucei and L. mexicana (Briggs et al., Reference Briggs, McCulloch, Matthews and Otto2020; Warren et al., unpublished). This approach also allows a doublet rate to be calculated (see below). Seq-well (Gierahn et al., Reference Gierahn, Wadsworth, Hughes, Bryson, Butler, Satija, Fortune, Love and Shalek2017) and updated ‘Seq-well S3’ (Hughes et al., Reference Hughes, Wadsworth, Gierahn, Do, Weiss, Andrade, Ma, de Andrade Silva, Shao, Tsoi, Ordovas-Montanes, Gudjonsson, Modlin, Love and Shalek2020) offer a comparable cost per read sequenced to Chromium v3, but has the advantage that it avoids the need to purchase Chromium instruments (Hughes et al., Reference Hughes, Wadsworth, Gierahn, Do, Weiss, Andrade, Ma, de Andrade Silva, Shao, Tsoi, Ordovas-Montanes, Gudjonsson, Modlin, Love and Shalek2020). Sample labelling may also allow a further cost reduction in the future by multiplexing; for instance, methods such as CITE-seq (Stoeckius et al., Reference Stoeckius, Hafemeister, Stephenson, Houck-Loomis, Chattopadhyay, Swerdlow, Satija and Smibert2017) or cell hashing (Stoeckius et al., Reference Stoeckius, Zheng, Houck-Loomis, Hao, Yeung, Mauck, Smibert and Satija2018) rely on oligo-labelled antibodies that target expressed surface proteins and are captured with the individual cells they bind to. In the library preparation and sequencing steps, the sample barcode is captured along with the cell barcode, allowing transcripts to be traced to both the individual cell and the sample to which the cell belongs. In kinetoplastids, these approaches are more problematic, as commercial barcoded antibodies are not available, life cycle stages express unique surface proteins (Valente et al., Reference Valente, Castillo-Acosta, Vidal and González-Pacanowska2019), and several prominent surface antigens are expressed from highly variable gene families, limiting options to generate in-house barcoded antibodies. MULTI-seq allows multiplexing of most cells by incorporating lipid-modified oligopeptides (LMOs) (McGinnis et al., Reference McGinnis, Patterson, Winkler, Conrad, Hein, Srivastava, Hu, Murrow, Weissman, Werb, Chow and Gartner2019a) into the plasma membrane, and so will likely be highly useful for sample labelling and cost-cutting in kinetoplastid research.
Sample preparation
Irrespective of the method of scRNA-seq chosen, each sample should be a single cell suspension free from debris, where ideally at least 90% of the population are viable. Dead cells release cytoplasmic RNA into the sample, meaning a significant number of dying cells will result in both the poor capture of transcripts and the potential for contamination of all living cell transcriptomes with the free mRNA (Yang et al., Reference Yang, Corbett, Koga, Wang, Johnson, Yajima and Campbell2020). Thus, the isolation of viable cells is critical. Cells that have clumped together will likely be labelled with the same barcode, meaning two distinct cell types could be considered as one during analysis. These limitations can be corrected downstream (see below), although cell clumps in the sample often prevent the formation of droplets, if using such methods, stopping the isolation of single cells.
Sample preparation is most easily achieved with extracellular parasites grown in culture, thus these conditions are most likely to result in the capture of high-quality transcriptomes, such as with bloodstream form T. brucei (Müller et al., Reference Müller, Cosentino, Förstner, Guizetti, Wedel, Kaplan, Janzen, Arampatzi, Vogel, Steinbiss, Otto, Saliba, Sebra and Siegel2018; Briggs et al., Reference Briggs, McCulloch, Matthews and Otto2020). Here, the preparation may be as simple as washing and suspending cells in an appropriate buffer, such as PBS supplemented with glucose, to maintain viability. Isolation of extracellular forms from the host for in vivo studies will depend on the particular experiment (Vigneron et al., Reference Vigneron, O’Neill, Weiss, Savage, Campbell, Kamhawi, Valenzuela and Aksoy2020). In this case, methods need to be optimized to ensure sufficient parasites are captured and cellular stress is minimized. Plate-based approaches will likely, additionally, require fluorescence-activated cell sorting (FACS) for cells to be sorted into individual wells, the impact of which on cellular stress and gene expression should be considered. Interestingly, FACS can also be leveraged to gain additional information of the cells before lysing; for instance, cell types can be quantified and enriched for if stained with specific fluorophore-conjugated antibodies. Furthermore, staining information and the plate position of positive cells can be recorded for subsequent association with the sequenced transcriptome (Paul et al., Reference Paul, Arkin, Giladi, Jaitin, Kenigsberg, Keren-Shaul, Winter, Lara-Astiaso, Gury, Weiner, David, Cohen, Lauridsen, Haas, Schlitzer, Mildner, Ginhoux, Jung and Trumpp2015).
In the case of intracellular life cycle stages (such as amastigote Leishmania and T. cruzi), scRNA-seq may be applied directly to the infected host cells. However, detection of the parasite-derived transcripts may be reduced due to the volume of host transcripts and individual parasites infecting the same host will not be distinguishable. The intracellular parasites could instead be extracted prior to scRNA-seq sample preparation. Single-cell analysis for kinetoplastids isolated from host cells has not been published to date, but has been used for apicomplexans: blood-stage Plasmodium spp (Reid et al., Reference Reid, Talman, Bennett, Gomes, Sanders, Illingworth, Billker, Berriman and Lawniczak2018; Howick et al., Reference Howick, Russell, Andrews, Heaton, Reid, Natarajan, Butungi, Metcalf, Verzier, Rayner, Berriman, Herren, Billker, Hemberg, Talman and Lawniczak2019) and T. gondii from human host cells (Waldman et al., Reference Waldman, Schwarz, Wadsworth, Saeij, Shalek and Lourido2020; Xue et al., Reference Xue, Theisen, Rastogi, Ferrel, Quake and Boothroyd2020). Cellular stresses caused by these methods need to be considered and potentially tested. Interestingly, Poran et al., applied Drop-seq to P. falciparum infected red blood cells (iRBCs) without extracting parasites with encouraging results (224–681 average genes per cell). However, this method required each sample to be checked manually by microscopy for the number of parasites infecting each RBC to ensure >95% of iRBCs contained only one parasite (Poran et al., Reference Poran, Nötzel, Aly, Mencia-Trinchant, Harris, Guzman, Hassane, Elemento and Kafsack2017). Ngara et al., used SMART-seq2 to profile iRBCs and recovered similar transcript levels (average of 300–800 per cell depending on P. falciparum life cycle stage). Here, the authors were able to confirm only one parasite was present in each iRBC by staining with MitoTracker dye and cell sorting (Ngara et al., Reference Ngara, Palmkvist, Sagasser, Hjelmqvist, Björklund, Wahlgren, Ankarklev and Sandberg2018). Similar approaches will be useful for kinetoplastid research where extraction of parasites from host cells is difficult and therefore likely to significantly affect parasite viability and gene expression.
If it is not possible to use live cells, such as for clinical samples or time point preservation, cells may be cryopreserved with the cryoprotectant dimethyl-sulfoxide (DMSO) without affecting gene expression (Guillaumet-Adkins et al., Reference Guillaumet-Adkins, Rodríguez-Esteban, Mereu, Mendez-Lago, Jaitin, Villanueva, Vidal, Martinez-Marti, Felip, Vivancos, Keren-Shaul, Heath, Gut, Amit, Gut and Heyn2017; Wohnhaas et al., Reference Wohnhaas, Leparc, Fernandez-Albert, Kind, Gantner, Viollet, Hildebrandt and Baum2019). Alternatively, cells can be fixed with methanol, stored and subsequently rehydrated for analysis (Chen et al., Reference Chen, Chen, Cheung, Shi, Zhou and Lu2018), although comparisons with mammalian cells have found this method less favourable than cryofreezing (Wohnhaas et al., Reference Wohnhaas, Leparc, Fernandez-Albert, Kind, Gantner, Viollet, Hildebrandt and Baum2019). We ran a Chromium analysis of bloodstream from T. brucei fixed in methanol, following protocols from 10x Genomics, and sequenced ~30,000 reads per cell (Fig. 2). The percentage of cells recovered after quality control (QC) filtering (discussed below) was only 9.02% for fixed parasites vs 46.55% for live parasites. Although the percentage of kDNA and rRNA transcripts per cell (used for QC, discussed below; Fig. 2B and C) was similar in live and fixed samples, the number of genes per cell and unique transcripts (unique molecular identifiers; UMIs) per cell were dramatically reduced in the fixed sample (Fig. 2A). The effects of these differences meant that no clear grouping of slender and stumpy forms was detected in the fixed parasites, unlike in live parasites (Fig. 2D and E). Methanol preserved P. falciparum and P. malariae clinical samples have been profiled (Howick et al., Reference Howick, Russell, Andrews, Heaton, Reid, Natarajan, Butungi, Metcalf, Verzier, Rayner, Berriman, Herren, Billker, Hemberg, Talman and Lawniczak2019). Here, SMART-seq2 was used and resulted in more genes per cell being detected [630–1355 median genes per cell, dependant on life cycle stage (Howick et al., Reference Howick, Russell, Andrews, Heaton, Reid, Natarajan, Butungi, Metcalf, Verzier, Rayner, Berriman, Herren, Billker, Hemberg, Talman and Lawniczak2019)] compared with our Chromium analysis of fixed T. brucei (163 median cells per cell; Fig. 2A). However, relatively few P. falciparum and P. malariae transcriptomes were successfully profiled using fixed parasites, with just 2% and 45% of the starting cell number of early and late blood stages reaching quality control cut-offs, respectively (Howick et al., Reference Howick, Russell, Andrews, Heaton, Reid, Natarajan, Butungi, Metcalf, Verzier, Rayner, Berriman, Herren, Billker, Hemberg, Talman and Lawniczak2019). Comparison and optimization of fixed and cryostored samples will undoubtedly open new options for single-cell analysis of kinetoplastids in the future.
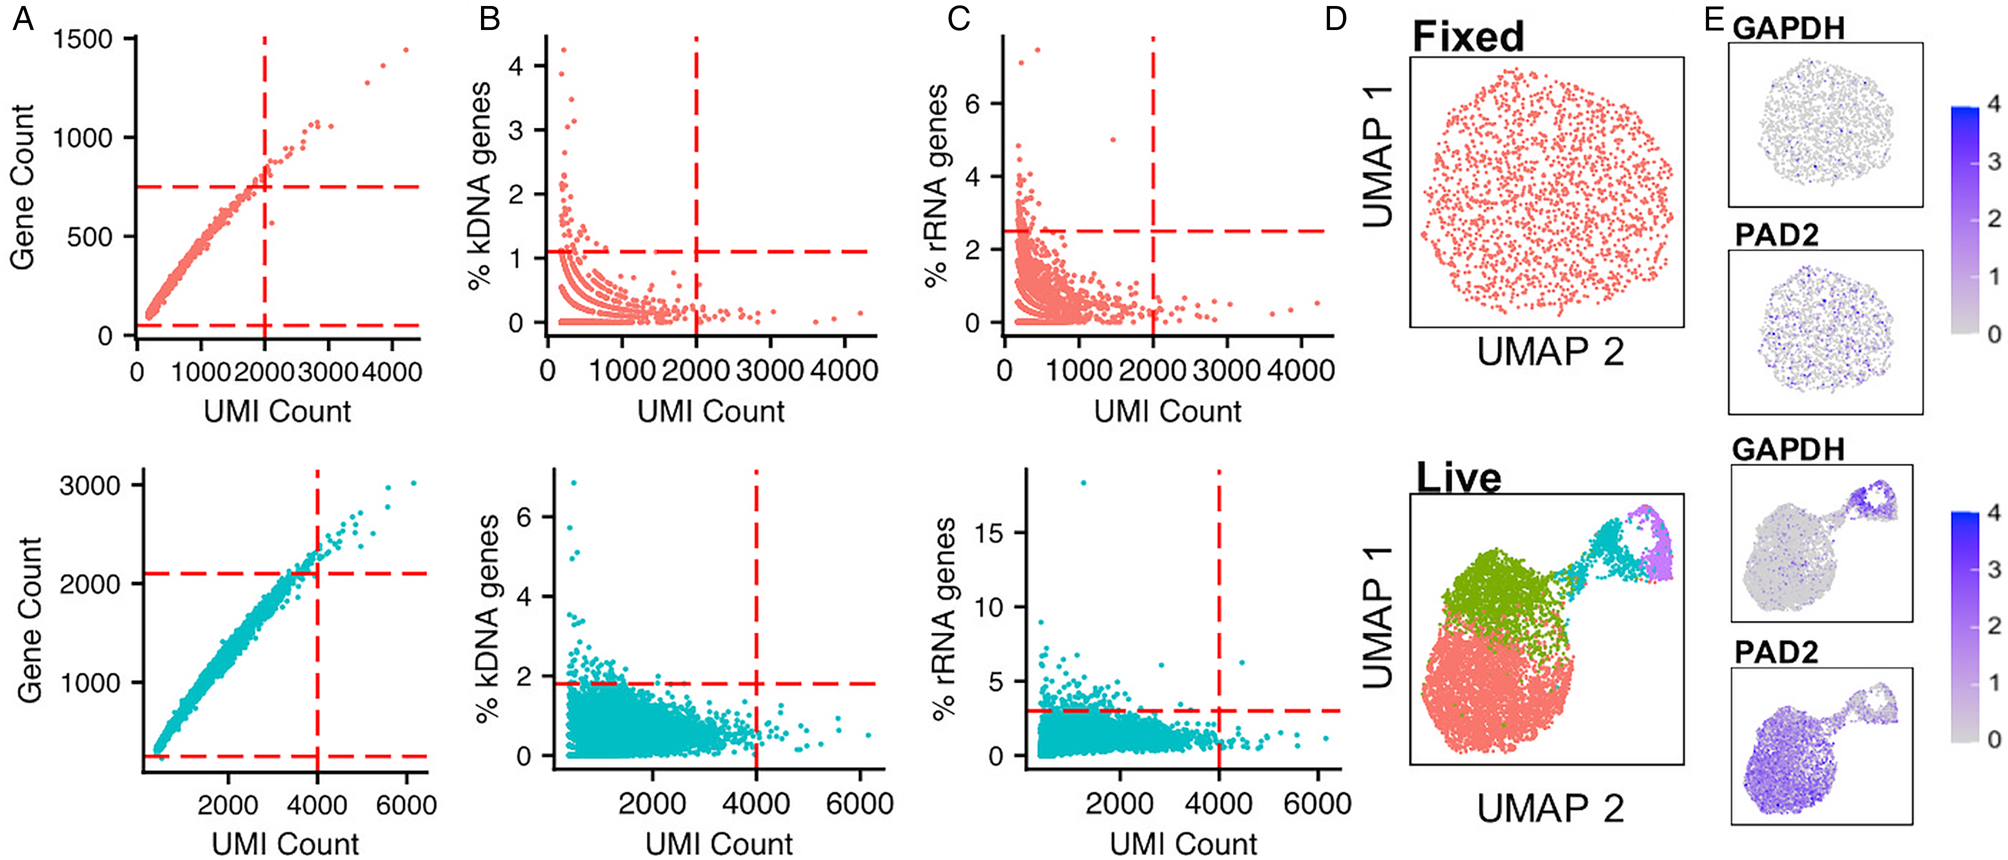
Fig. 2. Comparison of methanol fixed and live T. brucei Chromium scRNA-seq data. Methanol fixed (20,000 cells; 1,804 recovered) and live (15,000 cells; 6,938 recovered) T. brucei bloodstream form parasites were previously subjected to Chromium scRNA-seq to a depth of ~30,000 reads per cell (Briggs et al., Reference Briggs, McCulloch, Matthews and Otto2020). (A) UMI (unique molecular identifier;x-axis) and gene (y-axis) per cell counts for methanol fixed (above, red) and live (below, blue) cells. Each point is one cell. The red dashed line indicates the QC threshold used for filtering each sample. (B) As in a, where the percentage of transcripts aligning to the maxi circle kDNA sequence is used as a QC threshold (y-axis). (C) As in a, with a percentage of transcripts aligning to rRNA genes used as a QC threshold (y-axis). (D) UMAPs of each sample (methanol-fixed above, live below), generated as described previously (Briggs et al., Reference Briggs, McCulloch, Matthews and Otto2020) using an identifical method and parameters, with the expections of the QC thresholds indicated in a, b and c. Each data point is one cell coloured by the cluster identity, where each cluster is a group of cells with similar transcriptomic profiles. Colours are not transferred between plots. (E) UMAP plots of cells coloured by expression of one slender marker gene (GAPDH; Tb927.6.4280) and one stumpy marker gene (PAD2; Tb927.7.5940). The scale shows the raw transcript count per cell.
Sequencing and read mapping
Sequencing depth also impacts the analysis of scRNA-seq, as increasing depth will increase the number of unique transcripts returned. Although increasing sequencing depth will therefore increase the information captured, the proportion of newly captured transcripts to sequencing reads will decrease with increasing depth (Fig. 3A). Thus, it is advisable to perform rounds of sequencing and analyse the return of unique transcripts with each round to balance the cost of extensive sequencing and data recovered. The cell ranger tool [10x Genomics (10x Genomics, 2020a)] estimates the unique transcripts to reads mapped ratio, termed sequencing saturation, to guide the user. As it is not possible to uniquely map short-read sequencing to repetitive genomic regions, a large proportion of reads sequenced may be unusable when working with highly repetitive genomes. Thus, calculations should consider confidently mapped reads and greater sequencing depth may be required in these cases. We tested the effect of sequencing depth on the identification of clusters and variable genes using bloodstream form T. brucei Chromium data (Briggs et al., Reference Briggs, McCulloch, Matthews and Otto2020). The return of new transcripts for increased sequencing depth (sequencing saturation) is shown in Fig. 3A. Sequencing to a total depth of 52 ,971 mean reads per cell was performed (Briggs et al., Reference Briggs, McCulloch, Matthews and Otto2020). After selecting different proportions (0.1, 0.25, 0.5 and 0.75) of these total mapped reads by downsampling, we found the mean genes per cell increased from 1,046 when using ~5,000 read per cells, to 1,121 with all reads (~50,000) per cell (Fig. 3A). The increase in mean UMIs per cell was greater, increasing from 1,324 to 1,680 (Fig. 3B). This increase translated into an increased number of clusters being identified (when using a clustering resolution of 0.35 in all cases; Fig. 3D) and revealed far more differentially expressed genes between clusters (Fig. 3C). Hence, sequencing depth can have a large impact on the biological conclusions that can be drawn from the data.
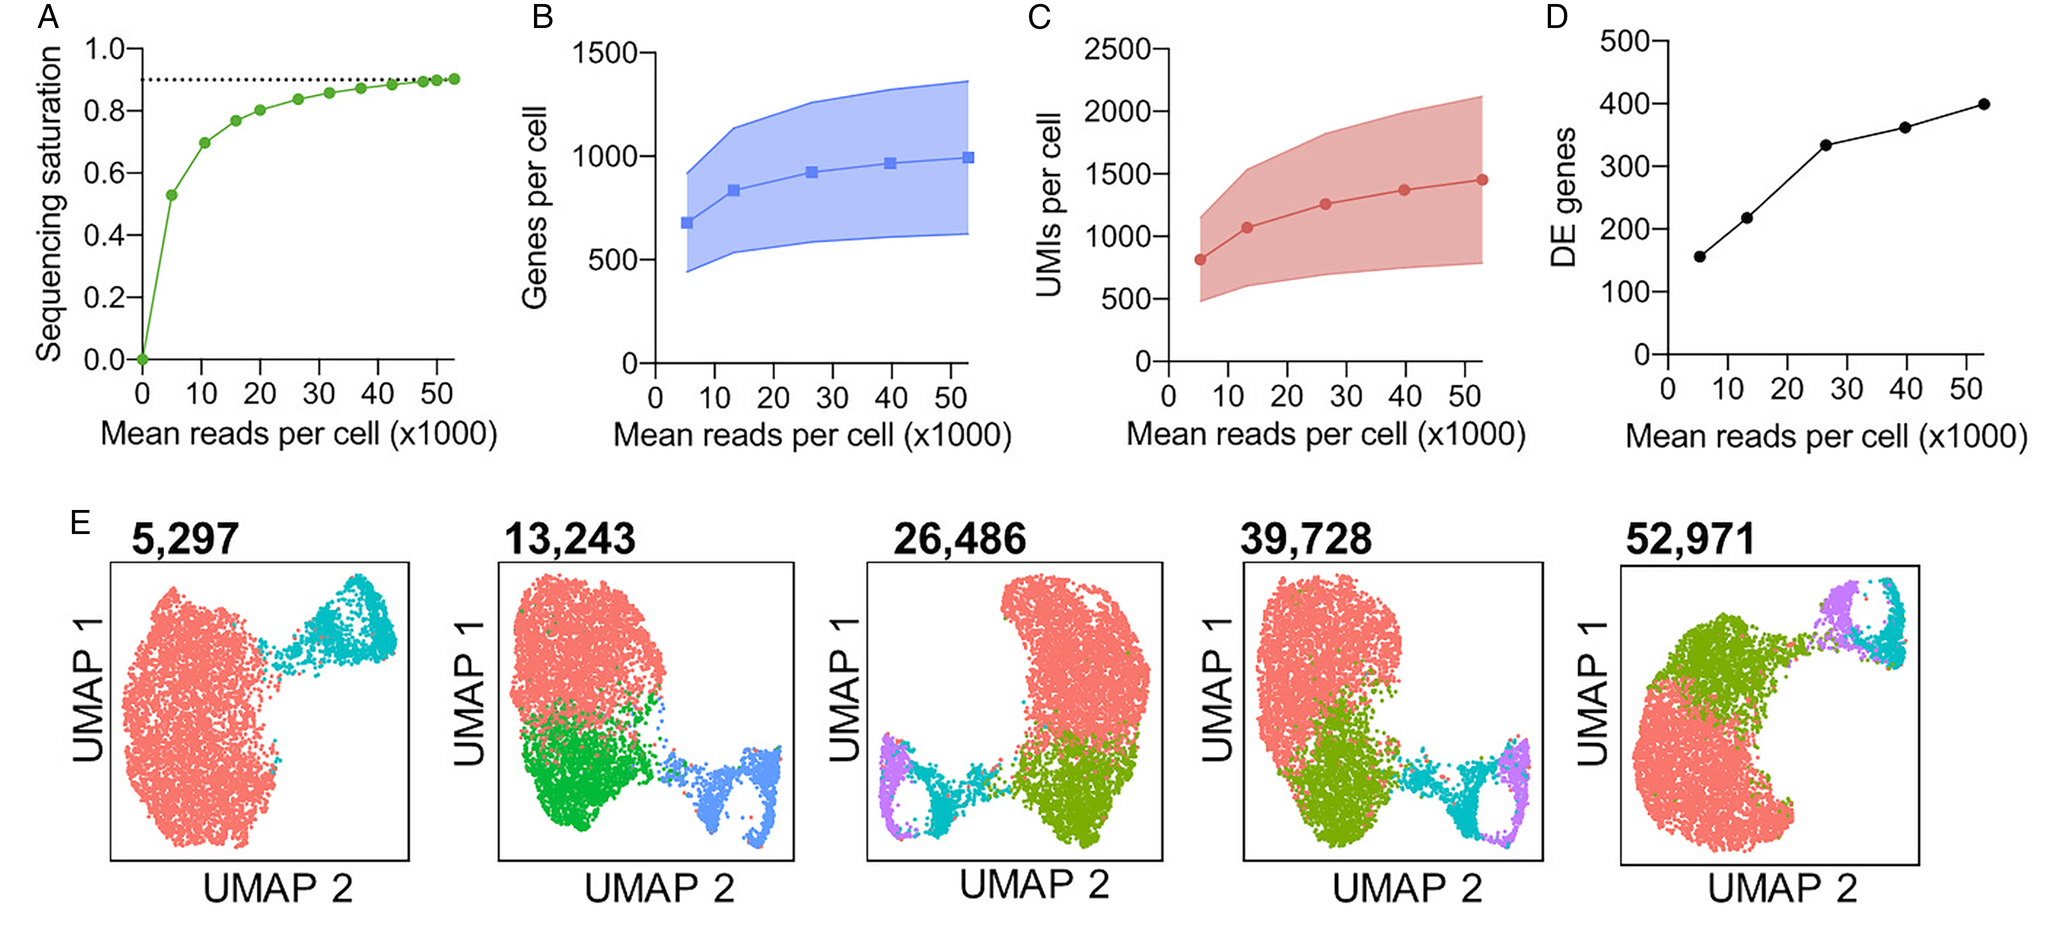
Fig. 3. Evaluation of sequencing depth impact on cluster identification and differential gene expression analysis. T. brucei bloodstream form (Briggs et al., Reference Briggs, McCulloch, Matthews and Otto2020) cells were previous subjected to Chromium scRNA-seq (Briggs et al., Reference Briggs, McCulloch, Matthews and Otto2020) to a depth of 52,971 mean reads per cell. (A) Sequencing saturation [1−(number of unique reads/number of total mapped reads)] as calculated by cell ranger (10x Genomics, 2020a) for between 5,000 and 52,971 mean reads per cell. The dashed line is equal to 0.9 (90%) sequence saturation. (B) Median genes per cell for total sequencing (52,971 mean reads per cell) and four downsampled data sets. The shaded area shows standard deviation (SD.) from the mean for all cells after QC filtering to remove cells with <500 unique transcripts. (C) The median number of unique transcripts (UMIs) per cell for each data set, shaded area shows SD (D) Number of differentially expressed (DE) genes identified between clusters shown in e, using MAST (Finak et al., Reference Finak, Guimarães-Pinto, Nunes, Zukeram, Fliess, Pereira, Oliveira Nascimento, Conde and Morrot2015). (E) UMAP plots of each data set. Each data point is one cell coloured by cluster identified with the same parameters (resolution = 0.35). Colours are not transferred between plots. Mean reads per cell for each data set are indicated above in bold. The analysis was performed as described previously (Briggs et al., Reference Briggs, McCulloch, Matthews and Otto2020).
Like all genomics and transcriptomic studies, only uniquely mapping reads should be considered. Additionally, controls are needed to remove duplicate reads generated during the cDNA amplification steps of library preparation. Many technologies label individual transcripts with unique barcodes (in addition to cellular barcodes) before any amplification. Hence, replicate transcripts will be identical in the mapping transcript sequence and unique barcode, and can be removed to avoid polymerase chain reaction (PCR) bias. Chromium, Drop-seq, Seq-well and SCRB-seq incorporate these transcript barcodes into the adaptor sequences as UMIs, whereas duplicates are identified purely computationally with SMART-seq2. These computationally biased methods assume all identical reads result from PCR amplification and, thus, are unable to identify real duplicates originating from different transcript copies of the same gene, present before amplification steps (for details, see an investigation by Parekh et al., Reference Parekh, Ziegenhain, Vieth, Enard and Hellmann2016).
Once mapped to the reference genome, the number of unique transcripts per gene is counted as a measure of expression level. A highly problematic issue when mapping to kinetoplastid genomes is the accuracy of untranslated region (UTR) annotations, as most methods capture only short sequences upstream of the polyadenylation site. Thus, most reads will map to the last 300 bp of the 3′ UTR (Zheng et al., Reference Zheng, Terry, Belgrader, Ryvkin, Bent, Wilson, Ziraldo, Wheeler, McDermott, Zhu, Gregory, Shuga, Montesclaros, Underwood, Masquelier, Nishimura, Schnall-Levin, Wyatt and Hindson2017), which needs to be annotated for the aligning read to be included in transcript counts. Polyadenylation site usage, and therefore 3′ UTR sequences, are also variable between species and life cycle stage (Siegel et al., Reference Siegel, Hekstra, Wang, Dewell and Cross2010; Kramer and Carrington, Reference Kramer and Carrington2011; Sà et al., Reference Sà, Cannon M, Caleon, Wellems and Serre2020), so may need to be assumed when no accurate reference is available. We overcame this issue when mapping reads from EATRO Antat 1.1 T. brucei to the TREU927 T. brucei genome (Berriman, Reference Berriman2005) by extending UTR sequences to a maximum of 2,500 bp (removing all overlaps with neighbouring genomic features). This dramatically improved the transcripts counted. Sà et al., noted different UTR usage between sexual and asexual stage P. vivax and looked for peaks of unassigned reads to attribute these to the most proximal genes (Sà et al., Reference Sà, Cannon M, Caleon, Wellems and Serre2020). Care needs to be taken when interpreting results where UTRs are been assumed, as reads may, in fact, have originated from unannotated genes or non-coding RNA. Full-length transcripts from SMART-seq should show better assignment to genes, as documented in T. brucei when only 400 bp 3′ UTRs were required for mapping (Müller et al., Reference Müller, Cosentino, Förstner, Guizetti, Wedel, Kaplan, Janzen, Arampatzi, Vogel, Steinbiss, Otto, Saliba, Sebra and Siegel2018). Hence, full-length transcripts may be preferred when an accurate reference transcriptome is not available. Alternatively, 5′ end methods may be used, such as Chromium Single Cell 5′ Gene Expression from 10x, as part of the Single Cell V(D)J Protocol (10x Genomics, 2020b), although the 5′ UTR annotation may still need to be optimized.
After mapping is performed, read quality and mapping accuracy can be investigated with a genome viewer, and the number of cells captured can be established. As libraries can be stored for additional sequencing it may be cost-effective to the first sequence to a low depth (e.g. 5,000 reads per cell), and assess the number and quality of transcriptomes captured using the methods described below. Additional sequencing can then be performed in the knowledge that the library contains viable cells and with a better estimate of the cell number. Read length could also be customized to allow more gene sequence to be captured and improve mapping (Briggs et al., Reference Briggs, McCulloch, Matthews and Otto2020). For example, for 3′ methods when performing paired-end sequencing, read 1 sequence contains the cell barcode and the UMI, so biasing sequencing to read 2 will increase the length of gene-specific sequence returned.
Data analysis
Methods for the analysis of scRNA-seq data are still evolving and different methods will likely perform better than others with specific data sets. Figure 4 summarizes the general data analysis steps, considerations and decision points where the user is advised to compare methods and/or parameters.
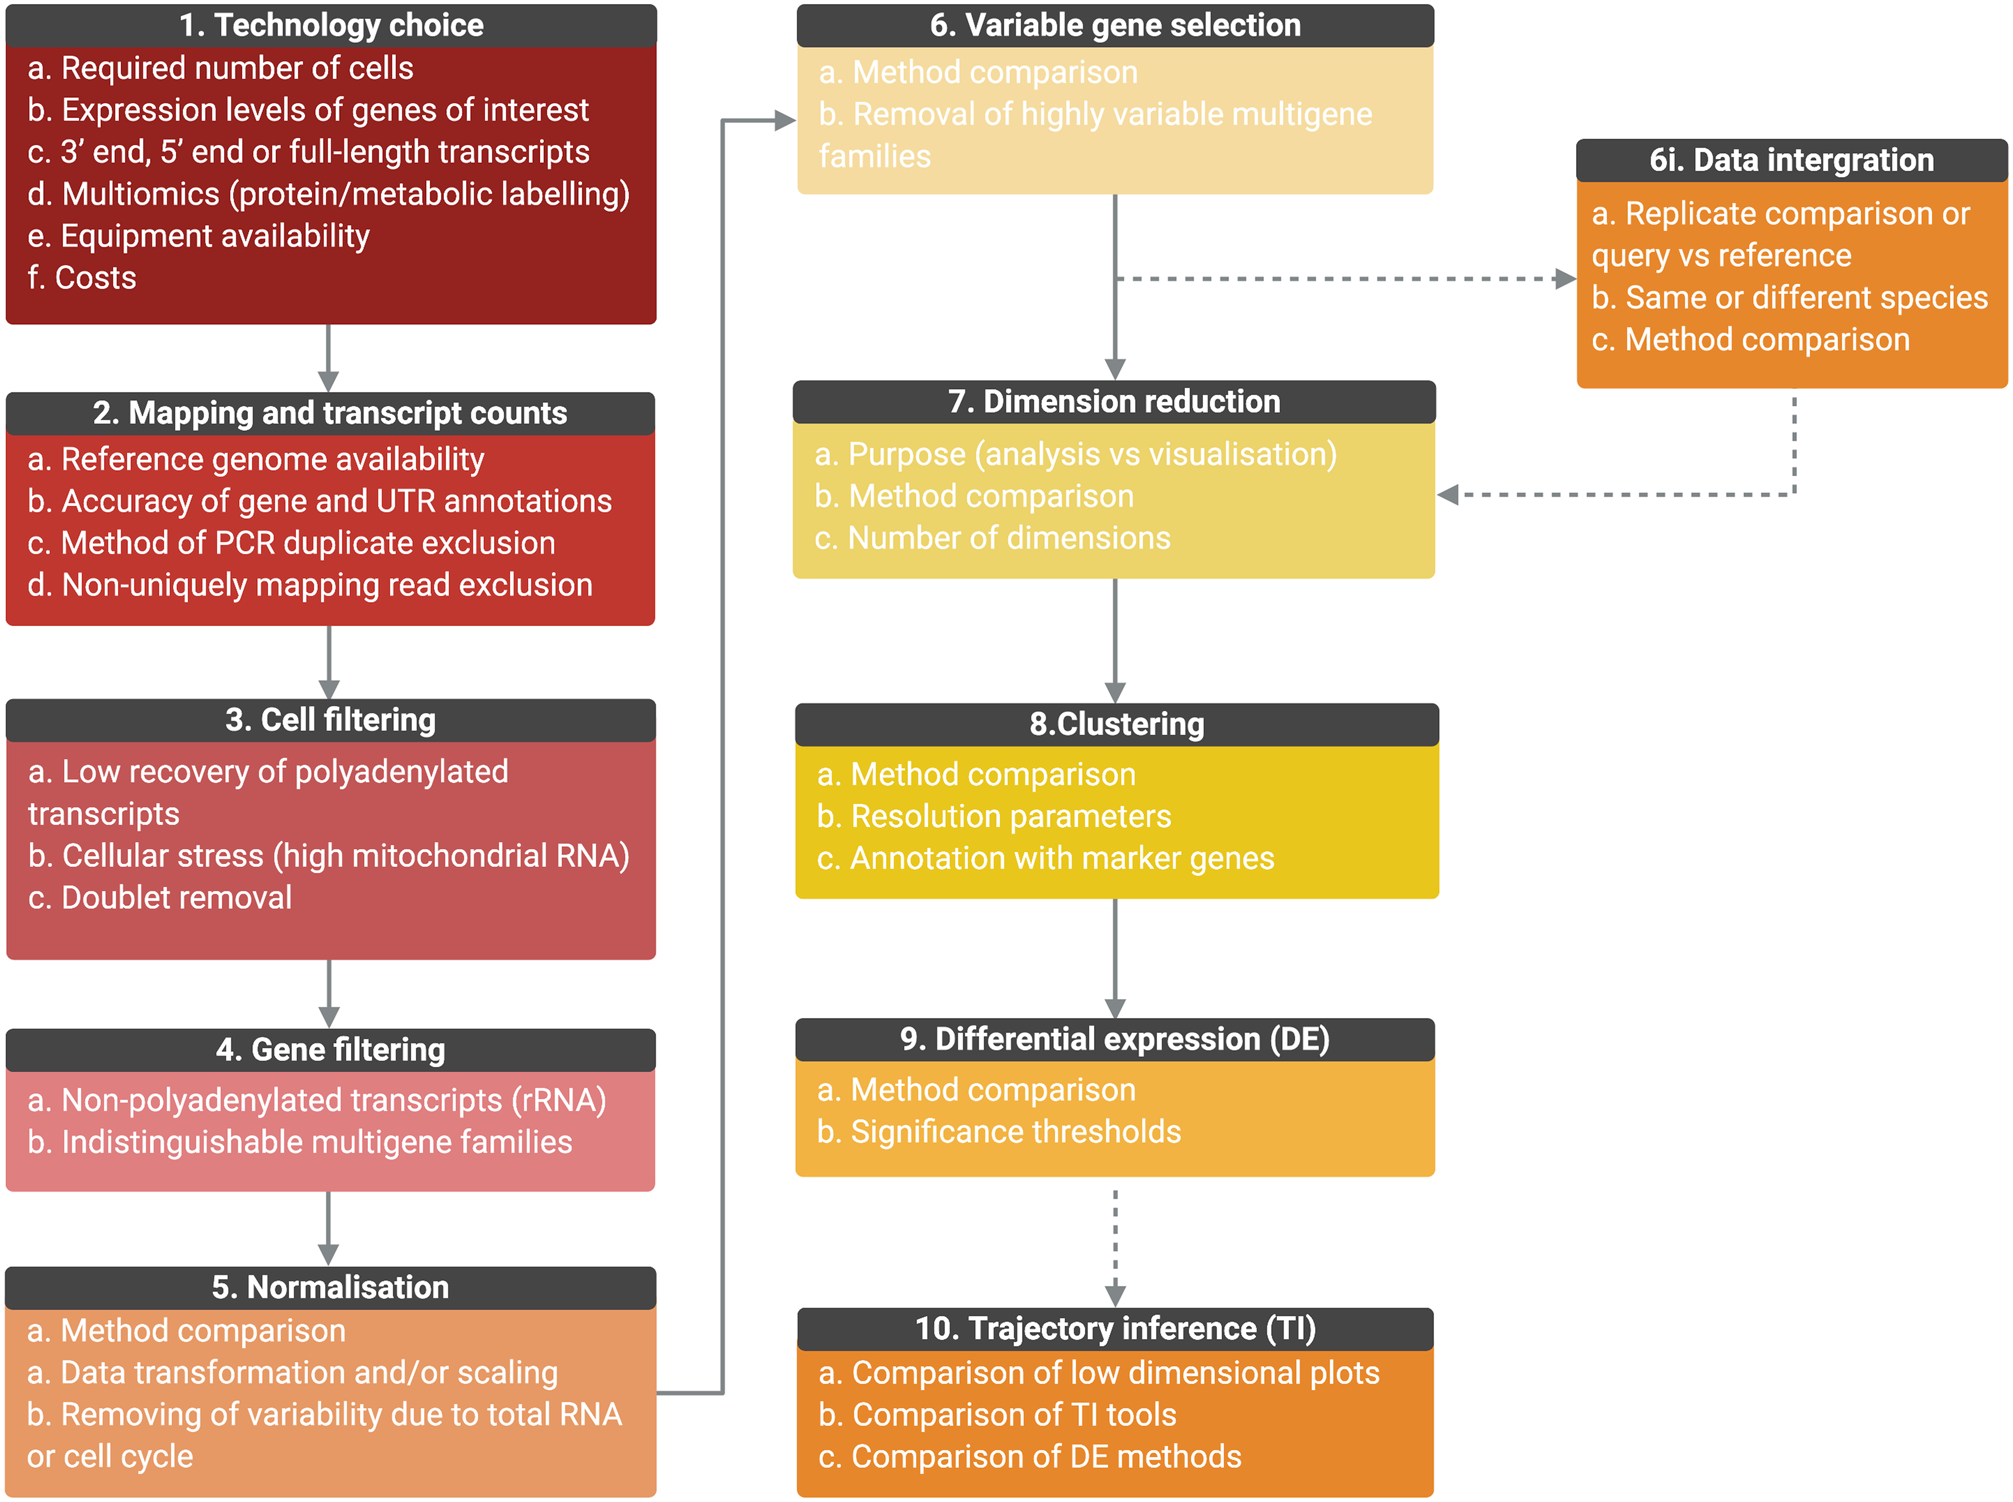
Fig. 4. Outline of the general scRNA-seq analysis steps and user considerations. General analysis steps are indicate by numbers and points of consideration are listed below each. (1) The choice of technology will depend on the number of cells required, the expression level of genes, whether full-length transcripts are required, equipment availability and costs. Once scRNA-seq is performed, sequencing is mapped, and transcript counts per gene for each cell are calculated (2). Counts data will be affected by the accuracy of the genome, gene and UTR annotations, PCR duplicate removal and non-uniquely mapping reads. Data will then require filtering to remove cells of low quality or doublets (3) and genes for which transcript counts are likely to be inaccurate (4). Once filtered, data will require normalization, the best method for which will be data set-dependant (5). Data can also be scaled to remove variable gene expression due to total RNA per cell differences and cell cycle dependant gene expression variation. For further analysis, only the top variable genes should be selected to avoid introducing noise (6). Genes from multiple selection methods should be considered and some genes may require removal from variable gene lists, such as VSGs, if not under investigation. (6i) Replicate samples can be integrated, or query cells can be mapped to a control data set or cell ‘atlas’ of the same or different species. Methods should be compared and will depend on aims. As it is not possible to work in high-dimensional space, data should then be reduced (7) and the appropriate number of dimensions to include should be tested. The type of dimensional reduction performed will depend on aims (analysis or visualization) (8). Cells can be clustered by gene expression using reduced data and labelled by investigating the expression of marker genes. Cluster numbers will be dependent on parameters such as resolution. Differential expression (DE) analysis can be performed between clusters or between conditions if data is integrated (9). Tools are still under development to improve power and false discovery rates, and so methods should be compared. If investigating a biological progression between cellular states, trajectory inference (TI) can be performed (10). Over 70 tools exist and performance depends on the topology of the data in low-dimensional plots. Results should be compared and DE across trajectories investigated. (Created with BioRender.com)
Quality control and pre-processing
Quality control of kinetoplastid scRNA-seq data is broadly similar to other cells, whereby transcriptomes with higher than average levels of total RNA are removed as they are likely to include reads from two or more cells (doublets). Similarly, those with low RNA can be removed as they are likely to originate from prematurely lysed cells or where transcript capture has been inefficient. However, cut-offs need to be considered in the context of cell types. For example, metacyclic form T. brucei has substantially less total RNA than epimastigotes (Vigneron et al., Reference Vigneron, O’Neill, Weiss, Savage, Campbell, Kamhawi, Valenzuela and Aksoy2020), and RNA levels in Plasmodium life cycle stages vary substantially (Poran et al., Reference Poran, Nötzel, Aly, Mencia-Trinchant, Harris, Guzman, Hassane, Elemento and Kafsack2017; Reid et al., Reference Reid, Talman, Bennett, Gomes, Sanders, Illingworth, Billker, Berriman and Lawniczak2018; Howick et al., Reference Howick, Russell, Andrews, Heaton, Reid, Natarajan, Butungi, Metcalf, Verzier, Rayner, Berriman, Herren, Billker, Hemberg, Talman and Lawniczak2019; Real et al., Reference Real, Howick, Dahalan, Witmer, Cudini, Andradi-Brown, Blight, Davidson, Kumar Dogga, Reid, Baum and Lawniczak2020). In mammalian cells, it was found that mitochondrial-encoded genes are a good indicator of cell quality, as lysed cells preferentially lose cytoplasmic transcripts (since organelles are less likely to lyse), and the resulting transcriptomes have a greater percentage of mitochondrial transcripts (Ilicic et al., Reference Ilicic, Kim, Kolodziejczyk, Bagger, McCarthy, Marioni and Teichmann2016). We found mapping of reads to the kDNA maxi circle of T. brucei provided an analogous method to remove low-quality parasites (Briggs et al., Reference Briggs, McCulloch, Matthews and Otto2020). Additionally, we found some cells with an unusually high percentage of ribosomal RNA (rRNA) transcripts. As the Chromium adaptors should capture only polyadenylated transcripts, those cells with high rRNA were also considered low quality transcriptomes and were removed. Additional filtering to remove all rRNA transcript counts from further analysis can also be performed. Studies of Plasmodium have also noted contaminating rRNA, which required removal prior to analysis (Poran et al., Reference Poran, Nötzel, Aly, Mencia-Trinchant, Harris, Guzman, Hassane, Elemento and Kafsack2017; Müller et al., Reference Müller, Cosentino, Förstner, Guizetti, Wedel, Kaplan, Janzen, Arampatzi, Vogel, Steinbiss, Otto, Saliba, Sebra and Siegel2018; Reid et al., Reference Reid, Talman, Bennett, Gomes, Sanders, Illingworth, Billker, Berriman and Lawniczak2018; Waldman et al., Reference Waldman, Schwarz, Wadsworth, Saeij, Shalek and Lourido2020; Xue et al., Reference Xue, Theisen, Rastogi, Ferrel, Quake and Boothroyd2020).
Doublet rates vary between technologies and individual experiments. To assess the number of doublets when running the maximum number of cells (30,000) per Chromium sample, we combined T. brucei and L. mexicana in a 1:1 ratio. A total of 8.04% of cells were predicted to contain RNA from both parasites and guided us in removing these cells (Briggs et al., Reference Briggs, McCulloch, Matthews and Otto2020). Similarly, Howick et al., mixed P. knowlesi and P. berghi 1:1 before subjecting 10,000 cells to Chromium scRNA-seq and found a doublet rate of 6.34% (Howick et al., Reference Howick, Russell, Andrews, Heaton, Reid, Natarajan, Butungi, Metcalf, Verzier, Rayner, Berriman, Herren, Billker, Hemberg, Talman and Lawniczak2019). As well as filtering transcriptomes with unusually high RNA levels, more sophisticated methods for removing doublets have been proposed, including, DoubletFinder (McGinnis, Murrow, and Gartner, Reference McGinnis, Murrow and Gartner2019b), DoubletDecon (DePasquale et al., Reference DePasquale, Schnell, Van Camp, Valiente-Alandí, Blaxall, Grimes, Singh and Salomonis2019) and souporcell, which also identifies free RNA released by damaged cells that have contaminated other transcriptomes (Heaton et al., Reference Heaton, Talman, Knights, Imaz, Gaffney, Durbin, Hemberg and Lawniczak2020).
Spike-in control RNA can be included in various methods, though they are primarily used with SMART-seq, as done for analysis of T. brucei (Müller et al., Reference Müller, Cosentino, Förstner, Guizetti, Wedel, Kaplan, Janzen, Arampatzi, Vogel, Steinbiss, Otto, Saliba, Sebra and Siegel2018). The usefulness of spike-in RNA is debated, due to the difficulty with precisely adding equal amounts to each cell (Kolodziejczyk et al., Reference Kolodziejczyk, Kim, Svensson, Marioni and Teichmann2015). However, this variability has been shown to cause a limited amount of technical noise (Lun et al., Reference Lun, Calero-Nieto, Haim-Vilmovsky, Göttgens and Marioni2017) and spike-in RNA may be helpful for normalization, identification of empty wells and dying cells (Baran-Gale, Chandra, and Kirschner, Reference Baran-Gale, Chandra and Kirschner2018), and removing bias caused by contaminating free RNA (Kolodziejczyk et al., Reference Kolodziejczyk, Kim, Svensson, Marioni and Teichmann2015; Marquina-Sanchez et al., Reference Marquina-Sanchez, Fortelny, Farlik, Vieira, Collombat, Bock and Kubicek2020). Additionally, spike-in controls can help determine absolute RNA levels, although spike-ins are likely to be captured with different efficiencies to endogenous RNA (Svensson et al., Reference Svensson, Natarajan, Ly, Miragaia, Labalette, Macaulay, Cvejic and Teichmann2017).
Post-filtering, the data requires normalization and can be log-transformed, the methods of which have been extensively reviewed elsewhere (Vallejos et al., Reference Vallejos, Risso, Scialdone, Dudoit and Marioni2017; Luecken and Theis, Reference Luecken and Theis2019; Lytal et al., Reference Lytal, Ran and An2020). It is worth noting that the total transcripts per cell can have a large effect on plots, and this can be regressed when scaling the data. The contribution of the cell cycle to gene expression variability can also be regressed from the data. However, this requires an assessment of known cell cycle-regulated genes. This was possible in T. brucei due to previous marker analysis (Archer et al., Reference Archer, Inchaustegui, Queiroz and Clayton2011), which is also available for T. cruzi (Chávez et al., Reference Chávez, Chávez, Eastman, Smircich, Becco, Oliveira-Rizzo, Fort, Potenza, Garat, Sotelo-Silveira and Duhagon2017). Cell cycle markers are not currently published for Leishmania spp., although it may be possible to perform a similar analysis with orthologs of T. brucei and T. cruzi genes, with consideration of the caveats of inferring markers this way. However, it may be relevant to retain cell cycle variation in the data, for example when studying cell cycle exit.
Dimension reduction
Dimension reduction is performed, firstly, to separate biological variability in the data from technical noise. Many different approaches for dimension reduction have been developed (Luecken and Theis, Reference Luecken and Theis2019; Sun et al., Reference Sun, Zhu, Ma and Zhou2019), including, but not limited to, variations of principal component (PC) analysis (PCA), diffusion maps (Angerer et al., Reference Angerer, Haghverdi, Büttner, Theis, Marr and Buettner2016) and deep-learning methods for larger data sets (Sun et al., Reference Sun, Zhu, Ma and Zhou2019). In most cases, the most variable genes must be selected first for use in data reductions to avoid introducing noise. Here, again, multiple methods are possible and the genes selected will affect downstream findings (Luecken and Theis, Reference Luecken and Theis2019; Townes et al., Reference Townes, Hicks, Aryee and Irizarry2019). Yip et al., compared seven tools with the same data set and found only two genes were selected as significantly variable genes with all approaches (Yip et al., Reference Yip, Sham and Wang2018). Thus, selecting genes with several methods and then comparing the results to select those in common may improve the robustness of analysis (Yip et al., Reference Yip, Sham and Wang2018; Kiselev et al., Reference Kiselev, Andrews and Hemberg2019; Luecken and Theis, Reference Luecken and Theis2019). Differentially expressed gene families may need to be removed from the variable gene list to avoid grouping cells by predominately these factors, unless they are the subject of investigation. For example, when working with bloodstream form T. brucei it may be necessary to remove VSGs from the variable gene set as these show high variation between cells in some samples and may lead to grouping by the expressed VSG alone (Briggs et al., Reference Briggs, McCulloch, Matthews and Otto2020). A second consideration is the number of PCs, or dimensions, to select for use in the next steps in the analysis. Selecting too few will ignore important variability, whereas selecting too many will introduce noise. Popular methods for selecting PCs include the JackStraw procedure (Macosko et al., Reference Macosko, Basu, Satija, Nemesh, Shekhar, Goldman, Tirosh, Bialas, Kamitaki, Martersteck, Trombetta, Weitz, Sanes, Shalek, Regev and McCarroll2015), and assessing the variability contributed by each PC with elbow plots. Both are implemented in the popular Seurat workflow (Satija et al., Reference Satija, Farrell, Gennert, Schier and Regev2015).
The second aim of dimension reduction is visualization. PCA plots only allow limited dimensions (normally the top two) to be plotted and the distance between cells does not necessarily reflect the real distance between transcriptome similarities. Hence, the method of dimension reduction has to be considered to avoid overinterpretation of the data in the later analysis steps (see below). Non-linear dimensionality reduction methods, such as tSNE, UMAP and PHATE, allow further complexity to be incorporated and can conserve the distance between groups of cells. t-SNE plots focus on the local similarity of data points to group them together, at the expense of the global relationship between groups (Van Der Maaten and Hinton, Reference Van Der Maaten and Hinton2008). UMAP (Uniform Manifold Approximation and Projection), however, is better able to conserve the global structure of data and so depicts the relationships between clustered cells as the distance (McInnes et al., Reference McInnes, Healy and Melville2018). PHATE projections capture local and global structure making it a preferred method for studying continuous data, such as a developmental progression (Moon et al., Reference Moon, van Dijk, Wang, Gigante, Burkhardt, Chen, Yim, Elzen, Hirn, Coifman, Ivanova, Wolf and Krishnaswamy2019). Therefore, UMAP is often better suited for scRNA-seq analysis to identify cell clusters and relationships between clusters (Luecken and Theis, Reference Luecken and Theis2019), whereas PHATE is well suited for trajectory analysis (see below). Again, the appropriate number of dimensions must be selected, as described above.
Clustering analysis
A common aim of scRNA-seq is to identify cell types present in the data by clustering and marker gene identification. Different clustering approaches have been applied to scRNA-seq data (Duò et al., Reference Duò, Robinson and Soneson2018; Sun et al., Reference Sun, Zhu, Ma and Zhou2019) and the choice of method will likely vary between experiments. Sun et al., compared 18 different dimension reduction methods, as well as 3 clustering approaches (k-means, Louvain and hierarchical), to provide a helpful guide (Sun et al., Reference Sun, Zhu, Ma and Zhou2019). Each cluster can then be labelled by the cell type identified to begin understanding the biological significance of each population identified. With an existing cell atlas, it would be possible to transfer labels directly from these reference data sets to label cell clusters [a function now integrated into the Seurat pipeline (Stuart et al., Reference Stuart, Butler, Hoffman, Hafemeister, Papalexi, Mauck, Hao, Stoeckius, Smibert and Satija2019)]. Assessing the expression of known marker genes can aid cluster labelling (see differential expression below) in the absence of transferable labels. By exploring the clusters as such, the clustering parameters can be fine-tuned with various iterations to find the most appropriate number of clusters, in the context of the known biology.
Differential expression
As well as investigating known marker genes, novel differentially expressed genes can be identified to aid the interrogation of the identified cell populations. Methods for performing DE analysis between clusters (and across trajectories, see below) are still developing and will likely improve. Bulk RNA-seq DE methods have been applied to scRNA-seq data, although these do not consider the high dropout rate of scRNA-seq experiments, where only a proportion of genes are detected in each cell, or the high variability of most genes between cells (Vallejos et al., Reference Vallejos, Risso, Scialdone, Dudoit and Marioni2017). Gene expression of each cluster can be combined by ‘pseudo-bulking’ (Lun and Marioni, Reference Lun and Marioni2017; Kang et al., Reference Kang, Subramaniam, Targ, Nguyen, Maliskova, McCarthy, Wan, Wong, Byrnes, Lanata, Gate, Mostafavi, Marson, Zaitlen, Criswell and Ye2018; Crowell et al., Reference Crowell, Soneson, Germain, Calini, Collin, Raposo, Malhotra and Robinson2020), before DE is performed with, for example, edgeR (Robinson et al., Reference Robinson, McCarthy and Smyth2009) and DEseq2 (Love et al., Reference Love, Huber and Anders2014). scRNA-seq specialized methods have also been developed to tackle these problems (Finak et al., Reference Finak, Guimarães-Pinto, Nunes, Zukeram, Fliess, Pereira, Oliveira Nascimento, Conde and Morrotn.d.; Kharchenko et al., Reference Kharchenko, Silberstein and Scadden2014), although Vieth et al., point out that the performance of DE tools was largely dependent on upstream analysis steps (Vieth et al., Reference Vieth, Parekh, Ziegenhain, Enard and Hellmann2019). Bulk tools are improved when introducing gene weights, even out-performing specialist methods (Van den Berge et al., Reference Van den Berge, Perraudeau, Soneson, Love, Risso, Vert, Robinson, Dudoit and Clement2018), although this is computationally inefficient (Luecken and Theis, Reference Luecken and Theis2019). Notably, muscat has been developed to allow DE of single-cell data, including across multiple samples and multiple conditions, in what the authors’ term ‘differential state analysis’ (Crowell et al., Reference Crowell, Soneson, Germain, Calini, Collin, Raposo, Malhotra and Robinson2020). Once performed, DE between clusters will reveal marker genes which can then be investigated to label known and novel cell types and reveal novel marker genes.
Trajectory inference
Another common aim in analysing scRNA-seq data is trajectory inference and pseudo-time analysis, which allows gene expression change across developmental processes to be investigated (Tanay and Regev, Reference Tanay and Regev2017), such as during differentiation of slender to stumpy T. brucei (Briggs et al., Reference Briggs, McCulloch, Matthews and Otto2020), and tachyzoite to bradyzoite T. gondii differentiation (Waldman et al., Reference Waldman, Schwarz, Wadsworth, Saeij, Shalek and Lourido2020; Xue et al., Reference Xue, Theisen, Rastogi, Ferrel, Quake and Boothroyd2020). First, an appropriate dimensionally reduced data plot needs to be generated. In general, PCA plots, diffusion maps (Haghverdi et al., Reference Haghverdi, Buettner and Theis2015; Angerer et al., Reference Angerer, Haghverdi, Büttner, Theis, Marr and Buettner2016) or PHATE maps (Moon et al., Reference Moon, van Dijk, Wang, Gigante, Burkhardt, Chen, Yim, Elzen, Hirn, Coifman, Ivanova, Wolf and Krishnaswamy2019) can capture simple linear or bifurcating processes that can then be inferred as a trajectory (Luecken and Theis, Reference Luecken and Theis2019; Saelens et al., Reference Saelens, Cannoodt, Todorov and Saeys2019). UMAPs (Cao et al., Reference Cao, Speilmann, Qiu, Huang, Ibrahim, Hill, Zhang, Mundlos, Christiansen, Steemers, Trapnell and Shendure2019) or PAGA analysis (Wolf et al., Reference Wolf, Hamey, Plass, Solana, Dahlin, Göttgens, Rajewsky, Simon and Theis2019) are better suited to more complex data sets (Luecken and Theis, Reference Luecken and Theis2019). A huge number of trajectory inference tools now exist and so selecting one can be cumbersome. Saelens et al., helpfully compared and evaluated the performance of 45 of these tools (Saelens et al., Reference Saelens, Cannoodt, Todorov and Saeys2019), concluding the choice is dependent on the topology of the trajectory: Slingshot (Street et al., Reference Street, Risso, Fletcher, Das, Ngai, Yosef, Purdom and Dudoit2018) and TSCAN (Ji and Ji, Reference Ji and Ji2016) perform well when analysing linear processes; Slingshot (Street et al., Reference Street, Risso, Fletcher, Das, Ngai, Yosef, Purdom and Dudoit2018) also performs well in the detection of branches (Saelens et al., Reference Saelens, Cannoodt, Todorov and Saeys2019); and PAGA (Wolf et al., Reference Wolf, Hamey, Plass, Solana, Dahlin, Göttgens, Rajewsky, Simon and Theis2019) was helpful for analysis of complex data with disconnected clusters of cells. Monocle v3 (Cao et al., Reference Cao, Speilmann, Qiu, Huang, Ibrahim, Hill, Zhang, Mundlos, Christiansen, Steemers, Trapnell and Shendure2019) was not available for inclusion in the comparison by Saelens et al., but has since proved helpful for analysing complex data using UMAP, as it can identify multiple branching and converging points in development. We inferred the circular trajectory of the T. brucei cell cycle (Briggs et al., Reference Briggs, McCulloch, Matthews and Otto2020) by fitting a principle curve (Hastie and Stuetzle, Reference Hastie and Stuetzle1989), although alternative approaches such as reCAT (Liu et al., Reference Liu, Lou, Xie, Wang, Chen, Aparicio, Zhang, Jiang and Chen2017) are available (Saelens et al., Reference Saelens, Cannoodt, Todorov and Saeys2019). Monocle v3 (Cao et al., Reference Cao, Speilmann, Qiu, Huang, Ibrahim, Hill, Zhang, Mundlos, Christiansen, Steemers, Trapnell and Shendure2019) provides a pipeline for differential gene expression across the trajectories it finds using graph-autocorrelation analysis. Alternatively, tradeSeq allows expression analysis across simple trajectories by fitting generalized additive models (Van den Berge et al., Reference Van den Berge, Roux de Bézieux, Street, Saelens, Cannoodt, Saeys, Dudoit and Clement2020).
Data integration
Data integration allows the comparison of replicate experiments, but also the mapping of a query sample to an established ‘reference’ data set. For integrating replicate data sets and removing batch effects, methods include but are not limited to, Seurat (Stuart et al., Reference Stuart, Butler, Hoffman, Hafemeister, Papalexi, Mauck, Hao, Stoeckius, Smibert and Satija2019), BBKNN (Polański et al., Reference Polański, Young, Miao, Meyer, Teichmann and Park2020), Harmony (Korsunsky et al., Reference Korsunsky, Millard, Fan, Slowikowski, Zhang, Wei, Baglaenko, Brenner, Loh and Raychaudhuri2019) and STACAS (Andreatta and Carmona, Reference Andreatta and Carmona2020). More complex data integration can also be performed to map cells onto a reference or ‘cell atlas’, even across different technologies, conditions, cells strains and species. We used STACAS (which is specialized for data sets that are expected to not fully overlap) to map ZC3H20 null T. brucei onto the trajectory of differentiating wild-type parasites to assess the regulation point of this factor (Briggs et al., Reference Briggs, McCulloch, Matthews and Otto2020). Howick et al., employed scmap (Kiselev et al., Reference Kiselev, Yiu and Hemberg2018) to build a reference with P. berghei cells and then map P. falciparum and P. knowlesi transcriptomes to this complete life cycle atlas using orthologous genes (Howick et al., Reference Howick, Russell, Andrews, Heaton, Reid, Natarajan, Butungi, Metcalf, Verzier, Rayner, Berriman, Herren, Billker, Hemberg, Talman and Lawniczak2019). Thus, cells from different species could be directly compared. The authors were able to extend this approach to map transcriptomes of methanol-fixed P. malariae and P. falciparum from infected volunteers to the P. berghei atlas. Luecken et al., recently compared various combinations of pre-processing and integration methods, concluding Seurat v3 (Stuart et al., Reference Stuart, Butler, Hoffman, Hafemeister, Papalexi, Mauck, Hao, Stoeckius, Smibert and Satija2019) was better suited to simple data integration tasks, whereas BBKNN (Polański et al., Reference Polański, Young, Miao, Meyer, Teichmann and Park2020), Scanorama (Hie et al., Reference Hie, Bryson and Berger2019) and scVI (Lopez et al., Reference Lopez, Regier, Cole, Jordan and Yosef2018) successfully integrated more complex data sets (Luecken and Theis, Reference Luecken and Theis2019). Helpfully, the authors also provide their scripts so users can identify the optimal data integration method for new data sets (Luecken and Theis, Reference Luecken and Theis2019).
Applications
Kinetoplastids commonly exist as heterogeneous populations due to their diversity of life cycle stages. For example, infected tsetse salivary glands contain epimastigotes, early metacyclics and late metacyclics, as dissected by scRNA-seq (Vigneron et al., Reference Vigneron, O’Neill, Weiss, Savage, Campbell, Kamhawi, Valenzuela and Aksoy2020), as well as gametes (Peacock et al., Reference Peacock, Ferris, Sharma, Sunter, Bailey, Carrington and Gibson2011; Gibson and Peacock, Reference Gibson and Peacock2019). Several other highly varied populations exist: in culture Leishmania promastigotes exist as procyclic, nectomonad, leptomonad and metacyclic forms (Serafim et al., Reference Serafim, Coutinho-Abreu I, Oliveira, Meneses, Kamhawi and Valenzuela2018); cell cycle arrested, or substantially slowed, ‘persister-like’ intracellular amastigote forms of Leishmania and T. cruzi exist as subpopulations with replicating amastigotes (Vickerman, Reference Vickerman1985; Tarleton and Zhang, Reference Tarleton and Zhang1999; Fernandes and Andrews, Reference Fernandes and Andrews2012; Mandell and Beverley, Reference Mandell and Beverley2017; Sánchez-Valdéz et al., Reference Sánchez-Valdéz, A, W, D and RL2018; Barrett et al., Reference Barrett, Kyle, Sibley, Radke and Tarleton2019; Ward et al., Reference Ward, Olmo, Atherton and Taylor2020); actively cycling and arrested bloodstream form African trypanosomes co-exist in the mammal blood and adipose tissue (Trindade et al., Reference Trindade, Rijo-Ferreira, Carvalho, Pinto-Neves, Guegan, Aresta-Branco, Bento, Young, Pinto, Van Den Abbeele, Ribeiro, Dias, Smith and Figueiredo2016; Rojas and Matthews, Reference Rojas and Matthews2019); and T. cruzi trypomastigotes, spheromastigotes and epimastigotes are found in the triatomine bug intestinal tract (Chagas, Reference Chagas1909; Castro et al., Reference Castro, Seabra, Garcia, Souza and Azembuja2007). Additionally, sexual life cycle stages have been noted for T. brucei, T. cruzi and Leishmania, yet the timing of their development, location within the host and integration into the respective life cycles are often poorly characterized. scRNA-seq is likely to aid our understanding of these diverse cell types, which can be difficult, or impossible, to separate from populations due to their small number or lack of marker genes. Additionally, scRNA-seq removes the need for large cell numbers, often required for bulk analyses. Thus, a detailed investigation of previously unreachable, rare populations which cannot be amplified in culture, should now be possible by profiling parasites immediately after extraction from the host.
Host-parasite interactions could also be analysed in tandem with scRNA-seq by, for instance, analysing infected host cells or capturing host cells along with infecting parasites in in vivo studies. scRNA-seq has been extensively used to analyse the immune response (Chattopadhyay et al., Reference Chattopadhyay, Gierahn, Roederer and Love2014; Chattopadhyay and Roederer, Reference Chattopadhyay and Roederer2015; Buchholz et al., Reference Buchholz, Schumacher and Busch2016; Buchholz and Flossdorf, Reference Buchholz and Flossdorf2018) and could be applied to study the host response to kinetoplastid infection. Comparison of parasites resident in differing host tissues, such as an invasion of the lymph and blood systems, skin (Capewell et al., Reference Capewell, Cren-Travaille, Marchesi, Johnston, Clucas, Benson, Gorman, Calvo-Alvarez, Crouzols, Jouvion, Jamonneau, Weir, Stevenson, O'Neill, Cooper, Swar, Bucheton, Ngoyi, Garside and Macleod2016), adipose tissue (Trindade et al., Reference Trindade, Rijo-Ferreira, Carvalho, Pinto-Neves, Guegan, Aresta-Branco, Bento, Young, Pinto, Van Den Abbeele, Ribeiro, Dias, Smith and Figueiredo2016; Tanowitz et al., Reference Tanowitz, Scherer, Mota and Figueiredo2017) and brain (Grab and Kennedy, Reference Grab and Kennedy2008; Kristensson et al., Reference Kristensson, Nygård, Bertini and Bentivoglio2010) by African trypanosomes (Alfituri et al., Reference Alfituri, Quintana, MacLeod, Garside, Benson, Brewer, Mabbott, Morrison and Capewell2020), should also be facilitated by scRNA-seq. In the case of T. cruzi, 10–30% of infected individuals will develop chronic Chagas (World Health Organization, 2002), where parasites invade the heart (Bellotti et al., Reference Bellotti, Bocchi, De Moraes, De Higuchi, Barbero-Marcial, Sosa, Esteves-Filho, Kalil, Weiss and Pileggi1996), and, in infected mice, parasites have been detected in the skeletal muscle, heart, bladder, peripheral nerve, liver, spleen, adrenal gland, brain and adipose tissue (Buckner et al., Reference Buckner, Wilson and Van Voorhis1999). Understanding if and how T. cruzi adapts to these diverse host niches could be revealed by scRNA-seq. Leishmania promastigotes must make their way through the dermis extracellular matrix before infecting macrophages (Arango Duque and Descoteaux, Reference Arango Duque and Descoteaux2015) and neutrophils (Ribeiro-Gomes et al., Reference Ribeiro-Gomes, Otero, Gomes, Moniz-de-Souza, Cysne-Finkelstein, Arnholdt, Calich, Coutinho, Lopes and DosReis2004) and then differentiating into amastigotes, and it remains possible scRNA-seq will uncover aspects of this journey. As well as isolating individual host cells and parasites for the scRNA-seq methods discussed, in situ analysis of single cells in the surrounding tissue can be performed. 10x Genomics now provides a spatial transcriptomic platform based on the method developed by Ståhl et al. (Ståhl et al., Reference Ståhl, Salmén, Vickovic, Lundmark, Navarro, Magnusson, Giacomello, Asp, Westholm, Huss, Mollbrink, Linnarsson, Codeluppi, Borg, Pontén, Costea, Sahlén, Mulder and Bergmann2016). scRNA-seq can also be used to study cross-talk between physically interacting cells, such as T. congolense and the epithelial cells the parasites adhere to (Hemphill et al., Reference Hemphill, Frame and Ross1994; Hemphill and Ross, Reference Hemphill and Ross1995). PIC-seq combines cell sorting of physically interacting cells (PICs) with scRNA-seq, allowing analysis of the interacting cells and comparison to non-interacting single cells in the same sample to identify interaction-specific gene expression (Giladi et al., Reference Giladi, Cohen, Medaglia, Baran, Li, Zada, Bost, Blecher-Gonen, Salame, Mayer, David, Ronchese, Tanay and Amit2020). Thus, various iterations of scRNA-seq could improve understanding of the differences between tissue-specific parasites, as well as host cellular responses.
Complex life cycle stage differentiation can also be analysed in novel detail. We used trajectory inference to reconstruct the asynchronous differentiation of bloodstream form T. brucei from slender to stumpy form (Briggs et al., Reference Briggs, McCulloch, Matthews and Otto2020). Epimastigote to early- and then late-stage metacyclic T. brucei has also been profiled to identify transitioning surface protein expression (Vigneron et al., Reference Vigneron, O’Neill, Weiss, Savage, Campbell, Kamhawi, Valenzuela and Aksoy2020). Similar approaches should be capable of deconvolving the other life cycle stages of T. brucei, arguably the most tractable model of trypanosome differentiation. Different data sets from such studies can in the future be integrated (using the methods described above) to generate a T. brucei life cycle cell atlas. Cell atlases are valuable resources as they document gene expression changes across development processes (e.g. the life cycle or cell cycle) in greater detail than bulk analysis of selected populations.
Using a similar approach, complexities in the Leishmania life cycle could also be dissected. Bulk RNA-seq analysis showed extensive transcript regulation of promastigote, amastigote and axenic amastigote L. mexicana life cycle stages (Fiebig et al., Reference Fiebig, Kelly and Gluenz2015). Separating the various promastigote forms (procyclic, nectomonad and leptomonad) from sandfly tissues (Walters et al., Reference Walters, Modi, Chaplin and Tesh1989; Lawyer et al., Reference Lawyer, Ngumbi, Anjili, Odongo, Mebrahtu, Githure, Koech and Roberts1990; Walters, Reference Walters1993; Serafim et al., Reference Serafim, Coutinho-Abreu I, Oliveira, Meneses, Kamhawi and Valenzuela2018; Coutinho-Abreu et al., Reference Coutinho-Abreu, Serafim, Meneses, Kamhawi, Oliveira and Valenzuela2020) is also difficult and so profiling these as a mixed population may aid understanding. The T. cruzi life cycle contains equal complexity, with epimastigotes, trypomastigotes and spheromastigotes, as well as many intermediate stages (Schaub, Reference Schaub1989), found together in the triatomine bug intestinal tract (Chagas, Reference Chagas1909; Onyekwelu, Reference Onyekwelu2019). Both amasitogotes and infective trypomastigotes are additionally found in the mammalian host's blood (Onyekwelu, Reference Onyekwelu2019). Hence, complete cell atlases for these life cycles would be equally valuable to understand these cell types and the development between stages via differentiation.
Importantly, these atlases would also provide a reference on which to map lower quality transcriptomes or those from experiments with low cell numbers. Howick et al., clearly demonstrated cross-species mapping of Plasmodium to characterize fixed clinical samples using a high-quality cell atlas (Howick et al., Reference Howick, Russell, Andrews, Heaton, Reid, Natarajan, Butungi, Metcalf, Verzier, Rayner, Berriman, Herren, Billker, Hemberg, Talman and Lawniczak2019). Clinical or field samples containing kinetoplastids will most likely also need to be stored before scRNA-seq can be applied. Thus, methods to improve the analysis of cryopreserved or chemically fixed parasites will be highly valuable and allow more flexibility when performing scRNA-seq in the future. With the methods discussed, scRNA-seq should allow parasitologists to reach beyond the most well-understood, laboratory-adapted species and cell types, and doing so will be valuable for the development of novel therapeutic approaches.
Perspectives
Despite their unusual approach to transcript regulation, single-cell transcriptomics is a valuable resource for kinetoplastid research. scRNA-seq should allow researchers to interrogate heterogeneous populations, study host–parasite interactions in greater detail, reconstruct maps of developmental processes, and study previously inaccessible species and rare cell types. As well as using the technology and methods discussed here, improved approaches [such as Seq-well S3 (Hughes et al., Reference Hughes, Wadsworth, Gierahn, Do, Weiss, Andrade, Ma, de Andrade Silva, Shao, Tsoi, Ordovas-Montanes, Gudjonsson, Modlin, Love and Shalek2020)] and novel computational analysis [such as machine learning approaches to integration (Lotfollahi et al., Reference Lotfollahi, Naghipourfar, Luecken, Khajavi, Büttner, Avsec, Misharin and Theis2020)] can be explored to allow larger kinetoplastid data sets to be leveraged. The generation of complete cell atlases for the most tractable species will greatly aid these aims, as will the improvement of protocols to analyse preserved samples. Equally, resources to make these large data sets accessible to the community and allow users to interrogate the data without specific bioinformatic knowledge will be valuable.
Acknowledgements
The authors thank J. Galbraith and P. Herzyk (Glasgow Polyomics, University of Glasgow) for their guidance, library preparation and sequencing. They also thank V. Howick (University of Glasgow) for providing data metrics for inclusion in this review.
Author contributions
E. M. B. and F. S. L. W. conducted literature review. All authors contributed to the discussion, writing and editing of this manuscript.
Financial support
This work was supported by the Wellcome Trust (218648/Z/19/Z to E.M.B., 104111/Z/14/ZR to T.D.O. and 103740/Z14/Z to K.R.M.), Wellcome Trust Institutional Strategic Support Fund (ISSF3) awards held at the University of Glasgow (204820/Z/16/Z awarded to E.M.B. and R.M.), the BBSRC-FAPESP (BB/N016165/1 to R.M), and the Edinburgh-Glasgow MRC Precision Medicine DTP (MR/N013166/1, F.S.L.W).
Conflict of interest
The authors declare there are no conflicts of interest.
Ethical standards
Not applicable.


 Open access