Background
Although the funding of the Canadian public pension system does not present an immediate concern, the current demographic context could potentially lead to precarious funding in the future. First, if the retirement age remains constant, the increase in life expectancy is likely to lead to added years of retirement. Second, lower fertility rates observed since the mid-1960s have now translated into a decrease in the growth rate of the labour force (Martel, Reference Martel2019). Finally, the largest cohorts of baby boomers are now reaching retirement age, fast increasing the number of retirees over the next few years. Therefore, although more and more Canadians will be reaching retirement age with the perspective of receiving benefits for a longer period of time, the number of contributors will remain relatively stable. These demographic trends could put pressure on the public pension system to such an extent that some policy makers, researchers (Hering & Klassen, Reference Hering and Klassen2010; Hicks, Reference Hicks2012) and the Canadian Institute of Actuaries (CIA) recommend increasing the retirement age (Canadian Institute of Actuaries, 2019).
In Canada, a trend towards later retirement has been observed in recent years (Bélanger, Carrière, & Sabourin, Reference Bélanger, Carrière and Sabourin2016; Carrière & Galarneau, Reference Carrière and Galarneau2011; Carrière, Légaré, & Purenne, Reference Carrière, Légaré and Purenne2015; Hicks, Reference Hicks2012; Lefebvre, Merrigan, & Michaud, Reference Lefebvre, Merrigan and Michaud2011; MacEwen, Reference MacEwen2012). Since 2000, the average retirement age among men went from 62.3 to 65.2, therefore surpassing the normal retirement age (65). Women are no exception to this upward trend, but their average retirement age is still below this threshold. Their average retirement age went from 60.6 in 2000 to 63.6 in 2020. These numbers are very similar to those observed in 1976 when Statistics Canada started estimating average retirement age.Footnote 1 Effective retirement age, providing a more accurate measure of the trend in retirement age (Carrière & Galarneau, Reference Carrière and Galarneau2011), shows that we are even underestimating the trend towards later retirement which started as far back as in the mid-1990s. This positive trend given the Canadian demographic context presented is also used to justify an increase in the normal retirement age. It is seen as a rational policy response in the context of longer life expectancy, making the assumption that added years to life are mostly years spent in good health (Milligan & Schirle, Reference Milligan and Schirle2018). However, should we expect Canadians to delay retirement to age 67 or even 70 as suggested by some? Knowing that health is an important determinant of labour force participation when one reaches age 60 or older (Au, Crossley, & Schellhorn, Reference Au, Crossley and Schellhorn2005; Bélanger et al., Reference Bélanger, Carrière and Sabourin2016; Cambois & Barnay, Reference Cambois and Barnay2009; Lefebvre et al., Reference Lefebvre, Merrigan and Michaud2011), can the health status of older workers be an obstacle to increasing the normal retirement age? To answer these questions and nurture the discussions around increasing normal retirement age, we need to better understand the trend in healthy life expectancy among adults 45–69 years of age.
This article analyzes the trend in health status of older adults, defined here as the 45–69 age group, with respect to their ability to work. To better document this trend, partial disability-free life expectancy (PDFLE) within this age group will be broken down by various levels of severity. The time series are presented for the 2000–2014 period using data from five cycles of the Canadian Community Health Survey (CCHS). The analysis of the results will make it possible to learn more about the trend in disability-free life expectancy among older adults in Canada, thus providing valuable information to policy makers in the discussions around increasing normal retirement age in a context of population aging.
Data and Methods
To compute PDFLE estimations, data on mortality and prevalence of disability observed during a similar time period are needed. Mortality data are taken from the Canadian Human Mortality Database (CHMD) put together by the Mortality and Longevity Research Team at the Department of Demography of the University of Montreal. It is a satellite database of the Human Mortality Database (HMD). The CHMD estimates life tables by gender on a yearly basis, with 2016 being the year with the latest data available. Regarding health data observed at a similar point in time, the CCHS was selected. The CCHS is a cross-sectional health survey from Statistics Canada. It was first conducted every 2 years, then on a yearly basis starting in 2007. The survey cycles for which the Health Utility Index (HUI) data are representative of the Canadian population are the following five cycles of the CCHS: 2000–2001; 2003Footnote 2 ; 2005Footnote 3 ; 2009–2010; and 2013–2014.
The target population for the CCHS excludes individuals who reside in institutions and long-term care facilities.Footnote 4 In the absence of reliable data on institutionalization rates, the decision to exclude them from the DFLE estimates had to be made. The population under study is thus restricted to individuals between 45 and 70 years of age living in a private Canadian household. Estimates are provided for the 45–69 year age group to have a better understanding of the trend in DFLE among those who are potentially older workers. The total sample of those 45–69 years old amounts to 289,840 individuals over the eight cycles at study. There were nearly 1,500 observations presenting missing values for the HUI. The final cross-sectional sample includes 93,263 men and 109,426 women between 45 and 70 years of age.
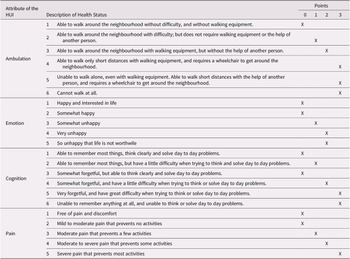
Using five cycles of CCHS raises the important question of the comparability of the data. A careful analysis of the three main health modules in Canadian health surveys (i.e., activities of daily living [ADL], HUI, and questions about functional limitations) allowed us to identify the HUI module as the one offering the most reliable data for time comparisons since the early 2000s. The HUI is a composite measure, varying between -0.36 and 1, which aims to describe the health status of the population through eight attributes: vision, hearing, speech, ambulation, dexterity, cognition, emotion, and pain (Furlong, Feeny, Torrance, & Barr, Reference Furlong, Feeny, Torrance and Barr2001). Disability status will be presented according to the severity of the disability using attributes of the HUI associated with functional limitations. Table 1 shows the attributes of the HUI (ambulation, emotions, cognition, pain)Footnote 5 that were found to be correlated with the capacity to work, translating into lower labour force participation rates among those with greater limitations.
Table 1. Distribution of points according to the value of four attributes of the HUI

Note. HUI = Health Utility Index.
PDFLE estimates aim at documenting quality of years lived by individuals in a certain age bracket. First, life expectancy during those years is computed (i.e., partial life expectancy). Second, those expected years of life are divided between various health statuses using the Sullivan method (Sullivan, Reference Sullivan1971). For example, when studying PDFLE of those between ages of 45 and 70, if no deaths are recorded, partial life expectancy for that age interval would be 25 years. Using data on disability status at these ages, we would then be able to divide these 25 years into healthy and unhealthy years. In the present study, partial life expectancy between the ages of 45 and 70 is divided between three statuses: no disability, mild disability, and moderate/severe disability.
Table 1 also shows the scale used to estimate the severity of a disability. Points are associated with each value of each attribute of the HUI and provide a cumulative score. This cumulative score is then used to classify the individual into the appropriate level of disability. By doing so, it is possible to account for multiple limitations in determining the level of disability of an individual. It was one of the limits expressed by Lefrançois, Vézina, Keefe, and Légaré (Reference Lefrançois, Vézina, Keefe and Légaré2013) when computing DFLE. Respondents were given a score ranging from 0 to 11.Footnote 6 From this cumulative score, each respondent was classified into one of the three following categories: no disability (0 points), slight disability (1–2 points), or moderate / severe disability (3–11 points). In order to construct this scale and determine the cutoff point for the three levels of severity, a correlation analysis with a work limitation variable in the survey was used.Footnote 7 The work limitation variable was preferred to the one focusing on labour market participation, because retirement can introduce a significant bias among the 45–69-year age group in the number of people who are not in the labour force.
Results
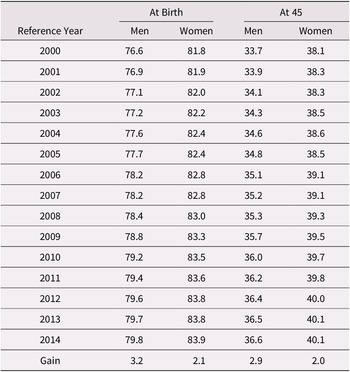
Life expectancy in Canada has risen sharply over the last century. Table 2 shows that, for both sexes, life expectancy has been steadily increasing since 2000. However, this growth has been greater for men than for women.
Table 2. Life expectancy at birth and at age 45, Canada, 2000–2014

Note. Source: Canadian Human Mortality Database (n.d.)
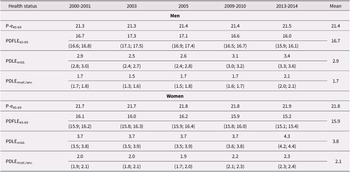
As for partial life expectancy from ages 45 to 70, Table 3 shows an increase between 2000 and 2014. From a maximum of 25 years if no one would die in that age bracket, men are expected to live a total of 21.5 years using the 2014 mortality table compared with 21.3 years in 2000. Women only added 0.2 years to that same partial life expectancy: 21.9 years compared with 21.7 years in 2000. Gains for both men and women are fairly small given that mortality at these ages is already low. There are gains to be made, but they are not as important as the ones among the population 65 years of age and older, for whom the risk of dying is much greater.
Table 3. Partial life expectancy by health status, adults 45–69 years of age and living in private households, by sex, Canada, 2000–2014

In terms of healthy years by gender, although men have a lower partial life expectancy, they can expect to live a greater number of years without a disability than women between the ages of 45 and 70.Footnote 8 This can be observed for every year under study and the gap in favour of men varies between 0.6 and 1.3 years. As mentioned, the scale that was constructed allows for an analysis of not only the number of years with or without a disability, but also of the level of disability. The number of years expected to be spent with a mild disability has fluctuated between 2.9 years (2000–2001) and 3.4 years (2013–2014) among men and has been steadily increasing since 2003. For women, the number of years of life with a mild disability is greater than that for men. It remained constant at 3.7 years during the 2000s, before increasing to 4.3 years in 2013–2014. When looking at years spent with a moderate or severe disability between the ages of 45 and 70, men’s estimates range from 1.5 years (2003) to 2.1 years (2013–2014), and women’s estimates range from from 1.9 years (2005) to 2.3 years (2013–2014).
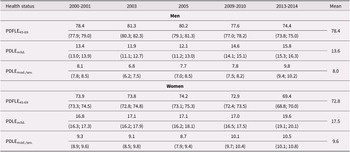
Given that men have a lower partial life expectancy than women combined with more years without a disability, they can expect to live a statistically greater proportion of their partial life expectancy without any disability (Table 4). From 2000 to 2014, that proportion varied from a high of 81.3% in 2003 to a low of 74.4% in 2013–2014 among men, and from a high of 74.2% (2005) to a low of 69.4% (2013–14) among women. Of significance is the fact that for both men and women, over the period studied, the proportion of partial life expectancy lived without any disability has been decreasing. The share of years lived with a disability between the ages of 45 and 70 shows a generally rising trend over the entire period, but more specifically since 2003 for men and since 2005 for women. Among men, the proportion of years lived with a mild disability is on average 13.6%, compared with 17.5% for women. The share of years lived with a moderate or severe disability is, on average, 8% for men compared with 9,6% for women. The trend in moderate and severe disability since 2000 is similar to the one observed for mild disability. Therefore, regardless of the severity of the disability considered (mild, moderate, or severe), partial life expectancy with a disability for those between the ages of 45 and 70 has been increasing for both genders and is greater among women, whether we look at it in absolute (5.8 years for women vs. 4.6 years for men) or in relative numbers (27% of partial life expectancy for women vs. 21.6% for men).
Table 4. Percentage of partial life expectancy between the ages of 45 and 70 according to different health statuses, by sex, individuals in private households, Canada, 2000–2014

Note. PDFLE = partial disability-free life expectancy; PDLE = partial disabled life expectancy.
Discussion
By analyzing the PDFLE time series for those between the ages of 45 and 70, the objective was to assess the health status of older adults with respect to their ability to work. The results shed light on the slight downward trend of the PDFLE45-69 estimates since the early 2000s. Although partial life expectancy for those between the ages of 45 and 70 has been slightly increasing, partial disability life expectancy for the same age group has been rising more rapidly. This means that the number of years to live with a disability during that life span is not only on the rise, but also that their importance as a proportion of life expectancy for those between the ages of 45 and 70 is increasing. The distribution of years with a disability by severity level has however remained constant over time, with approximately 62% of disability years being associated with a mild disability in men and 65% of disability years being associated with a mild disability in women. These results suggest a slight increase in morbidity since the beginning of the twenty-first century within this age group, meaning that the compression of morbidity, which would strengthen the argument for increasing the normal retirement age, has not been observed during the 2000–2014 time period.
Population aging in developed countries has fostered discussions about increasing the normal retirement age in public pension schemes. Canada has not followed in the footsteps of the many countries that have legislated such an increase. Improving life expectancy has been one of the main arguments in favour of doing so, and as was mentioned in the first section of the article, this discourse can certainly be heard in Canada. The underlying assumption is that an increasing life expectancy, because of lower risk of mortality at a given age, translates into better health. It follows that the capacity to work increases along with gains in life expectancy. The approach used in this article allows for a better understanding of the relationship between increasing life expectancy and healthy life expectancy, the latter being a much better proxy to measure the capacity to work.
There are three possible scenarios describing the relationship between quantity of life – number of years to be lived – and quality of life – quality of the added years to life.Footnote 9 One of these scenarios would make a strong case for increasing the normal age of retirement. Indeed, if years added to life would mostly be healthy years, one could argue that the capacity to work among older adults is improving. However, if added years to life are mostly years with moderate or severe disabilities, increasing life expectancy does not translate into a greater capacity to work.
In Canada, recent changes in health expectancy have not been studied extensively. This situation is mainly because of the lack of comparability of data over time (Jagger & Robine, Reference Jagger and Robine2011; Margolis & Mandich, Reference Margolis and Mandich2014; Philibert, Choinière, & Pampalon, Reference Philibert, Choinière and Pampalon2007). Margolis and Mandich (Reference Margolis and Mandich2014) looked at the trend in DFLE between 1994 and 2007. They defined disability using ADL questions by considering the number of tasks in which help was needed. The two most recent studies presented Health-Adjusted Life Expectancy (HALE) estimates from 1994 to 2010 (Colin, Lidia, & Bernard, Reference Colin, Lidia and Bernard2017) and 2015 (Bushnik, Tjepkema, & Martel, Reference Bushnik, Tjepkema and Martel2018) using the HUI score (a value between -0.36 and 1) to compute the time series. Bushnik et al. (Reference Bushnik, Tjepkema and Martel2018) identified pain and mobility restrictions as the two aspects that had the biggest negative impact on health. This overview of Canadian studies on trends in health expectancy highlights two crucial elements. First, since the mid-1990s (Martel & Bélanger, Reference Martel and Bélanger2000), no study has yet produced time series of DFLE that consider the severity of disability. Indeed, to achieve this, it is important to define disability according not only to the number of health attributes for which a need for assistance is expressed, but also according to the area of activity for which an individual develops social disadvantages (Pampalon, Choinière, & Rochon, Reference Pampalon, Choinière and Rochon2001). Second, the literature review reveals that trends in health expectancy are rarely estimated specifically for older workers, which seems important given the discourse around increasing the normal age of retirement in a context of increasing life expectancy and population aging. A French study has documented the emergence of functional disorders well before the age of 65 using the concept of PDFLE (Sieurin, Cambois, & Robine, Reference Sieurin, Cambois and Robine2011).
Therefore, the present study sheds light on two main data gaps in DFLE Canadian literature. First, it looks at the recent trend over time using the severity of the disability. Second, to our knowledge, it is the first study that looks at partial life expectancy and PDFLE among Canadians aged between 45 and 70 years of age. With the growing proportion of older adults in the labour force and discussions about a possible increase in the normal retirement age, it is important to document the specific trend of their health status in Canada. By doing so, the results are of great value when discussing the need to increase the normal age of retirement based on the simple fact that life expectancy has been increasing over the years. Some authors have used improvement in mortality rates by age to conclude that the physical ability to work at older ages has increased (Milligan & Schirle, Reference Milligan and Schirle2016, Reference Milligan and Schirle2018). To make this assertion, one has to make the assumption that mortality rates are a proxy for health status. If that would be the case, there would be no need to use measures of health expectancy. The many studies on such measures in different countries show how useful it is to take into account not only mortality rates, but also disability rates by age when trying to estimate improvement in the quality of life of populations.
The estimates of DFLE45-69 provide elements for a better understanding of the relationship between the trend in both employment rates and mortality rates since the early 2000s. As mentioned earlier, effective retirement age and employment rates among older adults have been rising since that time. In addition, a rather stable relationship between employment rates and mortality rates has been observed (Milligan & Schirle, Reference Milligan and Schirle2016). This means that longevity gains since 2000 have been almost completely associated with an equivalent increase in employment rates. The ability to work would have evolved significantly with the progress in mortality rates. According to the model of Milligan and Schirle (Reference Milligan and Schirle2016), mortality rates act as a proxy for health status in order to quantify the trend in the ability to work. However, although mortality rates have continued to decline since the beginning of the 2000s, matching the increasing labour force participation rates of older adults in Canada, the same cannot be said about the trend in morbidity. Measured through the prevalence of disability and trends in partial DFLE45-69, it appears that the additional years of life between the ages of 45 and 70 are not characterized solely by years spent in health. One could even ask whether the increase in labour force participation rates and the increasing effective retirement age since the mid–1990s could not partially explain the slight increase in morbidity among the 45–69-year age group during that same period. More research would need to look at this possible adverse effect of retiring later among some Canadians.
Along with increasing participation rates among older adults, we are in a period when baby boomers are gradually entering the age group that is 75 years of age and older. The need for assistance in everyday activities will likely be more important among these very large cohorts in the coming years. While the aging policies that are in place largely fall on the shoulders of family caregivers to provide needed assistance to disabled seniors, governments are also counting on older workers to postpone their retirement. Counting on older adults to work longer while having to be caregivers to their older parents appears to be a double-edged sword. The government can hope to save health care spending by relying on caregivers. On the other hand, if their participation in the labour market is impaired, it means less revenue for the government. Moreover, if the burden of working longer and being a caregiver has as a negative impact on their health, this can be an additional burden on the health system.
Finally, in addressing the issue of increasing responsibilities among older workers, it seems relevant to comment on the particular situation of women. They have a higher life expectancy than men, with more years lived with a disability. Moreover, not only do they live more years in poor health, women also live a greater proportion of their life in a state of disability at all ages. This is particularly worrisome considering on the one hand that their participation in the labour market has increased significantly in recent decades and, on the other hand, that they are more likely to be caregivers than men (Proulx, Reference Proulx2015; Sinha, Reference Sinha2013). It seems obvious that women will not be able to reconcile work and family responsibilities in a sustainable way in a context in which informal care were to increase while they would be asked to extend their working life.
Some limitations to this study need to be acknowledged. First, the creation of a new measure of disability proposed in this article represents a limit to the comparability of studies, both in Canada and internationally. This classification of disability is added to the many existing definitions in Canadian literature. However, the measure proposed here is tailored to both the population (45–69 years old) and the kind of activity limitations that are of interest. The goal was not to measure the need for assistance in ADLs, which is the focus of most if not all studies looking at healthy life expectancy among the population that is 65 years of age and older, but rather to measure activity limitations that are likely to have an impact on labour force participation. Also, given that the point system used in this study is based on the attributes of the HUI, an index design and one used essentially in Canadian surveys, international comparisons are very much limited.
Conclusion
By documenting the trend in health status of Canadians between the ages of 45 and 70, this article aimed to deepen our understanding of the increase in life expectancy and its impact on the ability to extend the working life of older adults. The results showed a slight increase in the prevalence of disability among adults 45–69 years of age. These trends in disability rates resulted in a decrease in PDFLE45-69. Although these results do not indicate a clear trend in the expansion of morbidity, they are far from suggesting that added years to life are essential healthy years. The trends revealed do not support the idea of increasing the normal retirement age solely on the presumption that decreasing mortality rates should be interpreted as a greater capacity to work at a given age. In addition, although women have a longer partial life expectancy between the ages of 45 and 70, they spend a greater proportion of these years in a state of disability. Considering that they are also much more likely to become a caregiver to an older parent than men, working longer may add to their multiple roles and responsibilities throughout their life course, increasing healthy life expectancy gaps between genders. Improving our knowledge of the determinants of their health will help identify actions to be taken to limit this disadvantage. It would also be interesting to be able to provide data on PDFLE by level of education or socio-economic status. This would provide a better idea of either a closing or widening gap by socio-economic status in Canada, which can play a key role in the quantity and quality of retirement years (Carrière, Légaré, Léger St-Cyr, Ronteix, & Diaconu, Reference Carrière, Légaré, Léger St-Cyr, Ronteix and Diaconu2015).
Acknowledgements
This research was made possible through funding from Social Sciences and Humanities Research Council, as a part of the research project called “Delaying retirement and old age: Baby boomers redefining late life transitions in an aging population” led by Yves Carrière. We would also like to thank the Centre for Research and Expertise in Social Gerontology (CREGES) for funding this research.