


Introduction
Local adaptation is a common phenomenon whereby an organism's fitness in its local environment is higher than in a foreign environment (Kawecki and Ebert, Reference Kawecki and Ebert2004; Blanquart et al. Reference Blanquart, Kaltz, Nuismer and Gandon2013). One of the prime situations for such local adaptation to occur are host–parasite interactions; one of the coevolving antagonists, often the parasite, performs better with its local compared with a foreign antagonist (reviewed by Kaltz and Shykoff, Reference Kaltz and Shykoff1998; Kawecki and Ebert, Reference Kawecki and Ebert2004; Greischar and Koskella, Reference Greischar and Koskella2007; Hoeksema and Forde, Reference Hoeksema and Forde2008).
Many parasites have evolved the ability to manipulate the behaviour or other phenotypic features of their host to increase their own fitness beyond the benefits they would gain from normal exploitation. In complex life cycle parasites this host manipulation often takes the form of predation enhancement increasing the likelihood of transmission to a subsequent host (Holmes and Bethel, Reference Holmes and Bethel1972; Poulin, Reference Poulin1994, Reference Poulin2010; Poulin and Thomas, Reference Poulin and Thomas1999; Moore, Reference Moore2002, Reference Moore2013). When predation would be fatal, however, e.g. before a parasite is infective to the next host, host manipulation can take the shape of predation suppression, i.e. reduce the host's predation susceptibility (Hammerschmidt et al. Reference Hammerschmidt, Koch, Milinski, Chubb and Parker2009; Dianne et al. Reference Dianne, Perrot-Minnot, Bauer, Gaillard, Léger and Rigaud2011; Weinreich et al. Reference Weinreich, Benesh and Milinski2013; Gopko et al. Reference Gopko, Mikheev and Taskinen2015; Hafer and Milinski, Reference Hafer and Milinski2016). Host manipulation occurs in a wide range of host–parasite systems in various environments offering the potential for local adaptation. Additionally, the underlying mechanisms might require a fine-tuned interplay between host and parasite. Acanthocephalans for example are able to alter brain serotonin levels suspected to be involved in host manipulation in a coevolved gammarid host but not in a novel gammarid host (Tain et al. Reference Tain, Perrot-Minnot, Cezilly and Cézilly2007). Franceschi et al. (Reference Franceschi, Cornet, Bollache, Dechaume-Moncharmont, Bauer, Motreuil and Rigaud2010) tested local adaptation in the same system using different populations of the acanthocephalan and its coevolved gammarid host. In accordance with other studies on local adaptation in host parasite–interactions (reviewed by Kaltz and Shykoff, Reference Kaltz and Shykoff1998; Kawecki and Ebert, Reference Kawecki and Ebert2004; Greischar and Koskella, Reference Greischar and Koskella2007; Hoeksema and Forde, Reference Hoeksema and Forde2008), they found a tendency for higher infection success in local vs foreign parasites (Franceschi et al. Reference Franceschi, Cornet, Bollache, Dechaume-Moncharmont, Bauer, Motreuil and Rigaud2010). However, Franceschi et al. (Reference Franceschi, Cornet, Bollache, Dechaume-Moncharmont, Bauer, Motreuil and Rigaud2010) did not observe any local adaptation with regard to host manipulation. Hosts showed some indication of evolved resistance to host manipulation, but between populations hosts were no less susceptible to host manipulation by their sympatric compared with an allopatric parasite. Viruses can be locally adapted to their host plant. This local adaptation can include changes in vector behaviour via altered attractiveness of the host plant (Mauck et al. Reference Mauck, De Moraes and Mescher2014).
The cestode Schistocephalus solidus has a three host life cycle. As first intermediate host it infects a cyclopoid copepod. This copepod has to be eaten by a three-spined stickleback (Gasterosteus aculeatus) for the parasite to continue its life cycle. Reproduction takes place in a piscivorous bird where the parasite usually reproduces and dies within a week (Clarke, Reference Clarke1954; Dubinina, Reference Dubinina1980). Despite its mobile final host, the population structure of S. solidus is well structured both globally (Nishimura et al. Reference Nishimura, Heins, Andersen, Barber and Cresko2011) and regionally (Sprehn et al. Reference Sprehn, Blum, Quinn and Heins2015). In its second specific intermediate stickleback host, S. solidus shows clear evidence of coadaptation and local adaptation to its sympatric stickleback population (Kalbe et al. Reference Kalbe, Eizaguirre, Scharsack and Jakobsen2016; Scharsack et al. Reference Scharsack, Franke, Erin, Kuske, Büscher, Stolz, Samonte, Kurtz and Kalbe2016; Hamley et al. Reference Hamley, Franke, Kurtz and Scharsack2017; Weber et al. Reference Weber, Kalbe, Shim, Erin, Steinel, Ma and Bolnick2017). In their first intermediate copepod host, not yet infective S. solidus reduce their hosts’ activity (Hammerschmidt et al. Reference Hammerschmidt, Koch, Milinski, Chubb and Parker2009; Benesh, Reference Benesh2010a; Hafer and Benesh, Reference Hafer and Benesh2015; Hafer and Milinski, Reference Hafer and Milinski2015) and predation susceptibility (Weinreich et al. Reference Weinreich, Benesh and Milinski2013). Once the parasite becomes infective, there is a switch in host manipulation (Hammerschmidt et al. Reference Hammerschmidt, Koch, Milinski, Chubb and Parker2009; Hafer and Milinski, Reference Hafer and Milinski2015) and activity (Urdal et al. Reference Urdal, Tierney and Jakobsen1995; Wedekind and Milinski, Reference Wedekind and Milinski1996; Hammerschmidt et al. Reference Hammerschmidt, Koch, Milinski, Chubb and Parker2009; Hafer and Milinski, Reference Hafer and Milinski2015) and predation susceptibility (Urdal et al. Reference Urdal, Tierney and Jakobsen1995; Wedekind and Milinski, Reference Wedekind and Milinski1996) increases. This increase in activity, however, has only been observed in some studies (Urdal et al. Reference Urdal, Tierney and Jakobsen1995; Wedekind and Milinski, Reference Wedekind and Milinski1996; Hammerschmidt et al. Reference Hammerschmidt, Koch, Milinski, Chubb and Parker2009; Hafer and Milinski, Reference Hafer and Milinski2015), but not in others (Benesh, Reference Benesh2010a; Hafer and Benesh, Reference Hafer and Benesh2015) and might be due to different populations used in these studies. Hence, in this study I experimentally tested for population differences and potential local adaptation of host manipulation using two different populations in a fully crossed design.
Material and methods
Hosts
Copepods (Macrocyclops albidus) from both populations stem from stock that has been maintained in the laboratory for several years (van der Veen and Kurtz, Reference van der Veen and Kurtz2002). One originated from Neustädter Binnenwasser, Germany, the other from Lake Skogseidvatnet, Norway. For better readability, I will refer to them as German and Norwegian hosts respectively, throughout the paper, even so they may be different from other host populations in these countries. On the day prior to infection, adult male copepods were distributed to 24-well microtitre plates with about 1 mL of water. Copepods from both populations were placed on each plate to avoid confounding copepod population with potential plate effects. Copepods were maintained at 18 °C in a 16/8 h light/dark cycle and their wells were cleaned if necessary and they were fed with five Artemia sp. naupili every other day. Feeding occurred always on the day when no behavioural recordings (see below) took place. At the same time I checked for dead copepods, but since mortality was very low (less than 5%), I was unable to use it for any analysis.
Parasites
Schistocephalus solidus originated from the same populations as the copepods, i.e. German and Norwegian parasites. Parasites were originally obtained by dissecting wild-caught three-spined sticklebacks and breeding the adult parasites in pairs in an in vitro system (Smyth, Reference Smyth1946; Wedekind, Reference Wedekind1997). For parasites from Germany, I used a F1 generation bred from parasites maintained in the laboratory for one generation due to difficulties in obtaining fresh parasites for breeding. I used 6 different families for German parasites (14–27 copepods per family and treatment resulting in 3–9 infected copepods per family and treatment) and 5 different families for Norwegian parasites (18–32 copepods per family and treatment resulting in 3–10 infected copepods per family and treatment), since in one Norwegian parasite family all but one coracidia failed to hatch. This resulted in 576 copepods over all treatments (NO_c: 33, NO_no: 113, NO_ger: 122, GER_c: 39, GER_no: 121, GER_ger: 148; NO/no: Norway, GER/ger: Germany, c: Unexposed controls; Capital letter represent host population, small letters represent parasite population), 190 of which were infected and available for the behavioural analysis (NO_c: 28; NO_no: 32; NO_ger: 35; GER_c: 35; GER_no: 28; GER_ger: 32). Parasite eggs were stored in the fridge (4 °C) until use, incubated for approximately 3 weeks at 20 °C, and then exposed to light over night to induce hatching (Dubinina, Reference Dubinina1980). Infection took place by exposing copepods to one coracidium each. Copepods that were used as uninfected controls received no coracidia but were otherwise treated the same. Infection treatments were equally spread over all plates and distributed randomly within each plate. On day 8 post infection, I checked the infection status for a subset of copepods and recorded presence or absence of a cercomer as proxy for development (Benesh, Reference Benesh2010a, Reference Beneshb; Benesh and Hafer, Reference Benesh and Hafer2012). The remaining copepods were only checked for infection on day 16 post infection (i.e. after all behavioural trials had been conducted).
Behavioural recordings
Copepod behaviour was recorded by placing a plate with copepods on an apparatus that dropped it by about 3 mm (Hammerschmidt et al. Reference Hammerschmidt, Koch, Milinski, Chubb and Parker2009; Benesh, Reference Benesh2010a; Hafer and Benesh, Reference Hafer and Benesh2015; Hafer and Milinski, Reference Hafer and Milinski2015, Reference Hafer and Milinski2016). This simulates a failed predator attack after which the copepod should behave as if an enhanced predation risk exists and avoid movement. One minute after placing the plate on this apparatus, I initiated the drop and recorded copepod behaviour for 15 min using a HD-camera (MHD-13MG6SH-D, Mintron, Taiwan).
From these video recordings I extracted one image every two second for 90 seconds in ImageJ (Schneider et al. Reference Schneider, Rasband and Eliceiri2012) at two different time points, starting 10 s after the simulated predator attack to exclude the initial reaction and 90 seconds at the very end of the recording to allow the copepods to recover. Using a custom-made python (Python Software Foundation. Python Language Reference, version 2.7. Available at http://www.python.org) program, each well was automatically extracted from these images and the copepod position recorded. To find a copepod's position, a mean image was calculated from all images available for a copepod on any given day and subtracted from each individual image. Since the copepod was the only moving object within each well, this resulted in the copepod's location being the position with the highest difference between each image and the mean image. To exclude random noise leading to small differences between pixels that could have resulted in the copepod being recorded as moving by very few pixels when it remained stationary, a copepod was only considered moving if it moved by at least 5 pixel (about one copepod length).
Statistical analysis
All statistics were conducted in R (R Development Core Team and R Core Team, 2016).
To analyse infection success, only exposed copepods that had survived long enough to check them for infection (8 or 16 days post infection) were used. For development (i.e. presence of absence of a cercomer) all infected copepods for which data on cercomer presence was available (i.e. that were checked 8 days post infection) were used. Infection success and development were then analysed separately using generalized linear mixed models with binomial error structure and parasite family as random effect. Host and parasite population and their interaction were stepwise included into the model. Subsequently, I compared the models using AIC and used likelihood ratio tests to obtain P values for this comparison. A more complicated model was accepted if it was significantly better at explaining the data than a less complicated model. Additionally, I used a generalized linear model to investigate development using the same fixed factors and binomial error family, but excluding the random factor of parasite family.
To analyse host activity (i.e. proportion of time spent moving), copepods that died before the end of the experiment or in which exposure had not resulted in an infection were excluded from the dataset. For statistical analysis, I used generalized linear mixed models in the lme4 package (Bates et al. Reference Bates, Maechler, Bolker and Walker2015). I included parasite age and time point (after a simulated predator attack vs after a recovery period) as fixed effects and copepod identity and parasite family as random effects to account for variation between individual copepods and parasite families, respectively. I then stepwise added parasite population and host population and their interaction with parasite age and day and with each other. I compared the models using AIC and used likelihood ratio tests to obtain P values for this comparison. A model was accepted as having a better fit than a less complicated one if it explained the data significantly better. Additionally, I compared a model containing parasite population to one containing infection to check whether any explanatory power of parasite population might be due to infection rather than actual parasite population. As both host population and copepod population and their interaction with parasite age and time point significantly influenced host activity, I conducted post hoc tests using Tukey tests with general linear hypotheses within the multcomp package to obtain P values for each comparison that were adjusted for multiple testing (Hothorn et al. Reference Hothorn, Bretz and Westfall2008). I defined contrasts for the post hoc tests to contain all pairs in which either host or parasite population were the same and the comparison between the two sympatric pairs. Again, parasite family was included as random effect. I used separate post hoc tests for each parasite age and time point to investigate differences between different host–parasite combinations.
To test whether I had enough power to detect local adaptation, I conducted a power analysis for generalised linear models using the pwr-package (Champely, Reference Champely2017) in R (R Development Core Team and R Core Team, 2016). This allowed me to estimate the power of my analysis, i.e. the probability of finding an existing effect at P < 0·05 with my sample size (i.e. number of copepods) given a specific effect size (either small, medium or large, i.e. 0·1, 0·3 and 0·5 respectively, following Cohen (Reference Cohen1988)). I did this for each of my response variables, i.e. infection success, development and host activity.
Results
Do infection rates differ?
Infection success did not significantly depend on host or parasite population or their interaction (P > 0·08, Table 1, Fig. 1a). A subsequent power analysis revealed that sample size was sufficient to pick up even small effect sizes (power = 88%).
Fig. 1. Influence of host and parasite population on infection success (a) and development (b). Development represents the presence or absence of a cercomer 8 days post infection. Error bars represent 95% CI. Asterix indicates significant differences. NO/no: Norway, GER/ger: Germany. Capital letters represent host population, small letters represent parasite population. N: infection success: NO_no: 106, NO_ger: 120, GER_no: 118, GER_ger: 144; development: NO_no: 15, NO_ger: 16, GER_no: 10, GER_ger: 15.
Table 1. Analysis of variance on the outcome of the generalized linear models to test for population differences between infection success and development.
Whether or not a copepod was infected (infection success, AIC: 568)/possessed a cercomer 8 days post infection (development, AIC: 63) was used as response variable. Parasite family was used as random effect, host and parasite population were used as predictor variables.
Does development differ?
Development did not depend on host or parasite population or their interaction (P > 0·1, Table 1). Due to the small sample size, power to pick up a small effect was however only 18% (80% for medium effects). Interestingly, if the random effect of parasite family was excluded from the model, German parasites developed significantly faster than Norwegian parasites (χ 253,1 = 4·19, P = 0·041) irrespectively of their host population (P > 0·3, Fig. 1b).
Host manipulation
Host activity was significantly affected by parasite population and its interaction with time point and parasite age (P < 0·001, Table 2). Including parasite population into the model explained the data significantly better than using only whether hosts were infected or not (AIC: −599 vs −703, χ 228,8 = 122, P < 0·001). Copepod population only had a marginally significant effect on host activity (P = 0·056, Table 2), but interacted significantly with time point and parasite age (P < 0·001, Table 2). Uninfected copepods from different populations did not behave significantly different from each other (P > 0·07, Table 3, Fig. 2, grey lines), except on day 12 when uninfected copepods from Norway were more active than uninfected copepods from Germany after the simulated predator attack (P = 0·048, Table 3, Fig. 2, grey lines). This indicates that differences in activity between host populations were indeed related to host manipulation.
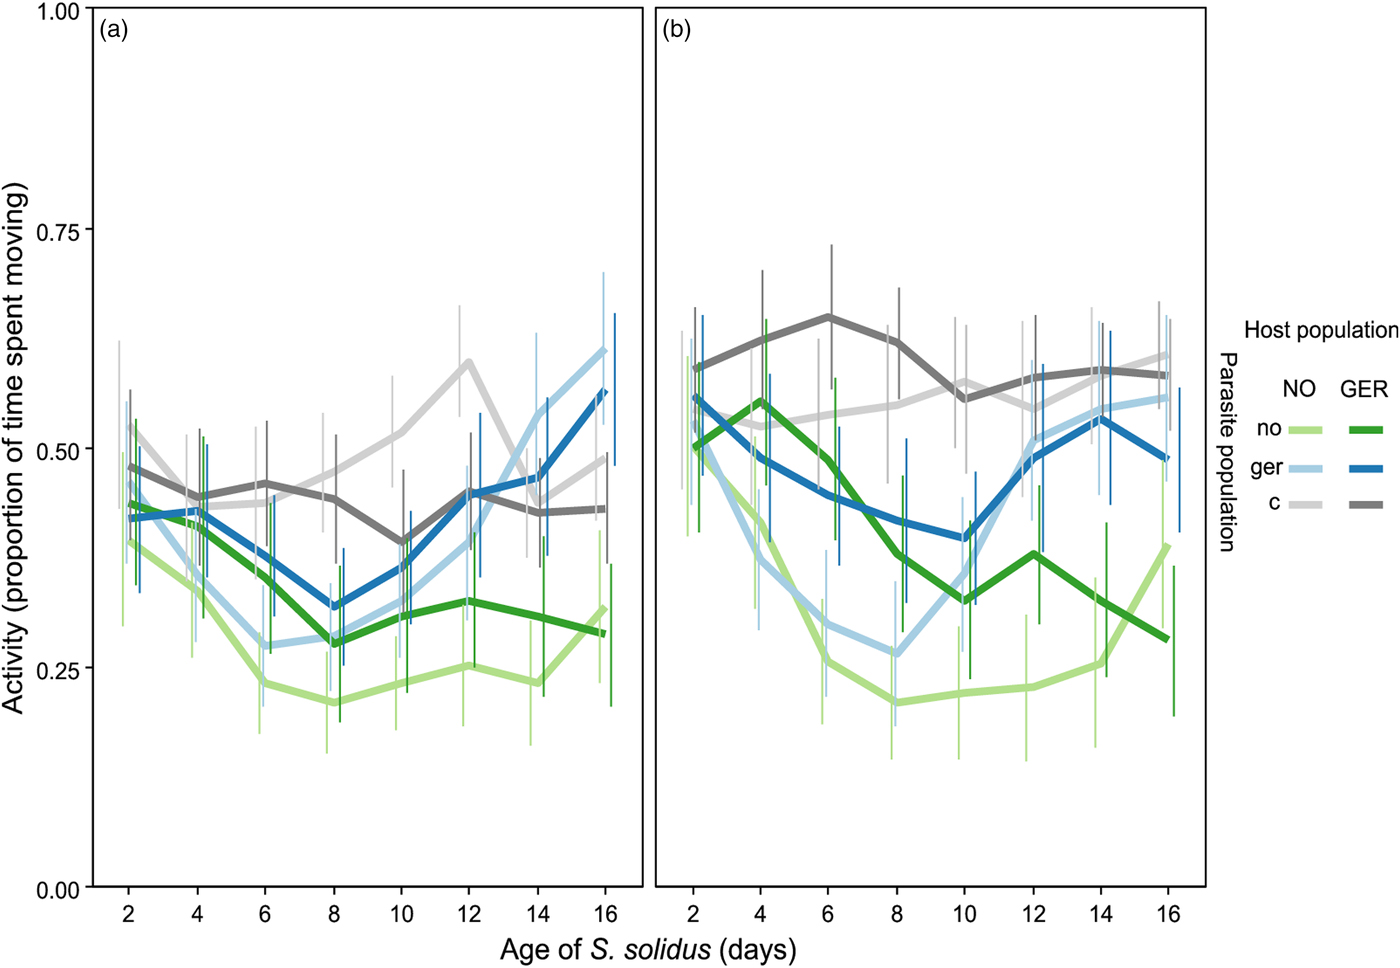
Fig. 2. Host activity after a simulated predator attack (a) and after a recovery period (b). Error bars represent 95% CI. NO/no: Norway, GER/ger: Germany, c: Unexposed controls. Capital letters represent host population, small letters represent parasite population. N: NO_c: 28; NO_no: 32; NO_ger: 35; GER_c: 35; GER_no: 28; GER_ger: 32.
Table 2. Outcome of likelihood ratio tests on generalized linear models for copepod activity.
The initial model included the proportion of time a copepod spent moving (activity) as response, time (i.e. after a simulated predator attack vs after a recovery period) and parasite age as fixed effects and copepod identity and parasite family as random effects (AIC: −540). Subsequently, I added parasite population, its interaction with time and parasite age, host population, its interaction with time and parasite age and the interaction between host and parasite population. Test statistics and MCMC-estimated P values are for the comparison with the preceding model.
Significant P values are highlighted in bold.
Table 3. Outcome of multiple comparisons for host activity between populations for each parasite age and time.

Significant P values (P < 0·05) are highlighted in bold, marginally significant ones (P < 0·1 in italics). NO/no: Norway, GER/ger: Germany. Capital letter represent host population, small letters represent parasite population.
Notably, however, there was no significant interaction between host and parasite population (P = 0·21, Table 2), which would indicate local adaptation (Kawecki and Ebert, Reference Kawecki and Ebert2004; Blanquart et al. Reference Blanquart, Kaltz, Nuismer and Gandon2013). While power to detect such an effect if it was small was only 48%, I did have enough power (>99%) to detect any medium or large effect.
Differences between populations in host manipulation
Within sympatric pairs, German host–parasite pairs were more active than Norwegian ones resulting in differences between populations once host manipulation had set in (from 6 days post infection onwards, Table 3, Fig. 2, light green vs dark blue line). Once the parasite reached infectivity (from 12 days post infection onwards), differences became more pronounced both after the simulated predator attack and after a recovery period (P < 0·005, Table 3, Fig. 2b). On day 16, differences after a recovery period became non-significant (P = 0·48, Table 3), but remained significant after the simulated predator attack (P = 0·001, Table 3).
Are these differences driven by host or parasite population?
Within the same host population, significant differences between parasite populations only appeared after the parasites had reached infectivity (from 12 to 14 days post infection onwards, P < 0·04, Table 3, Fig. 2, light green vs light blue line and dark green vs dark blue line) – German parasites induced higher activity than Norwegian parasites.
Differences between host populations infected by the same parasite population were much less pronounced and occurred exclusively before the parasite reached infectivity and only after a recovery period (P < 0·04, 6 days post infection (only Norwegian parasites) and 8 days post infection). During this time activity was reduced more strongly in Norwegian than in German copepods.
Discussion
Host manipulation, but not infection susceptibility, differs between different host and parasite populations of S. solidus. However, parasites do not perform better in their sympatric host or hosts better when infected by their sympatric parasite. So there is no evidence for local adaptation between hosts and parasites in this system. Rather, both parasite and host seem to engage in their usual host manipulation and reaction to that host manipulation irrespectively of whether they infect or are infected by a sympatric or an allopatric host or parasite, respectively. The effect of host and parasite population differs between infective and not yet infective parasites. Differences in not yet infective parasites are relatively small and driven by host population, while the much larger differences once parasites reach infectivity seem to be driven by parasite population.
Parasite populations also seem to differ in how fast they develop with German parasites developing faster than Norwegian ones irrespective of host population. However, this effect was not visible when controlling for parasite family. This could have been due to reduced power when accounting for parasite family in the statistical model and high variation between families since very few parasite individuals were available for each family–treatment combination and development could either be slow or fast (i.e. absence or presence of a cercomer). Development in copepods can have some carryover effects for development in sticklebacks; parasites that develop faster in the copepods also grow to larger sizes in sticklebacks (Benesh and Hafer, Reference Benesh and Hafer2012), which correlates directly with the number of eggs produced in the final bird host (Wedekind et al. Reference Wedekind, Strahm and Schärer1998). Nevertheless, since I did not observe any interaction between host and parasite populations, there is no indication for different carryover effects between parasites from sympatric and allopatric first intermediate hosts.
Host manipulation prior to the parasite reaching infectivity, i.e. predation suppression, seems to be influenced by copepod population. This could indicate that German hosts are more resistant to this initial host manipulation than Norwegian hosts. The parasites may benefit from these differences through increased survival leading to a higher likelihood to reach the next host. From the parasite's perspective this initial predation suppression should evolve more easily than predation enhancement, since it need not specifically target a certain subsequent host, but any reduction in predation will benefit the parasite (Parker et al. Reference Parker, Ball, Chubb, Hammerschmidt and Milinski2009). This could make the evolution of predation suppression less sensitive to different selection pressures, e.g. if predation differs between populations.
Parasite population determines the extent of the increase in activity once the parasite reaches infectivity (predation enhancement). It occurs in German parasite but not in Norwegian parasites. Interestingly, a similar increase in activity as in German parasites also occurs in other species of complex life cycle parasites that use copepods as first intermediate host and fish as subsequent host (Poulin et al. Reference Poulin, Curtis and Rau1992; Hafer and Milinski, Reference Hafer and Milinski2016). Could the absence of this increase in host activity be a side effect of faster development? Or, put differently, could Norwegian parasites simply never have become infective throughout the experiment? In a previous study, using the same Norwegian population, some parasites were able to infect sticklebacks already 11 days post infection (Benesh and Hafer, Reference Benesh and Hafer2012). After 2 weeks, about 50% of Norwegian parasites are infective to sticklebacks (Benesh et al. Reference Benesh, Weinreich and Kalbe2012) and by 3 weeks post infection, nearly all can successfully infect sticklebacks (Benesh and Hafer, Reference Benesh and Hafer2012). Even in Norwegian parasites of that age, Benesh (Reference Benesh2010a) observed no increase in host activity. The timing of when parasites reach infectivity seems similar to German parasites (Hammerschmidt et al. Reference Hammerschmidt, Koch, Milinski, Chubb and Parker2009). So it seems unlikely that the observed differences in host manipulation by infective parasites are due to delayed development. Additionally, in agreement with a previous study in the same system (Hafer and Benesh, Reference Hafer and Benesh2015), I found no effect of development (i.e. cercomer absence or presence) on host activity (see Supplementary information). So why did the parasites from the Norwegian population not induce any increase in activity? Predation enhancement through increased host activity serves to enhance transmission to the subsequent host. Indeed, it has been shown that predation is enhanced in copepods harbouring infective S. solidus (Urdal et al. Reference Urdal, Tierney and Jakobsen1995; Wedekind and Milinski, Reference Wedekind and Milinski1996) and that predation susceptibility correlates positively with host activity (Wedekind and Milinski, Reference Wedekind and Milinski1996). Urdal et al. (Reference Urdal, Tierney and Jakobsen1995) and Wedekind and Milinski (Reference Wedekind and Milinski1996) both used populations in which activity was clearly enhanced by the presence of infective parasites. Accordingly, parasites in less active (i.e. less manipulated hosts) should not benefit from enhanced predation (and hence transmission). Predation enhancement comes at the cost of enhanced fatal predation by dead-end predators (Mouritsen and Poulin, Reference Mouritsen and Poulin2003; Seppälä et al. Reference Seppälä, Valtonen and Benesh2008). I am not aware of any data as to whether the risk of dead-end predation differs between the populations used in the current study, but if so, a strong risk of dead-end predation should select against predation enhancement or select for selective predation enhancement to only correct predators (Parker et al. Reference Parker, Ball, Chubb, Hammerschmidt and Milinski2009).
In its second intermediate host, the three-spined stickleback, S. solidus shows some evidence of local adaptation. Using the very same host and parasite populations used in this study, Kalbe et al. (Reference Kalbe, Eizaguirre, Scharsack and Jakobsen2016) observed that Norwegian S. solidus were better in infecting the Norwegian stickleback population compared with parasites from the German population. Additionally, Norwegian parasites grew to a much larger size than German parasites in either host population, but within their own host population, both grew to a similar (potentially optimal) size (Kalbe et al. Reference Kalbe, Eizaguirre, Scharsack and Jakobsen2016). Recently, Hamley et al. (Reference Hamley, Franke, Kurtz and Scharsack2017) also observed such a pattern consistent with the idea of an optimal size in other populations of S. solidus and sticklebacks; Parasites grew to a similar size in their sympatric host population but not in an allopatric host population (Hamley et al. Reference Hamley, Franke, Kurtz and Scharsack2017). The parasite could be locally adapted to exploit its host and cope with its immune system at an optimal level resulting in maladaptive under- or overexploitation when infecting hosts from the wrong population (Kalbe et al. Reference Kalbe, Eizaguirre, Scharsack and Jakobsen2016; Hamley et al. Reference Hamley, Franke, Kurtz and Scharsack2017). Similarly, S. solidus should be locally adapted to its first intermediate copepod host. In both cases, the parasite shows higher rates of gene flow due to the mobility of its final bird host. Such higher gene flow is predicted to render an evolutionary advantage in an arms race by providing access to novel genes (Greischar and Koskella, Reference Greischar and Koskella2007; Hoeksema and Forde, Reference Hoeksema and Forde2008; Gandon and Nuismer, Reference Gandon and Nuismer2009; Blanquart et al. Reference Blanquart, Kaltz, Nuismer and Gandon2013). This seems to be more important in deciding who wins an arms race than generation times (Kaltz and Shykoff, Reference Kaltz and Shykoff1998; Greischar and Koskella, Reference Greischar and Koskella2007; Hoeksema and Forde, Reference Hoeksema and Forde2008), which are much shorter in copepods, but similar in S. solidus and sticklebacks. Unlike the specific second intermediate stickleback host, Macrocyclops albidus is just one of many potential first intermediate hosts of S. solidus. This could make local adaptation of the parasite to one particular host population more difficult due to the large host diversity (Lajeunesse and Forbes, Reference Lajeunesse and Forbes2002). In turn, local adaptation of copepods to S. solidus might be hindered by probably very low parasite prevalence (Zander et al. Reference Zander, Groenewold and Strohbach1994; Pasternak et al. Reference Pasternak, Huntingford and Crompton1995; Hanzelová and Gerdeaux, Reference Hanzelová and Gerdeaux2003), reducing selection pressures. I cannot rule out that some evidence of local adaptation was missed, since I used only two different populations and some pattern of local adaption could have emerged if I had added further populations. Notably, however, Franceschi et al. (Reference Franceschi, Cornet, Bollache, Dechaume-Moncharmont, Bauer, Motreuil and Rigaud2010) also found no evidence for host manipulation to be locally adapted in gammarids and their acanthocephalan parasites despite using more populations and observing a prevalence that should be high enough to impose selection on the host. Despite no evidence for local adaptation between hosts and parasites, there could be some local adaptation to other environmental factors such as predation underlying the differences in host manipulation observed. Understanding such factors could help shed light on the selection pressures resulting in the evolution and maintenance of host manipulation.
Supplementary material
The supplementary material for this article can be found at https://doi.org/10.1017/S0031182017001792
Acknowledgements
I would like to thank M. Schwarz for technical assistance, F. Hahmann for help with data analysis, and M. Milinski and two anonymous reviewers for helpful comments on an earlier version of this manuscript.
Financial support
This work was supported by the Max-Planck-Society.


 Open access