

What are the main limitations of commonly used performance indicators? In other words, do we really need a new performance indicator to measure company success? Most performance indicators induce managers to focus on the short term and accept higher levels of risk. We therefore propose a new indicator, called VOLARE, which integrates existing performance indicators and allows us to uncover sustained superior performance (SSP). Companies that achieve SSP are the most resilient. VOLARE not only has an effect on stock prices, it changes the way in which business units can allocate resources and make ex ante assessments of the attractiveness of an industry or an investment.
The Limitations of Commonly Used Performance Indicators
Probably one of the most effective ways of influencing the way that managers make decisions is to change the parameters with which performance indicators are selected and bonuses are calculated. Which performance measures should be used in business? The banking sector is able to calculate a variety of indicators and their impacts on strategy. All banks listed in Table 2.1, with the exceptions of UBS and Lloyds, can be said to be ‘the best’ according to at least one performance indicator. The Bank of America is first in terms of revenue, but if we consider EBIT (earnings before interest and taxes), the lead bank becomes CitiGroup. UBS, which appears second based on ROE (return on equity) in 2010, and Lloyds, which is third based on ROE from 2000 to 2010, are also close to the top according to at least one parameter. The question that Table 2.1 gives rise to is: Which performance category should be maximized?
Table 2.1 The variety of performance indicators: the banking example
 |
* EVA (economic value added = NOPAT – (WACC x equity).
** TSR (total shareholder return) = (2010 dividends + 2010 share price – 2009 share price)/2009 share price.
The first step in raising the level of firm resilience is knowing how to measure it properly. There is no test for resilience if there are no external shocks. However, given the economic and financial crises that are disrupting the environment in which companies operate, this condition is unfortunately more persistent than ever. Above all, there can be no resilience without adopting a long-term perspective and without considering the risk associated with that perspective. As mentioned in Chapter 1, resilience is defined as the process by which firms make strategic decisions that increase their robustness, recovery and resourcefulness, and thereby ensure stable and consistent performance over time. This ability can only be evaluated when considering the medium- to long-term horizon. Like all performance indicators, we can only assess the performance of the past with the hope of gleaning information that will assist in upcoming business decisions. Notably, most performance indicators commonly used by companies actually only refer to the short term.
The measurement of performance using the correct variables serves as the methodological basis for building organizational resilience. Moneyball, Michael Lewis’s bestseller (Lewis, Reference Lewis2004), describes how the Oakland Athletics (OA), an American baseball team, selected the appropriate indicators to enable the managers to inexpensively build a winning team. Prior to the adoption of the new method, OA based its decisions on the opinions of scouts, who viewed players as the first unit of measure. As such, they assessed their abilities to run, throw and hit. As a result, the team started losing games. The indicators used by the scouts no longer appeared to work. The team found itself in a state of crisis. It sold its top talent but could not afford to acquire great substitutes. Billy Beane, the team’s general manager, proposed recruiting based on a different set of calculations developed with the help of the young economist Peter Brand. Brand argued that assessing the batting average of individual players was not important. Rather, it was more important to analyse their ability to get to first base. The players, coaches, fans, commentators and the whole world of baseball were sceptical and critical of this approach, especially in the beginning when losses continued. Eventually, however, OA beat every record for consecutive victories, as many as twenty, and the team was on the verge of the final victory of the season.
The book was published in the early 2000s, but its main message has not yet been fully embraced by companies. The majority of managers continue to rely on poorly selected statistics (Mauboussin, Reference Mauboussin2012). The problem may be related to the cognitive limitations of the people who have to use the performance indicators or the limitations of the indicators themselves. A person can make errors of judgment due to excessive confidence in their own analytical abilities (overconfidence bias), a low propensity to question the most common practices (status quo bias) or a tendency to use simple indicators that are already available (availability bias) (Mauboussin, Reference Mauboussin2012). However, in our study of resilience, we are more interested in the limitations of the indicators themselves.
Numerous factors highlighted in the literature (Pintea, Reference Pintea2012) should help managers design an appropriate set of performance indicators. Such indicators should be linked to the business strategy, and they should measure results rather than their causes. They should be timely. Moreover, they should be multi-dimensional, and they should detect the effects of interdependent actions. Indirect parameters lend themselves to manipulation and almost all of them are based on a short-term perspective. Many managers attempt to optimize economic measures, such as ROE, ROA (return on assets) or absolute EBIT. These measures provide an indication of economic performance in the previous year, but they are not able to take the medium- and long-term effects of past decisions into account. If we want sustainable performance, we must begin to measure it.
Some CEOs try to maximize revenue, given that company size seems to be correlated with the ability to pay higher wages and offer more opportunities to pander to the egos of top managers. Other companies maximize EBIT and cash flow, as this serves as a basis for paying dividends, making investments and repaying debt. The few companies that still try to maximize EVA (economic value added) seek returns greater than their cost of capital, sometimes through an increase in the debt/equity ratio and through strategies that boost short-term results. Top managers whose performance is measured on the basis of total shareholder return (TSR) try to nurture analysts’ and investors’ dreams of growth. As share prices are greatly influenced by the expectations of investors, companies have only minimal control over TSR in the short term. If they are good at creating high expectations and are, therefore, able to push stock prices higher than their real value, they risk shareholders becoming dissatisfied when they realize that their expectations were inflated. Table 2.2 summarizes the benefits and shortcomings of traditional performance measures.
Table 2.2 Benefits and shortcomings of performance measures
| Performance Measures | Benefits | Concerns |
|---|---|---|
|
|
|
|
|
|
|
|
|
|
|
|
|
|
|
All of the indicators described above can be viewed as VOLARE complements: they give short-term, limited information that is subject to fluctuations (i.e. due to new accounting policies or to shifts in the firm’s industry). This makes it impossible to reach reliable conclusions about the performance of a company in a given period of time. As Table 2.2 shows, the short-term perspective is not the only limitation of these performance indicators. Generally, these measures do not take a company’s risk exposure into account. Even the average ten-year ROE is unable to provide feedback on actual performance that is linked to the volatility of results as a measure of risk. However, informed investors make decisions on where to invest based on the risk/return profile of an investment opportunity. For example, small investors who have to choose between buying Greek and German bonds at the same rate of interest will surely choose the less risky German bonds.
After the 2008 crisis, many companies divested risky activities or those not directly related to their core businesses. In 2012, Kodak announced that it would cease making digital cameras, pocket video cameras and digital picture frames, and instead focus on the corporate digital-imaging market (Rochester Business Journal, 2012).Footnote 4
Measuring Sustained Superior Performance: Volatility And ROE (VOLARE)
Based on these considerations, we propose a new measure of resilience called VOLARE, which complements existing indicators by including a long-term, risk-adjusted performance indicator. VOLARE (Volatility And ROE) applies an investment approach that considers both the long-term ROE (as a measure of profitability), which we define as the average ROE over a ten-year period, and the volatility of ROE (as a measure of risk).
Specifically:
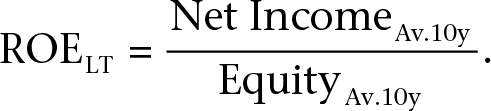

Where n is the size of the sample and x– is the arithmetic mean of the sample. Our decision to use ROE as an indicator is based on the fact that it is less dependent on market expectations or perceptions. For example, stock prices are influenced by investor expectations, while TSR is not directly controllable by companies because it is based on the perceptions of analysts and investors. However, the VOLARE logic can be replicated using other performance indicators, such as free cash flow or ROA, as a basis.
Inspired by the model developed by Markowitz (Reference Markowitz1959), and taking into account both the ROE over a ten-year period and the volatility of ROE for the same period, VOLARE serves as a proxy of resilience or, more precisely, of superior sustained performance (SSP) over time. To identify the level of resilience of each company in a given sector, the long-term ROE and volatility are represented on a graph (Figure 2.1). The highest values of the long-term ROE for a selected interval of volatility are identified and linked through logarithmic regression. The resulting curve is called VOLARE 10. The companies on this curve are the most resilient. The companies most distant from this curve are those with lower resilience (VOLARE 0).

Figure 2.1 VOLARE in the automotive industry
ISO curves are created to measure the levels of VOLARE and are plotted by lowering the curve by 4 per cent. The areas of VOLARE are delineated, allowing the long-term ROE to vary by +/-2 per cent for the same standard deviation. The construction of the VOLARE measure allows us to code the 705 companies in our database according to their level of VOLARE (from 0 to 10) in the period 2002 to 2011. The data were derived from Reuters. We considered the following industries: automotive, food and beverages, banking, pharmaceuticals, telecommunications, energy and household appliances.
VOLARE allows us to assign a score from 0 to 10 (where 0 is the lowest and 10 the highest) to companies in the different industries. In the automotive industry, for example, leaders in our sample include Audi, Porsche and Hyundai (Figure 2.1). In the pharmaceutical sector, Novo Nordisk leads the pack. Among the banks, the Bank of Nova Scotia and Banco Santander are at the top of the list. The database enables us to map the resilient companies in the period 2001–2010 and to compare them with those that were unable to react well to the external shocks.
VOLARE and the Effect on the Stock Exchange
Prior to defining what makes a company more or less resilient, we investigate whether more resilient companies have more stable share prices than more vulnerable companies. To measure the effect of an external shock on share prices, we identified the minimum price after a shock for a sample of 304 top firms active in the banking, apparel, publishing and automotive sectors, and compared that minimum price to the share price one year before and one year after that moment. The results were surprising – the share prices of companies with the highest VOLARE fell by approximately the same percentages as those of companies with low VOLARE. There are three ways to interpret this phenomenon: VOLARE is not a good measure of resilience, it takes a long time for companies to activate their potential for resilience or the financial market does not consider individual companies when share prices drop across an industry (Figure 2.2).

Figure 2.2 Effect of an external shock on share prices
However, an indication of the robustness of VOLARE as a measure of resilience is evident in the lower part of Figure 2.2. As the graph shows, the share prices of companies with high VOLARE recover more quickly than those with low VOLARE.
Initially, the market does not seem to be particularly well informed with respect to what is happening. In the face of a crisis, the market indiscriminately punishes all firms in an industry. The only indication in this case seems to be to ‘sell, sell, sell’. Over time, however, the market becomes aware of the top companies, and many investors ‘fly to quality’. The ability to recover with respect to share price is also an element of resilience, as ROE and share price need to be correlated in the long run.
How VOLARE Changes Resource Allocation
The crisis has shown that companies should create more robust business models. However, the goal of developing resilience seems to be a strategic priority only after a shock has occurred. Many companies seem to have already forgotten the effects of the 2008 crisis, and many have returned to their old ways of doing business with positive results. However, up to what point can we consider ourselves safe? The ‘new normal’ has been coined as the latest buzzword. It suggests that the equilibrium is only fictitious, and that another bubble can burst or a shock can manifest at any moment. The crisis is not over – we have simply learned to live with it. However, few companies are truly fit to face the bursting of a new bubble. After the Asian tsunami disaster in 2004, numerous earthquakes subsequently hit the Thai coast, bringing successive waves. While the first wave created tremendous damage, the latter waves worsened the situation.
VOLARE forces companies to undertake some ex ante assessments, namely before a shock occurs, and guides them towards less fallacious judgments. Is it more advantageous to invest in an investment bank that provides a higher return or in a retail bank that provides a lower yield? The investment bank might seem more attractive in the short term, but it could be riskier in the long term. VOLARE, which allows for consideration of both profitability and risk, shows that the retail bank is a more secure investment, albeit one with a lower yield. In this way, VOLARE, with its risk/return consideration, orients the allocation of resources not only at the level of individual projects but also at the level of entire business units towards investments that are positive and stable over time.
Most managers probably assess risk in some way when they allocate their free cash flow to various businesses. We doubt that they only focus on higher profit or yields. Nevertheless, a more formal approach is needed that shows how the long-term risk/return performance of businesses supports more prudent managers who appreciate a balanced business portfolio. The calculation and communication of VOLARE to demanding shareholders at least makes risk/return trade-offs more transparent.
From VOLARE to the Drivers of Resilience
Given the relative scarcity of literature on the process that leads to resilience in companies, we opted to use inductive theory based on the selection of multiple case studies (Eisenhardt and Graebner, Reference Eisenhardt and Graebner2007) to identify the drivers of resilience. The cases were taken from the VOLARE database using a non-random sampling technique. Random sampling is appropriate for deductive research and subsequent statistical analysis. In inductive research, each case is chosen to assist in the construction of a theoretical model, moving from the identification of a phenomenon to its insertion in precise conceptual categories.
To avoid the halo effect (Rosenzweig, Reference Rosenzweig2007) and not only consider cases of success, we selected companies with high (values of 10 or 9) and low (0 or 1) VOLARE. For each sector, we considered at least two companies with high VOLARE and two with low VOLARE, which gives a total 32 companies. We used several data sources:
★ interviews,
★ email and telephone follow-up calls, and
★ secondary data gathered from such sources as the media, the Internet and corporate materials.
The semi-structured interviews were carried out with different informants: CEOs, CFOs and first-line managers. Each interview lasted 45–90 minutes, and was recorded and later transcribed. Every interview focused on the shocks that had affected the sectors in which the focal company operated, a comparison of the company’s VOLARE with those of competitors and the formation of the main drivers of resilience. To avoid common-response anchoring, we employed several widely utilized techniques. First, we used different sources and informants. Second, questions were open-ended and did not, in any way, suggest possible answers. Third, the questions were based on facts and hard data regarding what respondents had done or seen collaborators/competitors do. Given our reliance on the inductive method (Eisenhardt and Graebner, Reference Eisenhardt and Graebner2007), we carried out the interviews and integrated the data they provided with follow-up data without making a priori assumptions. Therefore, the definitions and conclusions we reached were derived from the information obtained during the data-collection process. After the main drivers had been identified, we compared the emerging theoretical framework with extant literature on the research theme to refine the variable and the theoretical relations of the construct. Specific attention was paid to certain practices that are particularly illustrative in terms of strategic and managerial models.
The following chapters describe the different drivers in our model. In other words, they cover the organizational and strategic variables that can determine a company’s resilience.


