


Mental illnesses including depression and anxiety are leading causes of morbidity, disability and mortality(Reference Patel, Chisholm and Parikh1,Reference Rehm and Shield2) . Dietary patterns may influence mental health. For example, poor dietary patterns which lack essential nutrients, have a high glycaemic index and are high in added sugars may lead to adverse mental health symptoms(Reference Rahe, Unrath and Berger3–Reference Molendijk, Molero and Ortuño Sánchez-Pedreño6). In addition, in animal models, poor diets dysregulate brain insulin which affects mood, decreases neuronal levels of serotonin and dopamine and increases neuroinflammation as measured by inflammatory cytokines(Reference Kaplan, Rucklidge and Romijn7–10). Poor diets and the consumption of non-nutrient additives in animal models can also adversely affect the intestinal microbiome which, in turn, can lead to systemic and neuroinflammation(Reference Melo, Santos and Ferreira11).
The NOVA food classification is a widely used system recently adopted by the Food and Agricultural Organization of the United Nations(Reference Monteiro, Cannon and Lawrence12). NOVA considers the nature, extent and purpose of food processing in order to categorise foods and beverages into four groups: unprocessed or minimally processed foods, processed culinary ingredients, processed foods and ultra-processed foods (UPF)(Reference Monteiro, Levy and Claro13,Reference Moubarac, Parra and Cannon14) .
UPF are defined as industrial formulations of processed food substances (oils, fats, sugars, starch, protein isolates) that contain little or no whole food and typically include flavourings, colourings, emulsifiers and other cosmetic additives(Reference Monteiro, Cannon and Levy15). UPF are convenient, low cost, quick to prepare or ready-to-eat preparations of food that result from extensive ‘physical, biological, and chemical processes’ that create food products that are deficient in original and natural food(Reference Monteiro, Cannon and Moubarac16). The most commonly consumed UPF include many sugar-sweetened beverages, reconstituted meat products, packaged snacks, chips, breakfast cereals, cookies, cake, chips, and breads and numerous other packaged foods. The ultra-processing of food depletes its nutritional value and also increases the number of calories, as UPF tend to be high in added sugar, saturated fat and salt, while low in protein, fibre, vitamins, minerals and phytochemicals(Reference Martínez Steele, Popkin and Swinburn17,Reference Martínez Steele and Monteiro18) . Over 70 % of packaged foods in the USA are classified as UPF and represent approximately 60 % of all consumed calories(Reference Martínez Steele, Baraldi and Louzada19,Reference Baldridge, Huffman and Taylor20) .
While there is some evidence regarding UPF consumption and depression(Reference Adjibade, Julia and Allès21–Reference Zheng, Sun and Yu23), data are sparse regarding other adverse mental health symptoms including anxiety and mentally unhealthy days. In this Research Article, we explored a nationally representative sample of the US population, whether individuals who consume high amounts of UPF report significantly more adverse mental health symptoms including depression, anxiety and mentally unhealthy days.
Methods
Data source and participants
The National Health and Nutrition Examination Survey (NHANES) is a series of cross-sectional evaluations of a representative sample of the non-institutionalised population of the USA. NHANES is comprised of four major components, including questions regarding demographics and health, health examination, laboratory testing and a 24-h dietary recall. Further details about NHANES have been described elsewhere(Reference Curtin, Mohadjer and Dohrmann24,Reference Johnson, Dohrmann and Burt25) . Using a cross-sectional design, we combined three cycles from NHANES between 2007 and 2012. We included individuals with dietary data and information on mild depression, mentally unhealthy days, anxious days and covariates. We excluded individuals who self-reported the current or past use of cocaine, methamphetamine or heroin because of a lack validation studies using the 9-question Patient Health Questionnaire (PHQ) evaluation to detect mild depression and other mental health symptoms in individuals who use recreational drugs (n 2129). The final sample consisted of 10 359 US adults aged 18 years and older.
Exposure of ultra-processed food
We applied the NOVA classification to all of the recorded United States Department of Agriculture’s Food and Nutrient Database for Dietary Studies (USDA FNDDS) 8-digit Food Codes to the NHANES data. The details of the procedures to classify FNDDS Food Codes according to the NOVA system have been previously described(26). USDA’s FNDDS 2007–2012 were used to code dietary intake data and calculate Food Code energy intakes(Reference Montville, Ahuja and Martin27). For homemade recipes, we calculated the underlying ingredient (SR Code) energy values using variables from both FNDDS 2007–2012 and USDA National Nutrient Database for Standard Reference, Legacy Release(26). Using the average of two NHANES 24-h dietary recalls when available (and 1 d otherwise), we quantified each individual’s consumption of UPF in kilo-calories and calculated the percentage energy intake per day, in kilo-calories consumed as UPF. The proportion of respondents with one and two 24-h dietary recall was 10·6 and 89·4 %, respectively. Subjects were categorised according to their UPF consumption into five evenly divided categories. These categories allowed for a sufficiently large reference group (0–19 %) that could act as a proxy to a non-exposed group. The sample sizes for each group based upon % UPF consumption were: 0–19 %, n 305; 20–39 %, n 1860; 40–59 %, n 4023; 60–79 %, n 3286; and ≥80 %, n 885.
Outcome: adverse mental health symptoms
We measured three mental health symptoms: (1) mild depression; (2) number of mental unhealthy days and (3) number of anxious days. Symptoms of depression were ascertained from the PHQ-9. The PHQ-9 is a validated and reliable measure for depression. Respondents with a PHQ-9 score of five points or greater were categorised as having symptoms of mild depression(Reference Kroenke, Spitzer and Williams28). The number of mentally unhealthy days was obtained from the response to the question: ‘During the past 30 d, how many days was your mental health not good?’ (range: 1–30). This question is a validated measure of mental health and is highly correlated with mental health symptoms(Reference Thompson, Zack and Krahn29). The number of anxious days was obtained from the response to the question: ‘During the past 30 days, how many days did you feel worried, tense, or anxious?’ (range: 1–30). This question is also a validated measure of chronic anxiety(Reference Strine, Kroenke and Dhingra30).
Covariates
The following available socio-demographic covariates were included in the analysis: (1) gender (man/woman); (2) age (18–29/30–39/40–49/50–59/60–69 years old); (3) race/ethnicity (Mexican/Other Hispanic/non-Hispanic White/non-Hispanic Black/Other Race) and (4) poverty status calculated as a ratio of the monthly family income specific to family size (less than or equal to poverty level/greater than poverty level). The health-related covariates included smoking (never/former/current), exercise (no physical activity: reported no moderate or vigorous activity; less than recommend physical activity: <150 min of moderate or < 75 min of vigorous activity/week and recommended physical activity: ≥150 min of moderate or > 75 min of vigorous activity/week) as well as BMI categorised as underweight (<18·5 kg/m2), healthy weight (18·5–24·9 kg/m2), overweight (25–29·9 kg/m2) and obese (30 kg/m2 and above)(31,32) .
Data analysis
Descriptive statistics were generated for each adverse mental health symptom, mild depression, number of mentally unhealthy days and number of anxious days, as well as available covariates using frequency/percentages or medians/interquartile range, where appropriate. For mild depression, we used logistic regression to model the probability of a PHQ-9 score of five or greater which signifies at least mild depression. We then modelled the outcomes of ‘number of mentally unhealthy days’ and ‘number of anxious days’ using zero-inflated Poisson regression(Reference Liu, Tian and Tang33). The zero-inflated Poisson regression model has two components, count and logit. The count component model generates risk ratios (RR) of reporting more mentally unhealthy or anxious days over the prior 30 d. The logit component model predicts the probability of a zero count of the outcome and reports Odds Ratio (OR). UPF and the covariates were tested independently in unadjusted models and covariates with P-values ≤ 0·1 in their respective unadjusted model were included in the final adjusted model. We considered statistical significance to be based on a two-sided P value of less than 0·05. All statistical analyses were performed using SAS software (v9.4; SAS Institute, Inc.) and R (R Foundation for Statistical Computing). NHANES sampling and survey weights were used in the analysis.
Results
Descriptive statistics
Among the 10 359 respondents, the median age was 42·2 years, 66·2 % were non-Hispanic Whites, 52·9 % were women and 84·6 % had a family poverty ratio greater than the national level. A total of 68·3 % were overweight (32·3 %) or obese (36 %), 61·0 % had never smoked and 45·6 % reported no physical activity. The median UPF consumption as defined by energy intake percentage was 57·1 % with an interquartile range from 44·9 to 68·6 %. Mild depression was reported in 21·3 % of all respondents. The median number of mentally unhealthy and anxious days were 0 (interquartile range: 0·0–3·3) and 1·1 (interquartile range: 0·0–6·0), respectively (Table 1). Distribution of these characteristics by UPF consumption category is presented in Table 1.
Table 1 Baseline characteristics of 10 359 adults aged 18+ years in US NHANES 2007 through 2012

PHQ-9, Patient Health Questionnaire; IQR, interquartile range.
The missing data on outcomes were as follows: depression (n 6; 0·06 %), mentally unhealthy days (n 16; 0·15 %) and anxious days (n 12; 0·11 %). Since less than 10 % of the data were missing for the main outcome, our analyses were conducted without further weight adjustment or imputation to account for missing data(34).
Association between ultra-processed food consumption and adverse mental health outcomes
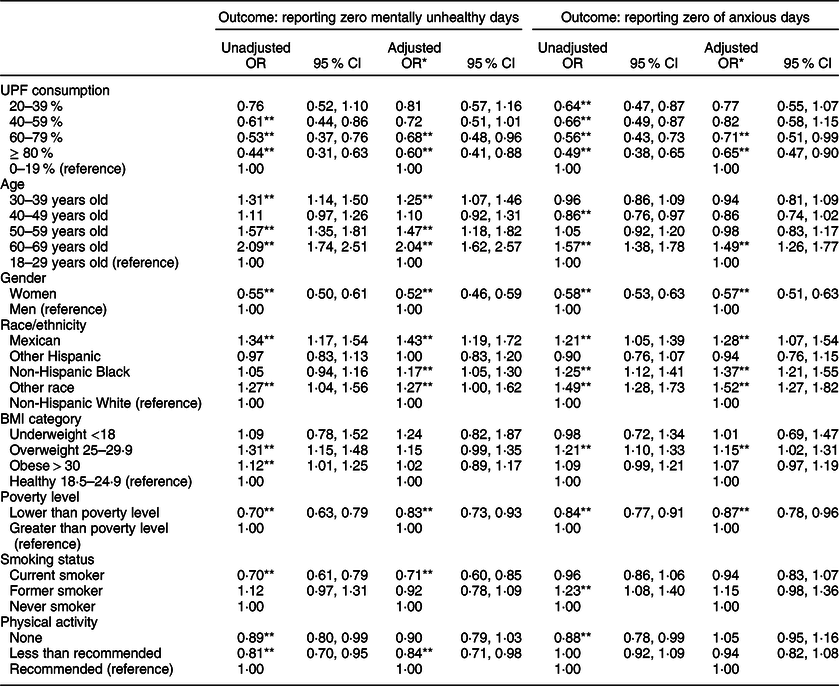
All models were adjusted for by age, gender, race/ethnicity, BMI, poverty level, smoking status and physical activity. Respondents with the highest v. lowest level of UPF consumption had a significantly higher probability of mild depression (OR: 1·81; 95 % CI 1·09, 3·02) (Fig. 1, Table 2) and were significantly more likely to report a higher number of mentally unhealthy days (RR: 1·22; 95 % CI 1·18, 1·25) and anxious days (RR: 1·19; 95 % CI 1·16, 1·23) (Fig. 1, Table 3). For each increasing level of UPF consumption, the RR for each of these outcome measures also significantly increased (Tables 2 and 3).

Fig. 1 Adjusted percentage likelihood (increase or decrease) of mild depression (OR), number of mentally unhealthy days (RR) and number of anxious days (RR) by category of ultra-processed food consumption with <20 % as the referent level
Table 2 Unadjusted and adjusted analyses regarding ultra-processed food exposure, relevant covariates and the outcome of mild depression

* Adjusted for age, gender, race/ethnicity, BMI category, poverty level, smoking status and physical activity.
** Indicates statistical significance (< 0·05).
Table 3 Unadjusted and adjusted risk ratios regarding ultra-processed food exposure, relevant covariates and the outcomes of the number of mentally unhealthy and anxious days self-reported over the prior 30 d

* Adjusted for age, gender, race/ethnicity, BMI category, poverty level, smoking status and physical activity.
** Indicates statistical significance (< 0·05).
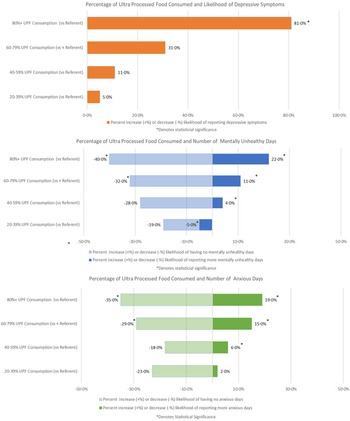
In addition, after adjusting for covariates, respondents with the highest v. lowest level of UPF consumption were significantly less likely to report zero mentally unhealthy (OR: 0·60; 95 % CI 0·41, 0·88) and zero anxious days (OR: 0·65; 95 % CI 0·47, 0·90) (Table 4).
Table 4 Unadjusted and adjusted OR regarding the likelihood of self-reporting zero mentally unhealthy and anxious days over the prior 30 d as well as relevant covariates, according to the level of ultra-processed food consumption
* Adjusted for age, gender, race/ethnicity, BMI category, poverty level, smoking status and physical activity.
** Indicates statistical significance (< 0·05).
Discussion
In this nationally representative sample of American adults, UPF constituted 57 % of total energetic intake. Individuals who consumed the most UPF as compared with those who consumed the least amount had statistically significant increases in the adverse mental health symptoms of mild depression, ‘mentally unhealthy days’ and ‘anxious days’. They also had significantly lower rates of reporting zero ‘mentally unhealthy days’ and zero ‘anxious days’.
Our data are supported by existing evidence from basic research and other descriptive and observational studies. For example, basic research provides support for the hypothesis that food additives in UPF including emulsifiers and artificial sweeteners can lead to pathophysiological changes that have been associated with mental health symptoms including impaired glucose tolerance, increases in inflammatory mediators, oxidative stress, neuroinflammation, pathogenic changes to neuronal mitochondrial function, as well as alterations in both tryptophan metabolism, and the HPA axis, and changes in the local expression of neurotrophic growth factors(Reference Boulangé, Neves and Chilloux35). Several investigations, including two large prospective cohort studies in Europe, suggest that individuals whose diets lack essential nutrients, have a high glycaemic index, and are high in added sugars also have significantly increased risks of depression and anxiety. They also found that those who consume diets, high in fish, vegetables, olive oil, beans, nuts, PUFA and low in saturated fats, such as the Mediterranean diet, have significantly lower risks of depression(Reference Lai, Hiles and Bisquera4–Reference Molendijk, Molero and Ortuño Sánchez-Pedreño6,Reference Gómez-Pinilla9,Reference Adjibade, Julia and Allès21,Reference Gómez-Donoso, Sánchez-Villegas and Martínez-González22,Reference Oddy, Robinson and Ambrosini36–Reference Jacka, O’Neil and Opie43) .
Several meta-analyses of observational studies are compatible with the current findings. In one meta-analysis of twenty observational studies, individuals who consumed diets that included a higher intake of fruit, vegetables, fish and whole grains had lower risks of depression(Reference Lai, Hiles and Bisquera4). In another, individuals who adhered to the Mediterranean diet had significantly lower rates of depression. In a third meta-analysis, individuals who consumed a diet lower in PUFA and n-3 fatty acids reported significantly more mild depression or social anxiety(Reference Lin, Huang and Su44). Finally, in one randomised trial, which provides the most reliable evidence for small to moderate effects, those assigned to a 3-month healthy dietary intervention reported significant decreases in moderate-to-severe depression(Reference Jacka, O’Neil and Opie43).
Our data also suggest that those who consume high levels of UPF consumption also experience significantly more ‘mentally unhealthy’ and ‘anxious’ days and their corresponding decrease in ‘zero mentally unhealthy days’ and ‘zero anxious days’. In another study of elderly adults, those who consumed a poor diet quality as measured by the HEI also had significantly more mentally unhealthy days(Reference Xu, Cohen and Lofgren45). To the best of our knowledge, there are no data regarding the higher consumption of UPF and the mental health outcomes of ‘zero anxious days’ and ‘zero mentally unhealthy days’.
This original research has several unique strengths. With respect to exposure, the use of the NOVA to classify dietary data allowed determining the level of food processing according to objective and standardised criteria. With respect to outcomes, we utilised three validated measures of adverse mental health symptoms. In addition, the NHANES database is a large and representative sample of the US population. This suggests that the findings are generalisable to the entire USA as well as other Western countries with similar UPF intakes.
This study also has several limitations. In addition to the descriptive study design, other limitations include the self-report of both exposure and outcomes which could result in misclassification of one or both of these measures. Dietary data obtained by 24-h recalls may suffer from recall or social desirability bias; however, the data acquisition method employed by NHANES has been shown to produce accurate intake estimates suitable for assessing population averages(Reference Boulangé, Neves and Chilloux35,Reference Moshfegh, Rhodes and Baer46–Reference Rumpler, Kramer and Rhodes48) . An additional limitation is that NHANES does not consistently collect all of the information needed to assess food processing (i.e. place of meals, product brands)(Reference Slining, Yoon and Davis49). Nevertheless, such misclassification is more likely to be non-differential underestimating the true effect. In addition, while we attempted to control for the potential confounding effects of the available variables, residual confounding is possible especially because lifestyle risk factors tend to cluster(Reference Schuit, van Loon and Tijhuis50). We also calculated the proportion of UPF in the diet by using ‘energy ratio’ rather than ‘weight ratio’ which does not properly capture ‘energy devoid’ UPF (e.g. artificially sweetened beverages) and non-nutritional factors related to food processing such as alteration of the food matrix, neo-formed contaminants or food additives. Our study findings are also limited in generalisability to milder grades of depression. Despite these limitations, we believe the most plausible interpretation of these data are to add to the growing body of evidence that individuals who consume higher amounts of UPF have significantly more adverse mental health symptoms.
In summary, these data indicate that individuals with higher intakes of UPF report significantly more mild depression, as well as more mentally unhealthy and anxious days per month, and less zero mentally unhealthy or anxious days per month. When considering these data in the context of the totality of evidence, it can be hypothesised that a diet high in UPF provides an unfavourable combination of biologically active food additives with low essential nutrient content which together have an adverse effect on mental health symptoms. While further research is needed, especially randomised clinical trials, these data add important and relevant information to a growing body of evidence concerning the adverse effects of UPF consumption on mental health symptoms. Since UPF represent the majority of calories consumed by the US population, these data may also have significant clinical and public health implications.
Acknowledgements
Financial support: This research was funded in part by the Fondation Bertarelli. Authorship: E.H. was responsible for the conception, original draft and methodology. A.R. was responsible for formal analysis and original draft. E.M.S. was responsible for formal analysis and reviewing/editing draft. D.W. was responsible for formal analysis, methodology and reviewing/editing draft. G.A. and D.L. were responsible for reviewing/editing draft. C.H. provided supervision and was responsible for reviewing/editing draft. Ethics of human subject participation: Publicly available datasets available from NHANES (NCHS Research Ethics Review Board Approval Protocol #2005–2006, #2011–2017) do not involve human subjects and therefore are exempt from local IRB review.
Conflict of interest:
Dr. Hecht, Ms. Rabil, Dr. Martinez-Steele, Ms, Ware, Dr. Abrams and Dr. Landy report no disclosures. Professor Hennekens reports that he serves as an independent scientist in an advisory role to investigators and sponsors as Chair or Member of Data Monitoring Committees for Amgen, British Heart Foundation, Cadila, Canadian Institutes of Health Research, DalCor and Regeneron; to the Collaborative Institutional Training Initiative (CITI), legal counsel for Pfizer, the United States Food and Drug Administration and UpToDate; receives royalties for authorship or editorship of 3 textbooks and as co-inventor on patents for inflammatory markers and CVD that are held by Brigham and Women’s Hospital; has an investment management relationship with the West-Bacon Group within SunTrust Investment Services, which has discretionary investment authority; does not own any common or preferred stock in any pharmaceutical or medical device company.


 Open access