


Introduction
Ti–Nb-based alloys are very promising candidates for biomedical applications, since they can show excellent corrosion resistance with low elastic modulus close to that of human bone and good ductility, allowing the production of precise and versatile geometries of medical devices (Bönisch et al., Reference Bönisch, Calin, Waitz, Panigrahi, Zehetbauer, Gebert, Skrotzki and Eckert2013; Panigrahi et al., Reference Panigrahi, Bönisch, Waitz, Schafler, Calin, Eckert, Skrotzki and Zehetbauer2015). However, Ti–Nb-based alloys are expected to have lower strength than conventional biomaterials (Geetha et al., Reference Geetha, Singh, Asokamani and Gogia2009). It is well known that mechanical properties can be significantly improved by the application of severe plastic deformation (SPD) as a result of an increased density of crystal lattice defects and strong grain refinement down to ultrafine or even nanometer scale (Valiev et al., Reference Valiev, Estrin, Horita, Langdon, Zehetbauer and Zhu2006). In this context, SPD methods, including equal channel angular pressing and high-pressure torsion (HPT), have been successfully applied to strengthen ternary and quaternary β-type Ti–Nb-based alloys (Matsumoto et al., Reference Matsumoto, Watanabe and Hanada2005; Lee et al., Reference Lee, Heo and Lee2013). Another issue is that SPD can, under certain conditions, cause phase transformations (Straumal et al., Reference Straumal, Korneva and Zięba2014). Phase transformations, driven by SPD, are especially effective in materials with allotropic modifications. Titanium possesses three allotropic variations: the low-temperature α-Ti with a hexagonal close-packed crystal structure (space group P63/mmc), the high-temperature β-Ti with a body-centerd cubic structure (space group Im-3m), and the high-pressure ω-Ti with a hexagonal structure (space group P6/mmm) (Murray, Reference Murray1981). It was found that, in Ti-based alloys, the high-pressure ω-phase forms more easily from the β-phase during SPD and also from the α-phase at a hydrostatic pressure between 2 and 12 GPa, depending on the experimental technique, pressure environment, and alloying additions (Ivanisenko et al., Reference Ivanisenko, Kilmametov, Rösner and Valiev2008). The α → ω and β → ω phase transformations induced by SPD are typical martensitic transformations (diffusionless). The shear stress and alloying of Ti with β-producing elements (such as Co, Ni, Fe, Nb, or Mo) facilitate the formation of the ω-phase. Recently, much attention has been paid to the formation of the high-pressure ω-phase from the α-phase of commercial purity titanium (Shirooyeh et al., Reference Shirooyeh, Xu and Langdon2014; Zhilyaev et al., Reference Zhilyaev, Sergeev, Popov and Orlov2014) or from the β-phase or α′ martensite of Ti–Fe-based alloys during HPT (Kilmametov et al., Reference Kilmametov, Ivanisenko, Straumal, Mazilkin, Gornakova, Kriegel, Fabrichnaya, Rafaja and Hahn2017; Kriegel et al., Reference Kriegel, Kilmametov, Klemm, Schimpf, Straumal, Gornakova, Ivanisenko, Fabrichnaya, Hahn and Rafaja2018). However, in the case of the Ti–Nb-based alloys, detailed knowledge about the fundamentals of the α → ω phase transformation under the influence of SPD and thermal stability of the ω-phase is still lacking. Therefore, the main goal of this work is to study the effect of the addition of an alloying component (Nb) on the mechanisms of the α → ω and β → ω phase transformations caused by the HPT in Ti–Nb-based alloys with 5, 10, and 20 wt% of Nb, as well as the study of the ω-phase thermal stability.
Material and Methods
Pure titanium (99.98%) and niobium (99.99%) were used for the preparation of the Ti–Nb-based alloys with 5, 10, and 20 wt% of Nb. The alloys were melted in an induction furnace in a pure argon atmosphere. The obtained cylindrical ingots of the alloy, each with a diameter of 10 mm, were cut by spark erosion into disks with a thickness of 0.7 mm. The samples of the examined alloys were sealed in quartz ampoules and annealed at 700, 670, and 520°C for 168 h for the alloys with 5, 10, and 20 wt% of Nb respectively, in order to obtain the (α + β)-phase state with a different amount of the β-phase. The samples were annealed for a very long time in order to reach the equilibrium niobium content in the α-solid solution. After annealing, the samples, together with their ampoules, were quenched in water. The annealed samples were subjected to HPT at room temperature under the pressure of 7 GPa for five full rotations with a deformation rate of 1 rpm in a Bridgman anvil-type unit using a custom-built computer-controlled device manufactured by W. Klement GmbH, Lang, Austria. XRD studies were carried out using a Siemens D-500 X-ray diffractometer (Malvern Panalytical, Malvern WR14 1XZ UK) with Cu Kα radiation. Transmission electron microscopy (TEM) investigations were carried out using a TECNAI G2 FEG super TWIN (200 kV) (FEI, Hillsborough, OR, USA) with an energy dispersive X-ray spectrometer (EDS) manufactured by EDAX (AMETEK, Inc., Berwyn, PA, USA). The thin foils for TEM observation were prepared by a twin-jet polishing technique using a D2 electrolyte manufactured by the Struers company (Cleveland, OH, USA). The focused ion beam (FIB) technique was applied by means of FEI Quanta 3D microscope (30 kV) (FEI, Hillsborough, OR, USA) for the preparation of thin foils of deformed material in order to obtain the interface between the second phase and the α-matrix. Spot diffraction was analyzed with the TIA software for the Tecnai microscope. First, the Dhkl distances of the selected reflections and the angles between them were measured. Phase identification was made with CARINEV3 software. Prior inspection of the initial material was also carried out using an FEI E-SEM XL30 scanning electron microscope (SEM) (FEI, Hillsborough, OR, USA) equipped with EDAX Genesis EDS spectrometer (FEI, Hillsborough, OR, USA). The SEM images were taken using backscattered electron signal (BSE mode) in order to obtain the composition contrast between different phases. All samples for microstructural studies were cut out at a distance of half the radius of the deformed samples. The in situ XRD studies were carried out using a Panalytical Empyrean diffractometer (Malvern Panalytical, Malvern WR14 1XZ UK) (Cu Kα radiation) equipped with an Anton Paar HTK 1200 high-temperature chamber (Malvern Panalytical, Malvern WR14 1XZ UK). The bulk samples were placed on an Al2O3 sample holder and introduced into the chamber, which was subsequently evacuated, then flushed and filled with high-purity Ar gas. Samples were heated at a rate of 5°C/min., and diffraction patterns were collected in the 40–940°C temperature range with a step size of 20°C. The 2θ range was chosen between 30 and 80° with a step size of 0.033°. The acquisition time per single pattern was 25 min preceded by 10 min of temperature stabilization. The collected data were refined using Rietveld-type FullProf software (Wojdyr, Reference Wojdyr2010).
Results and Discussion
The microstructure observations of the Ti–5 wt%Nb, Ti–10 wt%Nb, and Ti–20 wt%Nb alloys after annealing by SEM (Figs. 1a–1c) showed the presence of β-phase lamellas, uniformly distributed in the α-matrix. The lamellas of the β-phase are enriched in niobium and have a bright contrast in comparison to the dark α-matrix on the micrographs made in BSE mode. The study of the selected area electron diffraction patterns (SAED) obtained by TEM also allowed the identification of the second phase precipitates as the β-phase surrounded by the α-matrix (Figs. 1d–1f). The measurement of the chemical composition showed that the niobium content reaches 4.2, 6.5, and 10.0 wt% in the α-matrix and 14.7, 29.2, and 48.0 wt% in the β-phase for the Ti–5 wt%Nb, Ti–10 wt%Nb, and Ti–20 wt%Nb alloys, respectively. In other words, the increase of niobium content in the alloys leads to increased niobium content in the α- and β-phases.

Fig. 1. SEM (a–c) and TEM (d–f) images of microstructure of the Ti–5 wt%Nb (a,d), Ti–10 wt%Nb (b), and Ti–20 wt%Nb (c) alloys after annealing at 700°C (a), 670°C (b), and 520°C (c). Bright-field image (d) with SAED patterns (e,f) indicated the β- and α-phases.
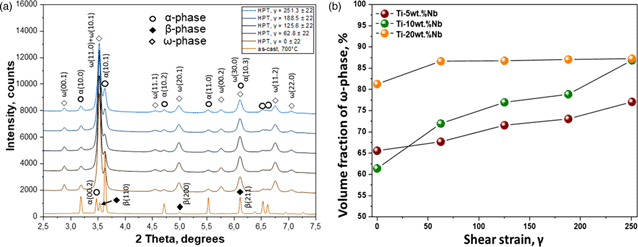
It seems that the more niobium in the alloys, the larger the volume fraction of the β-phase and the finer the grain size of the microstructure. The refinement of the microstructure can also be associated with a decrease in the annealing temperature. The volume fraction of the β-phase was calculated based on XRD analysis and reaches about 12, 28, and 42% for the Ti–5 wt%Nb, Ti–10 wt%Nb, and Ti–20 wt%Nb alloys, respectively. XRD curves (Fig. 2) of the samples in the initial state confirmed the presence of α- and β-phases. After HPT, all peaks in XRD patterns were broadened and their intensity decreased, which is usual for SPD strong grain refinement. Moreover, the ω-Ti phase appeared in all samples, a certain amount of α-Ti phase remained, and peaks from the β-phase completely disappeared. It was found earlier that even a 0.1 rotation of HPT deformation of the Ti–4 wt%Fe alloy in the β-state led to the formation of 90% of the ω-phase (Kilmametov et al., Reference Kilmametov, Ivanisenko, Mazilkin, Straumal, Gornakova, Fabrichnaya, Kriegel, Rafaja and Hahn2018). This confirms that the high-pressure ω-phase more easily forms from the β-phase during HPT. The crystallographic mechanism of the α → ω phase transformation implies shear deformation along the (00.1) α planes (Trinkle et al., Reference Trinkle, Hennig, Srinivasan, Hatch, Jones, Stokes, Albers and Wilkins2003). The XRD patterns show that the strong (00.2) peak of the α-phase completely disappeared, and the high intensity (11.0 + 10.1) doublet of the ω-phase appeared after HPT in the sample pre-annealed at 400 °C. This confirms the α → ω phase transformation mechanism observed earlier in pure Ti under HPT conditions (Ivanisenko et al., Reference Ivanisenko, Kilmametov, Rösner and Valiev2008)

Fig. 2. XRD patterns of the Ti–5 wt%Nb (curve 1), Ti–10 wt%Nb (curve 2), and Ti–20 wt%Nb (curve 3) alloys before (lower curves) and after (upper curves) HPT deformation. XRD patterns of the Ti–10 wt%Nb alloy in enlarged scale in the right corner of the figure.
After the HPT process, the microstructure refinement and deformation of the bright phase are clearly visible on the micrographs obtained by SEM (Figs. 3a–3c). If the β-phase completely disappears, then to which phase do the bright precipitates belong? The TEM study of the microstructure revealed the answer to this question. Figures 3d–3f present the microstructure of the thin foil (obtained by a twin-jet polishing technique) of the Ti–5 wt%Nb alloy after HPT as an example. It can be seen that there is a strong grain refinement of microstructure down to nanometer sizes. The SAED pattern showed many reflections from the ω-phase and some reflections from the α-phase. The TEM observations of microstructure showed the presence of small grains of rounded shape and large grains of irregular shape with distinctive streaky contrast. The morphology of the large grains is similar to the ω-phase (Shurygina et al., Reference Shurygina, Cheretaeva, Glezer, D’yakonov, Chshetinin, Sundeev, Tomchuk and Muradimova2018), while the small grains probably belong to the α-phase. The microstructure of the HPT-deformed Ti–10 wt%Nb and Ti–20 wt%Nb alloys is similar to that described above.

Fig. 3. SEM (a–c) and TEM (d–f) images of microstructure of the Ti–5wt.%Nb (a, d–f), Ti–10wt.%Nb (b) and Ti–20wt.%Nb (c) alloys after HPT. Bright field (d), dark field (e) images, as well as the SAED pattern (f) with the solutions in the table.
The preparation of thin foils using the FIB method was performed in order to find out what happened with the β-phase, which remained visible in the micrographs after the HPT process. The foil was cut at the interface between some bright contrast particles and the deformed matrix. It should be noted that the observed microstructure, in this case, corresponds to the cross-section of the deformed sample, which is different from the microstructure in Figures 3d–3f taken from the surface of the sample. The bright-field (BF) image (Fig. 4a) showed the presence of large elongated precipitates with morphology similar to the β-phase in the initial state (Fig. 1d). The SAED pattern (Fig. 4b) taken from one of them, marked as circle 1 on the BF image, showed that it belongs to the ω-phase grain. Moreover, the high-angle annular dark-field observation of microstructure (Fig. 4d) and the mapping of Nb and Ti elements (Figs. 4e, 4f) showed that these large grains are enriched in Nb up to 14.8 wt%. It should be noted that this chemical composition is close to the β-phase in the initial state (14.7 wt%Nb). Since no reflections of the β-phase were observed after HPT and the β → ω transformation is a martensitic process proceeding without changing the composition, it can be concluded that the β-phase completely transformed into the ω-phase. The SAED pattern (Fig. 4c) taken from a deformed matrix, marked as circle 2 on the BF, showed the presence of nanocrystalline grains of the α- and ω-phases. Therefore, two kinds of the ω-phases are observed. The first comes from the β-phase enriched in niobium, and the second one from the almost Nb-pure α-phase.

Fig. 4. TEM images of microstructure of the HPT-deformed Ti–5wt.% Nb alloy. Bright field (BF) image (a), SAED patterns (b, c) taken from a places marked on the BF as the circle 1 and circle 2, respectively. HAADF-STEM image (d) and mapping of Nb (e), Ti (f) elements.
The amount of the ω-phase transformed from the β-phase corresponds to the amount of the β-phase in the initial state, that is, 12, 28, and 42% for the alloys with 5, 10, and 20 wt%Nb, respectively. However, according to XRD analysis, the total amount of the ω-phase for the examined samples reached about 71, 76, and 86%, respectively (Table 1). This means that the remaining amount of the ω-phase appeared from the partial transformation of the α-phase. Moreover, it turned out that the smaller the amount of Nb in the α-phase, the greater the amount of the α-phase is transformed into the ω-phase (Table 1). Similar results were also obtained in a Ti–4 wt%Co alloy subjected to HPT under the same conditions (Korneva et al., Reference Korneva, Straumal, Kilmametov, Gondek, Wierzbicka-Miernik, Lityńska-Dobrzyńska, Chulist, Cios and Zięba2021). HPT of the Ti–4 wt%Co alloy resulted in a strong grain refinement of the microstructure and a partial α → ω phase transformation. It was found that HPT-induced α → ω phase transformation depends on the cobalt content in the initial α-phase and the morphology of the microstructure. The lower cobalt content and smaller grain size of the α-phase leads to a higher amount of ω-phase induced by HPT (Korneva et al., Reference Korneva, Straumal, Kilmametov, Gondek, Wierzbicka-Miernik, Lityńska-Dobrzyńska, Chulist, Cios and Zięba2021).
Table 1. The Volume Fraction of Some Phases Before and After HPT as well as the Nb Content in the α-Phase in the Initial State.

Synchrotron X-ray analysis was performed along the radius of the HPT-deformed samples. Figure 5a shows the XRD pattern measured for the Ti–5 wt%Nb alloys as an example. Based on the XRD pattern of the examined alloys, the amount of the ω-phase was calculated as a function of the shear stress (Fig. 5b). The higher the shear stress is, the more the amount of the deformation-induced ω-phase.

Fig. 5. Synchrotron XRD curves of the Ti–5 wt%Nb alloy, measured along the radius of the sample (a). The volume fraction of the ω-phase in all deformed alloys as a function of the shear strain (b).
The thermal stability of the metastable ω-phase was studied by in situ high-temperature XRD measurements. An in situ XRD map of the Ti–5 wt%Nb alloy before and after HPT is presented in Figure 6 as an example. The heating of the initial state above 600°C resulted in a slight shift of all observed peaks toward the lower diffraction angles. This shift can be associated with the increase of the lattice parameters due to thermal expansion. After deformation, the (11.0) + (10.1) peak of the ω-phase as well as the (10.0) and (10.1) peaks of the α-phase are clearly visible in the 33–42° range of 2θ angles on the standard XRD curves in Figure 2. However, only the (11.0) + (10.1) peak of the ω-phase can be distinguished in the in situ XRD map before heating. The absence of the α-phase peaks in this range of 2θ angles in the in situ XRD map is related to the different duration of XRD measurements. For the in situ method, there is not enough time to register many X-ray counts compared to the standard method. Analysis of the XRD in situ map showed that the heating of the deformed samples up to 350°C resulted in the complete disappearance of the ω-phase and the appearance of the (10.0), (00.2), and (10.1) α-phase peaks. Therefore, the decomposition of the ω-phase into the α-phase is observed. Since the ω-phase is enriched in niobium as an alloying element (by analogy with the ω-phase enriched in iron in Ti–Fe alloys (Ivanisenko et al., Reference Ivanisenko, Kilmametov, Rösner and Valiev2008; Kilmametov et al., Reference Kilmametov, Ivanisenko, Straumal, Mazilkin, Gornakova, Kriegel, Fabrichnaya, Rafaja and Hahn2017), it is assumed that the α-phase arising after the decomposition of the ω-phase is also enriched in niobium. Next, heating to the highest temperatures resulted in a slight shift of α-phase peaks toward the lower diffraction angles. This shift also can be associated with the increase of the lattice parameters due to thermal expansion and the appearance of the new α-phase with lower cobalt content. The same situation was observed in the case of the Ti–4 wt%Co alloy subjected to the HPT process (Korneva et al., Reference Korneva, Straumal, Kilmametov, Gondek, Wierzbicka-Miernik, Lityńska-Dobrzyńska, Chulist, Cios and Zięba2021).

Fig. 6. The XRD in situ heating map of the Ti–5 wt%Nb alloy before (a) and after (b) HPT. At the given 2θ angle interval, the ω-phase is presented by (11.0 + 10.1) doublet of peaks.
It should be noted that the HPT-induced ω-phase volume fraction in pure Ti (under the same conditions) reached only approximately 40% (Kilmametov et al., Reference Kilmametov, Ivanisenko, Mazilkin, Straumal, Gornakova, Fabrichnaya, Kriegel, Rafaja and Hahn2018), and the process of reverse ω → α transformation is finished at 180°C for heating at a rate of 10°C/min. Therefore, alloying with niobium results in a twofold increase of ω-phase volume fraction and an increase in its thermal stability up to 350°C. The thermal stability of the cobalt-doped ω-phase, observed in HPT-deformed Ti–4 wt%Co alloy, is reached at around 450°C (Korneva et al., Reference Korneva, Straumal, Kilmametov, Gondek, Wierzbicka-Miernik, Lityńska-Dobrzyńska, Chulist, Cios and Zięba2021). In the case of the Ti–Fe-based alloys (Kriegel et al., Reference Kriegel, Kilmametov, Klemm, Schimpf, Straumal, Gornakova, Ivanisenko, Fabrichnaya, Hahn and Rafaja2018), the HPT-induced ω-phase completely decomposes slightly above 600°C. In other words, the thermal stability of the Nb-doped ω-phase is higher than that of the pure Ti and lower than that of the Co- or Fe-doped ones.
Conclusions
HPT of the Ti–Nb alloys resulted in a strong grain refinement of the microstructure, a partial transformation of the α-phase into the ω-phase, and a complete β → ω phase transformation.
Two kinds of the ω-phase with different chemical compositions were observed after HPT. The first one was formed from the β-phase, enriched in Nb, and the second one from the α-phase. The α → ω phase transformation depends on the Nb content in the initial α-Ti phase. The lower the level of Nb in the α-phase, the greater the amount of the α-phase is transformed into the ω-phase.
The temperature range of the reverse ω → α transformation is about 350 °С. The thermal stability of the ω-phase is higher than that of pure Ti (180°C) and lower than in Ti–Co (450°С) and Ti–Fe-based alloys (600°C) subjected to HPT.
Financial support
This work is supported by the National Science Centre of Poland (Grant No. OPUS 2017/27/B/ST8/01092), Deutsche Forschungsgemeinschaft (Project Nos RA 1050/20-1, IV 98/5-1, HA 1344/32-1, and FA 999/1-1), Russian Foundation for Basic Research (Grant No. 19-58-06002), as well as state task of ISSP RAS. SEM and TEM investigations were performed within the Accredited Testing Laboratories possessing the certificate No. AB 120 issued by the Polish Centre of Accreditation according to European standard PN-ISO/IEC 17025:2005 and the EA-2/15.


 Open access