In recent years, meal pictures taken by smartphones have been investigated as a novel tool for dietary assessment( Reference Gemming, Utter and Ni Mhurchu 1 – Reference Illner, Freisling and Boeing 7 ). This method reduces the burden of collecting dietary data and the food pictures are helpful in refreshing people’s memory about their food intake. However, picture taking must be volitionally initiated for each plate of food before and after consumption, which is inconvenient and impractical. This approach may also disrupt normal eating habits because of the picture-taking process. Thereby it is difficult to use this method to conduct long-term dietary assessment.
Since a wearable camera can record the scenes in front of the wearer continuously and automatically, its potential application in objective dietary studies has been explored( Reference Pettitt, Liu and Kwasnicki 8 – Reference Vieira Resende Silva and Cui 25 ). For example, the SenseCam (originally developed by Microsoft( 26 )), the eButton (developed by our team)( Reference Sun, Fernstrom and Jia 13 – Reference Sun, Burke and Baranowski 15 ), an ear-worn micro-camera( Reference Pettitt, Liu and Kwasnicki 8 , Reference Liu, Johns and Atallah 21 ) and a camera-enabled cell phone worn around the neck( Reference Arab and Winter 19 ) have been used to conduct dietary assessment and/or compared with 24 h recalls( Reference Pettitt, Liu and Kwasnicki 8 – Reference Arab, Estrin and Kim 12 , Reference Beltran, Dadhaboy and Lin 16 , Reference Beltran, Dadabhoy and Chen 17 , Reference Jia, Chen and Yue 23 ). These studies demonstrated that, with the help of a wearable camera, not only can food intake be evaluated, but also the eating environment/behaviour can be studied. However, researchers, research subjects or ‘Mechanical Turk Workers’ (i.e. people who perform tasks that computers are currently unable to do)( Reference Chen, Jia and Yue 27 ) must manually observe and identify eating episodes from large image data sets, which is both tedious and time-consuming( Reference Beltran, Dadhaboy and Lin 16 – Reference Thomaz, Parnami and Essa 18 ). Furthermore, privacy becomes a concern when the images of the wearer are observed by another person( Reference Doherty, Hodges and King 28 – Reference Kelly, Marshall and Badland 32 ). The current strategy is to ask the wearer to review all the images before sending to researchers and delete some images if necessary, or to control the on/off switch of the camera. This approach reduces privacy concerns but is very time-consuming or inconvenient.
To minimize the burden of image review and reduce privacy concerns caused by manual processing, additional sensor(s) can be attached to the body of the research subject which initiate picture taking when an eating activity is detected by the sensor(s). Piezoelectric sensors and microphones have been used to measure chewing and swallowing during eating( Reference Kalantarian and Sarrafzadeh 33 – Reference Päßler and Fischer 39 ). Motion sensors, magnetic proximity sensors and infrared sensors have also been tested to detect hand movements during eating( Reference Ramos Garcia 40 – Reference Bai, Jia and Mao 45 ). A number of other sensors, such as an audio sensor within an ear and a motion sensor on the head/wrist, have also been used to detect eating( Reference Liu, Johns and Atallah 21 , Reference Vu, Lin and Alshurafa 24 , Reference Mirtchouk, Merck and Kleinberg 46 , Reference Rahman, Czerwinski and Gilad-Bachrach 47 ). However, these sensors are often intrusive, uncomfortable and/or cosmetically unpleasant for long-term wear. A better solution would be if foods could be detected directly from the acquired images without human involvement and without adding extra sensors. With food detected and portion size estimated for each food, information about the nutrient and energy content of the food can be retrieved from a dietary database( Reference Jia, Chen and Yue 23 , Reference Vu, Lin and Alshurafa 24 , Reference Chang, Ye and Albert 48 ).
Artificial intelligence (AI) is a field aiming to develop tools/algorithms that allow machines to function intelligently (e.g. learn, reason, solve problems). A recent technological breakthrough in AI has enabled image/scene understanding to become increasingly accurate( Reference LeCun, Bengio and Hinton 49 – Reference Johnson, Krishna and Stark 54 ). In the field of computer vision, automatic human or object detection and recognition from images has become an active research topic, for example differentiating food/non-food images or recognizing different types of food from high-quality images( Reference Singla, Yuan and Ebrahimi 55 – Reference Mezgec and Korousic Seljak 66 ). However, automatic detection of foods from the data acquired by a wearable camera is challenging because the quality of wearable camera-acquired images is usually low due to practical factors such as improper illumination, low image resolution, motion-caused blur, etc. In addition, the scenes in these images are not intentionally selected. As a result, the images may obtain numerous irrelevant objects but incomplete or even missing objects of interest. In the present study, we conducted an initial investigation on automatic food detection from real-world images acquired by a wearable device, called eButton, during daily life. eButton, which looks like a round chest badge, contains a miniature camera and a motion sensor( Reference Sun, Burke and Mao 14 , Reference Sun, Burke and Baranowski 15 ). It automatically takes images of the view in front of the wearer at a pre-set rate after being turned on. Due to the limit on the size and weight of the eButton, the performance of the camera is not as good as that of a smartphone (see Figs 1 and 5 for examples of eButton images). In the current paper we introduce our food detection algorithm and validate its performance using eButton data sets.
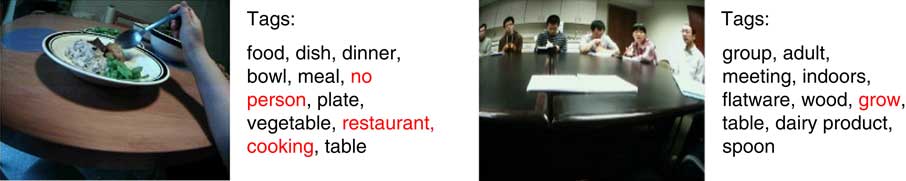
Fig. 1 (colour online) Examples of the tags generated by Clarifai for eButton-acquired images. Some descriptions are correct, although not all of them. Red tags appear to be questionable ones
Methods
The deep-learning technology for AI has attracted great attention as it constantly breaks records in a variety of common benchmark tests( Reference LeCun, Bengio and Hinton 49 , Reference Krizhevsky, Sutskever and Hinton 51 , Reference Hinton 67 – Reference LeCun and Bengio 69 ). Deep learning is a subfield of machine learning allowing multi-layered computational models (e.g. neural network with multiple hidden layers) to learn representations from tremendous amounts of raw data. Deep leaning has been successfully applied to a wide range of fields, such as automatic machine translation, computer vision and speech recognition. As one type of state-of-the-art deep-learning structure, the convolutional neural network (CNN) has shown exceptional performance in object detection/classification from images( Reference LeCun, Bengio and Hinton 49 – Reference Johnson, Karpathy and Li 53 ). CNN is a feed-forward artificial neural network, typically consisting of a series of stacked convolutional layers and one or more fully connected layers. The output of this network (i.e. a layer of neurons) determines the class of the object in the input image. Training with annotated images is required for this network to learn how to differentiate objects. For example, a deep CNN trained using 1·2 million images is able to recognize 1000 different objects or ‘concepts’ with high accuracy( Reference Krizhevsky, Sutskever and Hinton 51 ). However, large amounts of annotated images are required for training the deep network, and the training process is both system-demanding (e.g. special hardware required) and time-consuming. Thus, it is usually not very practical for nutrition scientists to implement this technology without substantial computational support.
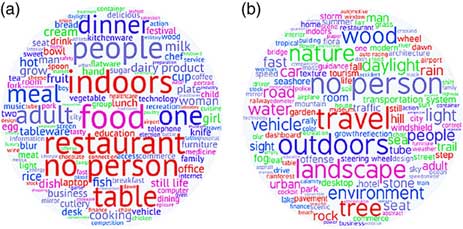
Because large image data sets for object detection/recognition (i.e. ImageNet, Pascal VOC)( Reference Chang, Ye and Albert 48 , 70 , 71 ) are already available, several CNN structures have been successfully trained and applied to these tasks. We thus utilized the object recognition results from an existing CNN for food detection, instead of building our own CNN. Figure 1 shows two examples in which objects in eButton-acquired real-world images are recognized and output is obtained in keywords (or tags)( 72 ). Although not all descriptions are correct, the potential of machine intelligence for detecting food images is clear. Combining the CNN-produced tags of a class of images, we can build histograms of these tags demonstrating the occurrence frequency of each tag. Two histograms computed separately for fifty images containing at least one food (we call them ‘food images’) and fifty images containing no food (we call them ‘non-food images’) are each visualized in Fig. 2 as a ‘word cloud’ using a web-provided software tool( 73 ). The frequently presented tags in these two classes are quite different. This observation inspired us to use tags to construct a classifier to detect whether an image contains edible objects or an eating activity, based on the contents of the image. Individual food-related tags (e.g. tag ‘food’ or ‘dish’) can be used as an indicator to detect food images, but it is not very reliable especially when the food covers only a small part of the image. For our study, we selected Clarifai CNN( 72 ) which provides an easy-to-use Application Program Interface to produce the tag output from the input image. In addition, this particular CNN has been one of the top performers in the computer vision community. For example, it won first place in the image classification task at the ImageNet Large Scale Visual Recognition competition in 2013. According to the company’s report( 72 ), Clarifai can identify more than 11 000 general concepts including objects, ideas and emotions.
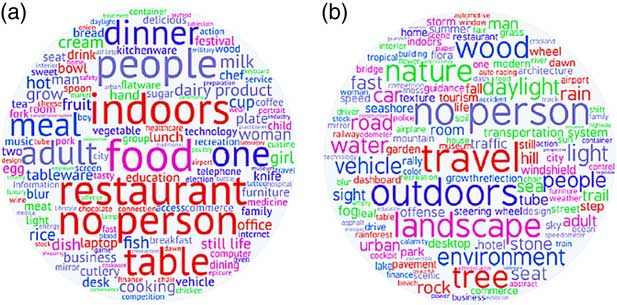
Fig. 2 (colour online) Word clouds of a set of tag histograms from fifty food images (a) and fifty non-food images (b)
The actual computational algorithm is mathematical in nature and is described in the online supplementary material for interested readers. Here we only highlight the concepts involved. Since the CNN-generated tags are English words, we first construct a dictionary (which is essentially a subset of the ordinary English dictionary) containing possible words that the Clarifai CNN could produce. After the tag words of a specific image are obtained from this CNN, we look up the dictionary and record the locations of these tag words (analogous to ‘page numbers’) in the dictionary. Note that each location (analogous to each dictionary ‘page’) is pre-marked with ‘food-related’ or ‘not food-related’ (imagine that each dictionary page is coloured either red (denoting ‘food-related’) or yellow (denoting ‘not food-related’)), determined mathematically according to a probability calculation in a ‘training’ process. Now, the classification of the input image into the ‘food’ or ‘non-food’ class becomes simply counting the numbers of the red and yellow pages. Specifically, if the number of red pages is larger than a pre-set threshold, the image is determined to be ‘food-related’; otherwise it is ‘not food-related’.
We finally comment here that, in the past, determining whether an image contains at least one edible product was an extremely difficult task when only traditional image processing techniques were available. Now, with the availability of advanced AI technology and the algorithm described above, this task becomes straightforward.
Experimental results
We validated the performance of our AI-based image classification method using three data sets, including one public data set and two eButton data sets. The public data set is called Food-5K, a recently published benchmark for image classification tasks( Reference Singla, Yuan and Ebrahimi 55 ). We used this data set to compare the performance of our algorithm with that from an existing study( Reference Singla, Yuan and Ebrahimi 55 ). In this data set, the images were acquired by smartphones and handheld cameras rather than wearable devices, and most food images contain only a food with or without a container without other objects. Therefore, the classification of this data set was relatively easy. The other two data sets were constructed using our eButton images. eButton data set 1 contains 3900 egocentric images acquired from thirty wearers (research participants) who wore an eButton for different durations in their real living environment, divided equally as training and testing sets. Snack, food preparation and shopping images were also included as food images in this data set. eButton data set 2 was collected from only one female participant who wore an eButton for one entire week during daytime, containing 29 515 images. The performance of our AI system was evaluated using measures of sensitivity (recall), specificity, precision and overall accuracy, defined as follows:
 $$\eqalignno{ {\rm Sensitivity}\,{\equals}\, & {{{\rm TP}} \over {{\rm TP}{\plus}{\rm FN}}}, \cr {\rm Specificity}\,{\equals}\, & {{{\rm TN}} \over {{\rm TN}{\plus}{\rm FP}}}, \cr {\rm Precision}\,{\equals}\, & {{{\rm TP}} \over {{\rm TP}{\plus}{\rm FP}}} $$
and
 $${\rm Accuracy}\,{\equals}\,{{{\rm TP}{\plus}{\rm TN}} \over {{\rm TP}{\plus}{\rm TN}{\plus}{\rm FN}{\plus}{\rm FP}}},$$
where TP (true positive), TN (true negative), FP (false positive) and FN (false negative) are clarified in Table 1. Sensitivity and specificity are also known as the ‘true positive rate’ and the ‘true negative rate’, respectively. Precision is also called ‘positive predictive value’, which is the ratio of true positives to combined true and false positives.
Table 1 Definitions of true positive (TP), true negative (TN), false positive (FP) and false negative (FN)
Food-5K data set
Food-5K contains 2500 food images and 2500 non-food images (see examples in Fig. 3). These images were selected from publicly available data sets, such as Food-101( Reference Bossard, Guillaumin and Van Gool 74 ), UEC-FOOD-100( Reference Matsuda, Hoashi and Yanai 75 ), Caltech256( Reference Griffin, Holub and Perona 76 ), the Images of Groups of People( Reference Gallagher and Chen 77 ) and Emotion6( Reference Peng, Chen and Sadovnik 78 ). A human observer checked all images to guarantee that they were distinguishable. To make the classification task more challenging, the food item in the image may take up only a small part of the image (see Fig. 4 for examples). Three thousand images were selected as the training set, and two sets, each containing 1000 images, were used as the validation and evaluation set, respectively. The number of food and non-food images in each data set was equal to guarantee balanced classes. In the present study, we used only the evaluation set as the testing set to evaluate our algorithm and compare with the published result( Reference Singla, Yuan and Ebrahimi 55 ).

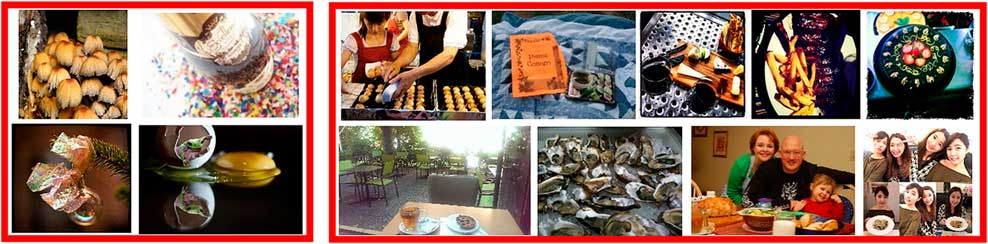
Fig. 3 (colour online) Typical images in the Food-5K data set. Left four images are labelled as food images; the right four are non-food images
Our classification results on the evaluation set are shown in Table 2 using different similarity measures (Jaccard and Dice, explained in the online supplementary material). The tag dictionary was constructed from the training data set with n 761. It can be observed from Table 2 that when threshold was set to 3 (i.e. k=3), the overall accuracy, sensitivity, specificity and precision were 98·7, 98·2, 99·2 and 99·2 %, respectively, with the Dice similarity measure. We noticed that the misclassified images were mostly difficult cases that were challenging even for a human to perform the task (examples in Fig. 4). The overall accuracy reported by another group using the non-tag-based approach was 99·2 %( Reference Singla, Yuan and Ebrahimi 55 ), which was only slightly better than our result.
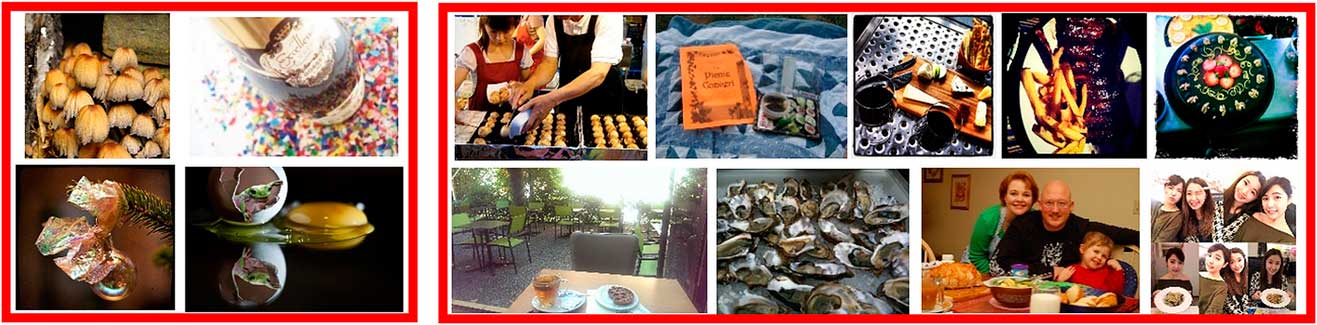
Fig. 4 (colour online) Misclassified images in the Food-5K data set. Left four were misclassified as food images; the right nine were misclassified as non-food images
Table 2 Classification results on the Food-5K data set
TP, true positive; FN, false negative; TN, true negative; FP, false positive.
* The calculations of Jaccard and Dice are explained in the online supplementary material.
eButton data set 1: food/non-food data sets
A total of 3900 real-life images were selected from the images acquired by eButton. The resolution of these images is 640 pixels×480 pixels. Half of the images, including 950 food images and 1000 non-food images, were acquired by twelve participants in two field studies conducted at the University of Pittsburgh. The other half were acquired mainly by eighteen lab members and collaborators during their daily life or travel. Since eButton recorded image sequences with the speed of one image every 2–5 s, adjacent images in the sequences were usually similar. Therefore, we down-sampled the image sequences by a factor of 10 so that the resulting images were separated by 20–50 s. Even after this down-sampling, some images were still quite similar. We deleted similar ones further manually to keep the number of images recorded from the same event to less than fifteen. The images containing likely private information, or that were too dark or too blurred, were also removed. All images were annotated to provide the ground truth (food or non-food) and some detailed information, such as ‘eating a meal’, ‘having a drink’, ‘eating a snack’, ‘food preparation’ and ‘food shopping’, which were all considered food images (see Table 3 and Fig. 5). Since, in the egocentric images, no eating behaviour of the wearer can be seen directly from the images, an image with a mug on the table or a cup in hand was considered as ‘having a drink’. Comparing Fig. 5 and Fig. 3, it can be seen that the eButton image data set was more difficult to process due to uncontrolled imaging, low-resolution, unfavourable illumination, small objects within complex background and motion artifacts.
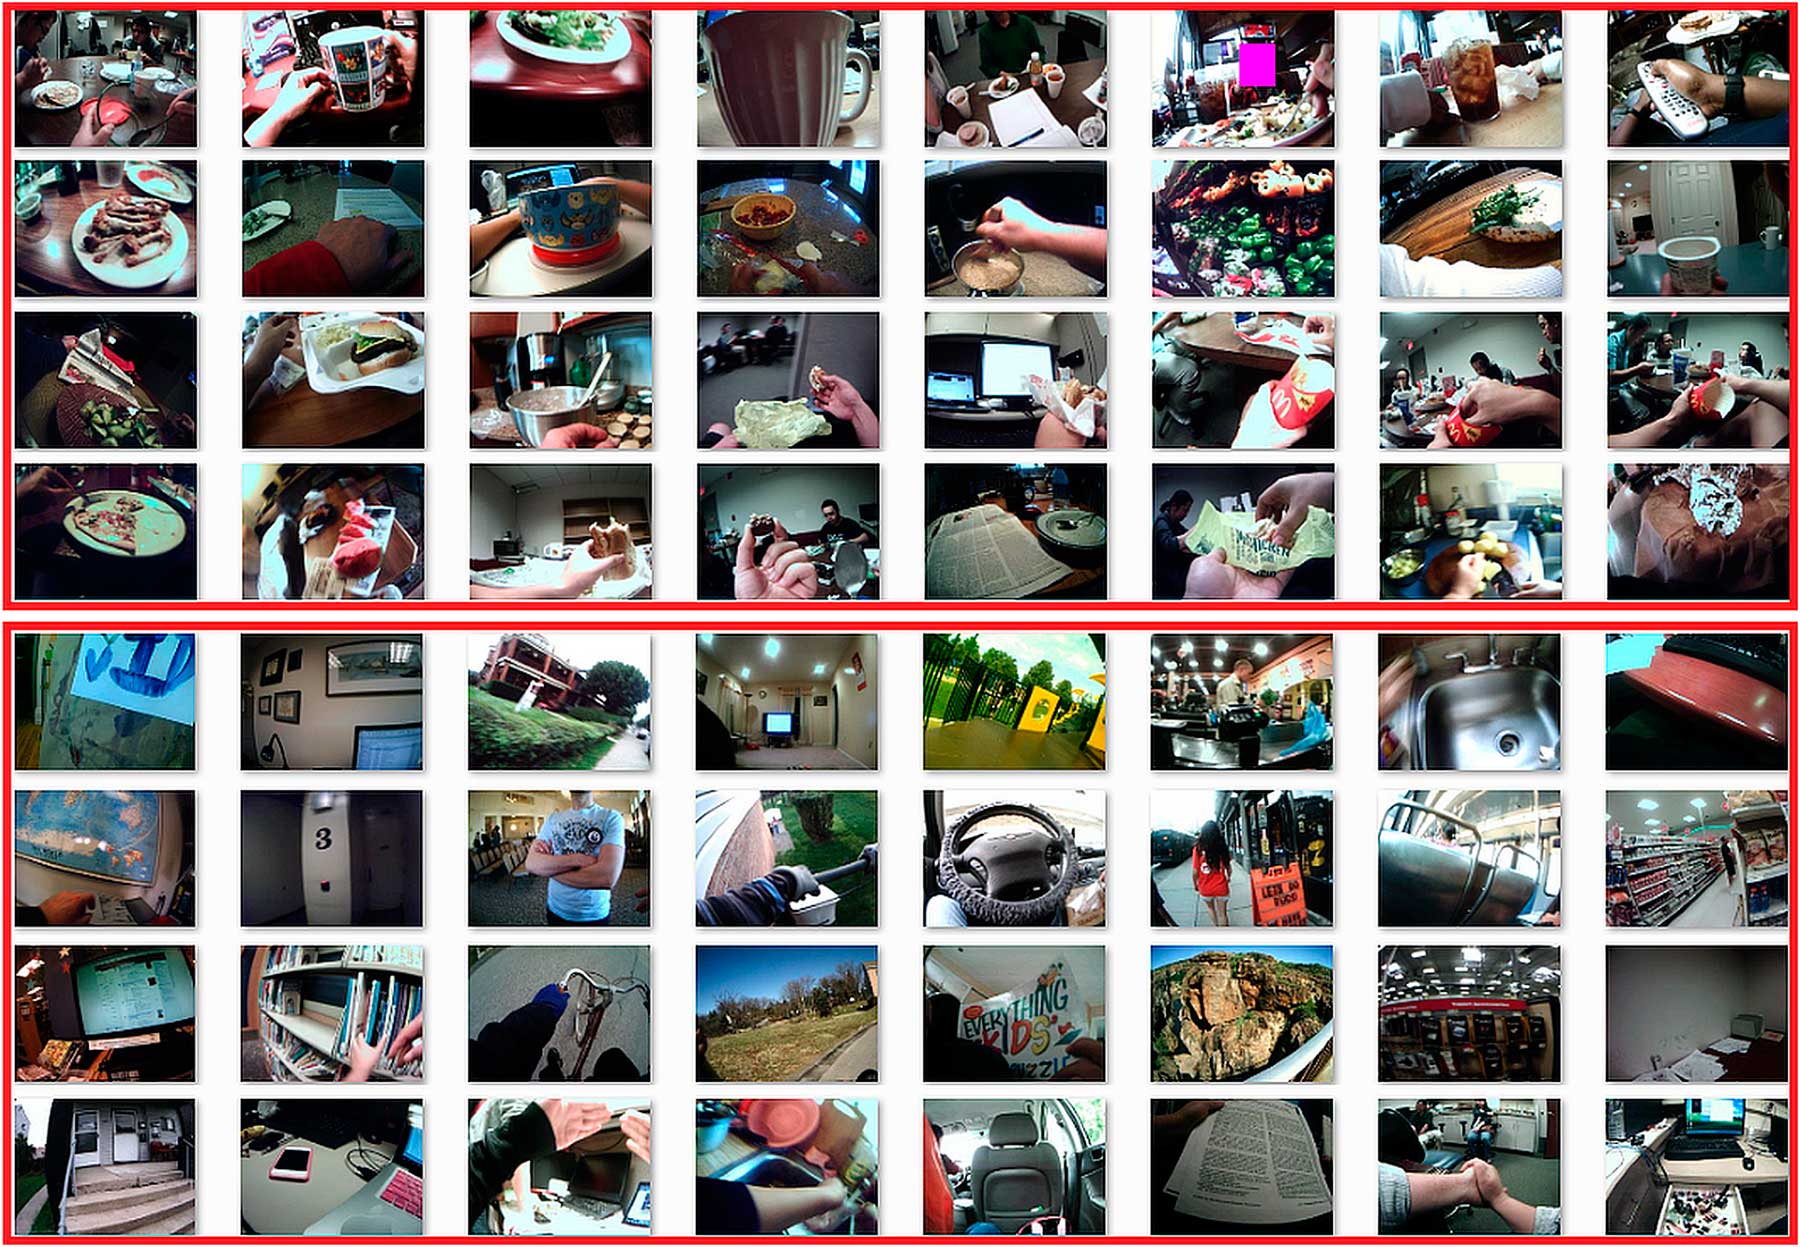
Fig. 5 (colour online) Examples in eButton data set 1. Images in the top four rows are labelled as food images, and those in the bottom four rows are non-food images. Compared with the images in Fig. 3, it can be seen that the egocentric images were more difficult to classify
Table 3 Categories and number of images in the eButton food/non-food data set
In this experiment, we first built a tag dictionary from 6000 randomly selected eButton images including different daily activities. Only a very small portion of these images contained food-related contents, so only a few food-related tags were included in this dictionary. To make the tag dictionary better fit the study, we also included 2560 food images (ten images from each food category) from a food image database( Reference Kawano and Yanai 79 ). In total, we got a dictionary with 1253 tags. Since the images in these two sets of data were acquired exclusively by different people, we conducted a cross data-set evaluation. The results are shown in Fig. 6. The Dice measure was used and ε was set to 0·05. It can be observed that threshold k is an important factor determining the classification result. When k=2, both sensitivity and specificity are high. The overall accuracy measures are 91·5 and 86·4 %, respectively, for these two cases (see Fig. 7). A more detailed analysis (in Table 4) shows that the classification accuracies in eating and food shopping category are higher than the accuracies in other categories.
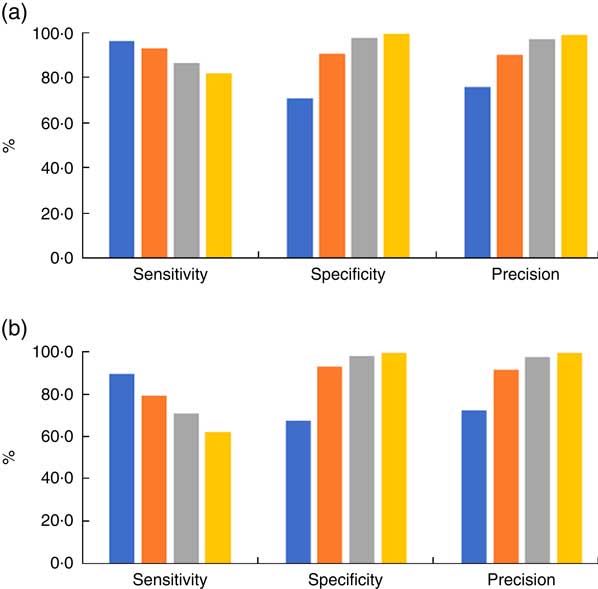
Fig. 6 (colour online) The effect of threshold k (![]() , k=1;
, k=1; ![]() , k=2;
, k=2; ![]() , k=3;
, k=3; ![]() , k=4) on the sensitivity, specificity and precision in the cross data-set evaluation of the eButton data set 1: (a) case 1 (training: session 2, testing: session 1); (b) case 2 (training: session 1, testing: session 2)
, k=4) on the sensitivity, specificity and precision in the cross data-set evaluation of the eButton data set 1: (a) case 1 (training: session 2, testing: session 1); (b) case 2 (training: session 1, testing: session 2)
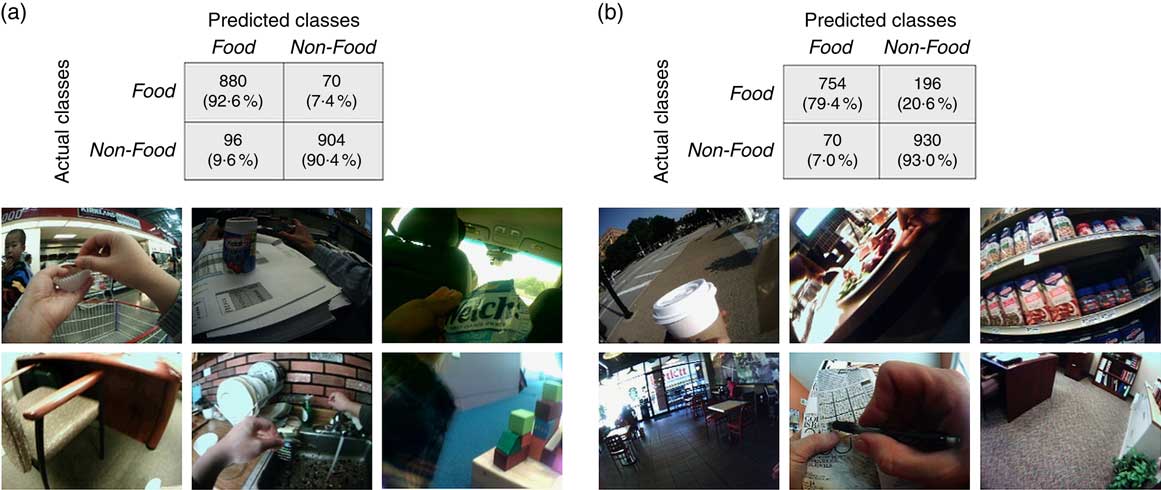
Fig. 7 (colour online) Tag-based classification results in the cross data-set evaluation of the eButton data set 1 and misclassified examples (top images were misclassified as non-food images and bottom images were misclassified as food images): (a) case 1 (training: session 2, testing: session 1); (b) case 2 (training: session 1, testing: session 2)
Table 4 Accuracy of food image detection in different categories of the eButton food/non-food data set

eButton data set 2: one-week data set
With institutional review board approval, we recorded whole-day images using eButton. A female participant wore an eButton continuously during daytime for one week. As a result, a variety of real-life activities were recorded in these images, including eating/drinking/cooking, attending parties, garden work, taking classes, gym exercise, etc. All seven image sequences (one per day) were down-sampled first (resulting in a picture-taking rate of one image every 10 s). Human faces were detected using the Picasa software and blocked before sending to an observer, who further filtered out images with possible privacy concerns and annotated images in the same way as described in the last case. After these procedures, 29 515 images were obtained, exemplified in Table 5. All these images were then processed by the AI software (Clarifai CNN) to generate twenty tags for each image. Based on these tags, the number of food-related tags for each image, defined as the evidence index, was calculated, as described in the online supplementary material. If this number was higher than the pre-set threshold k, we determined it as a food image. The tag dictionary was obtained using the same approach as described for eButton data set 1 and food vector y was trained using eButton data set 1.
Table 5 Durations of recording and numbers of images in the seven-day study
Table 5 shows that the numbers of real food images, including ‘food’ and ‘drink’ images, were much lower than the number of the ‘other’ (i.e. non-food) images. In this case, the overall precision and accuracy are not good performance measures because of the imbalance between the sample sizes. Since images classified as food images will be further studied to obtain dietary information, which is a time-consuming procedure, it is desirable to minimize the total number of positive images (being classified as food images, including true positives and false positives) while limiting the impact on both sensitivity and specificity measures. Since the evidence index represents how many tags of each image belong to food images, a higher value of threshold k results in fewer positive images.
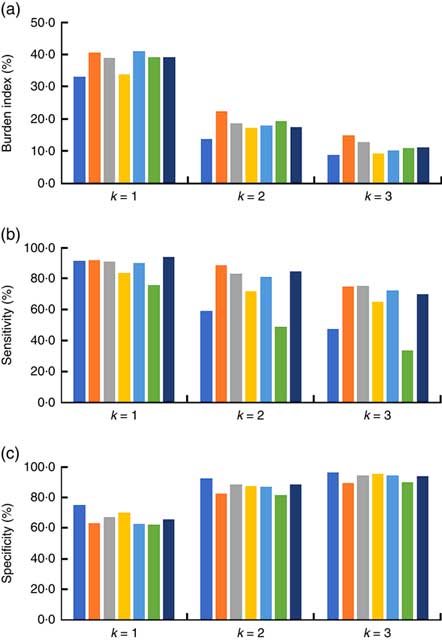
In our experiment, we defined a burden index to represent the ratio between the number of total positive images and the number of all images (see Fig. 8). When k=1, 37·8 % of the total images needed a further check, which may be too much burden for researchers although the overall sensitivity was as high as 89·5 %. Threshold k is an adjustable parameter in this algorithm. Smaller k results in higher sensitivity, but also higher burden. When k=2, the overall burden decreased to 18 % with 74·0 % sensitivity and 87·0 % specificity (shown in Fig. 8). The sensitivity of day 1 and day 6 was significantly lower than on the other days. After extracting all of the false negative images, we found on the first day that 206 out of 354 ‘drink’ images (similar to the first two images in Fig. 9) were missed due to the dark environment and the small coffee cup, while on sixth day, seventy-eight out of 154 eating images were not found probably because of the small food item and the overexposed images (similar to the last three images in Fig. 10).
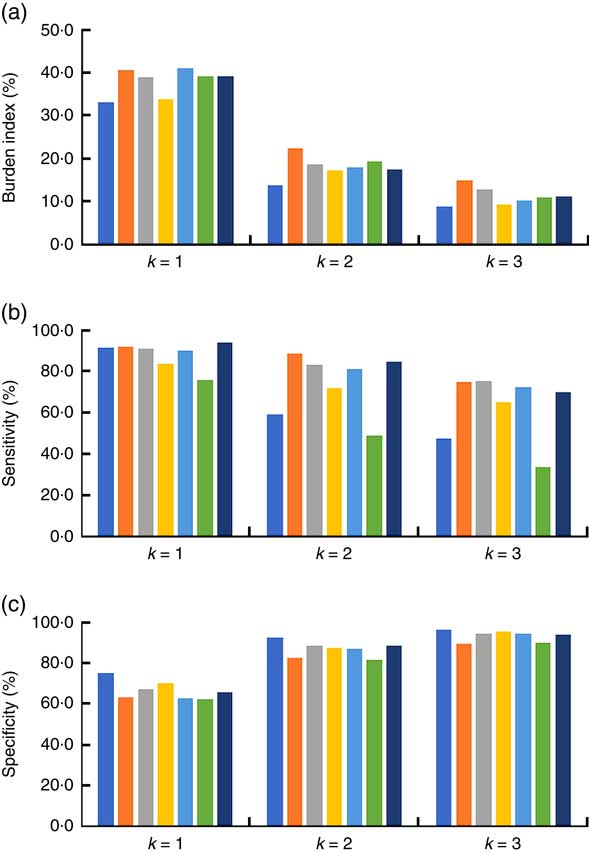
Fig. 8 (colour online) (a) Burden index, (b) sensitivity and (c) specificity in the eButton one-week data set with changing k (![]() , day 1;
, day 1; ![]() , day 2;
, day 2; ![]() , day 3;
, day 3; ![]() , day 4;
, day 4; ![]() , day 5;
, day 5; ![]() , day 6;
, day 6; ![]() , day 7)
, day 7)
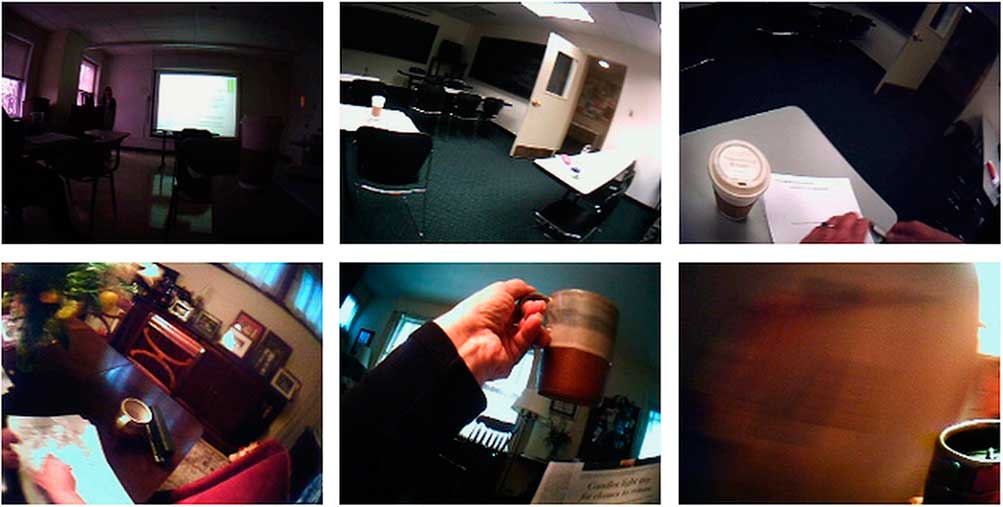
Fig. 9 (colour online) Several images in the eButton one-week data set annotated as ‘drink’ because a cup can be seen on the table or in hand
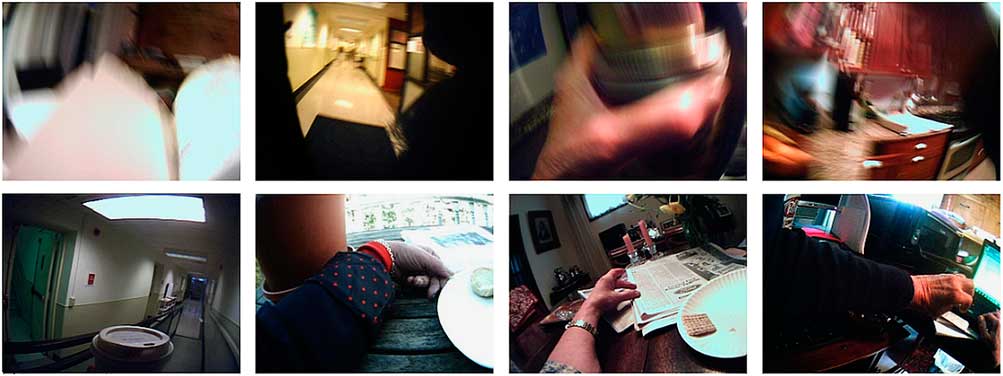
Fig. 10 (colour online) Examples of blurred images (top row) and images with a small portion of food (bottom row)
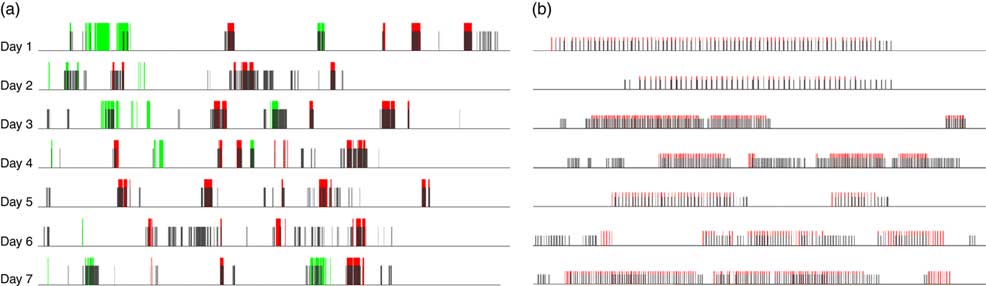
The results of the one-week data set are summarized in Fig. 11(a) where the red bars represent true ‘food’ images, the green bars represent true ‘drink’ images and grey bars represent the detected food images. The calculated evidence index for each image was averaged over a 1 min window first and then binarized by threshold k. It can be observed that most of the eating/drinking events (i.e. a cluster of red or green bars) were detected by our AI approach.
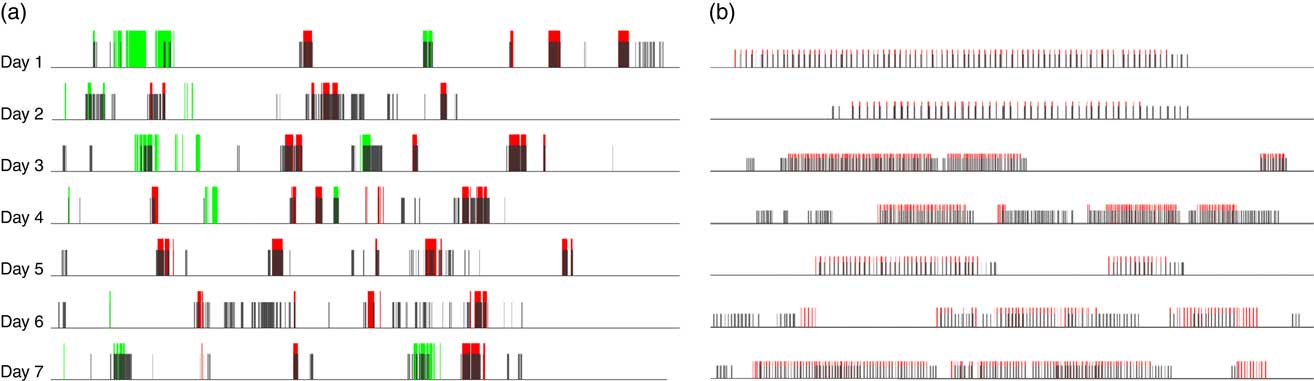
Fig. 11 (a) (colour online) (a) Results of food detection for eButton one-week data set. The red bars represent true ‘food’ images, the green bars represent true ‘drink’ images and grey bars represent the detected food images. (b) A zoomed-in picture of the last meal in each day
From Fig. 11(a), scattered false positives can be found which were caused mainly by unattended drinks in the scene of the eButton. The research participant brewed or purchased a cup of coffee for breakfast and often left it on the table or held it by hand while performing other activities, such as taking a class or reading a newspaper (Fig. 9). If we consider the ‘drink’ images as non-food images, the sensitivity can reach 85·0 %, while specificity remained at 85·8 % (Fig. 12).
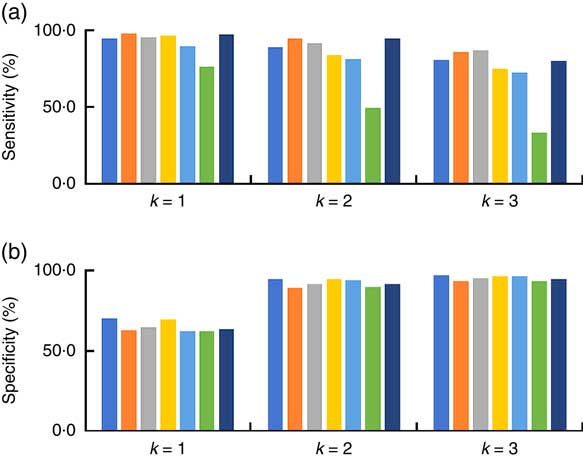
Fig. 12 (colour online) Classification results in the eButton one-week data set when only ‘food’ images were considered as food images (![]() , day 1;
, day 1; ![]() , day 2;
, day 2; ![]() , day 3;
, day 3; ![]() , day 4;
, day 4; ![]() , day 5;
, day 5; ![]() , day 6;
, day 6; ![]() , day 7)
, day 7)
Discussion
Our experimental results indicate that the AI algorithm performed well on both the Food-5K and eButton data sets. However, the performance on the Food-5K data set was better. This difference may be due to three reasons. First, blurred pictures cannot be avoided if images are recorded when the wearer of the eButton is moving. When applying a blur detection algorithm to the one-week eButton data set, we found that 5233 images (17·7 %) were blurred( Reference Pech-Pacheco, Cristóbal and Chamorro-Martinez 80 ). Several blurred images are shown in Fig. 10. If these images were removed before processing with the proposed method, the overall sensitivity increased only by about 1 %, which shows that the proposed algorithm is robust to blur. Second, in some pictures, the food covered only a very small part of the image, especially when drinking. In the one-week data set, the wearer sometimes eats/drinks while reading or doing computer work, so the food/plate is located in the corner of the images, see Figs 9 and 10 for examples. Third, compared with the Food-5K data set, more objects were included in the egocentric images due to the use of a wide-angle camera in eButton (120° field of view) and the passive image capture. It makes the detection task more challenging.
In our previous work, all of the images were observed by researchers and dietary-related images were chosen manually for nutritional analysis( Reference Beltran, Dadabhoy and Chen 17 ). This is the most time-consuming part in the whole data analysis procedure. If research burden is a significant concern, we can adjust the threshold k to compromise between research burden and sensitivity, as shown in Fig. 8. In addition, because a sequence of images can be acquired with eButton, whole eating/drinking events can be recorded. Even if some food images were not detected using our algorithm, missing a whole meal seldom happened. When we zoom in on the last meal of each day in Fig. 11(a), we can see most of the red bars are covered by the grey bars, which means these images are detected (see Fig. 11(b)). The uncovered red bars do not provide much new information since they were acquired from the same meal. We also found that some shopping or food preparation images were misclassified as food images. Checking these images will provide supplementary information in the actual dietary assessment. If, in a specific study, only food/drink episodes are of interest, we could use the motion data also acquired from eButton, which contains a three-axis accelerometer and a three-axis gyroscope, to exclude these scenarios.
Acknowledgements
Acknowledgements: The authors would like to acknowledge all participants for their significant contributions to this research study, as well as Clarifai for providing online service. Financial support: This work was supported by the National Institutes of Health (NIH) (W.J., M.S., Z.-H.M., grant number U01HL91736), (W.J., M.S., Z.-H.M., L.E.B., grant number R01CA165255), (W.J., M.S., T.B., grant number R21CA172864); the National Natural Science Foundation of China (H.Z., grant number 61571026); and the National Key Research and Development Program of China (H.Z., M.S., W.J., grant number 2016YFE0108100). The NIH and other agencies had no role in the design, analysis or writing of this article. Conflict of interest: None to declare. Authorship: W.J., Y.L. and R.Q. were responsible for image collection/annotation/analysis. G.X., H.Z., Z.-H.M. and M.S. contributed to the algorithm for data analysis. Y.L. and Y.B. designed and constructed the prototype of the eButtons used in this study. T.B., L.E.B. and J.M.M. conducted the field studies for acquiring images. W.J., T.B., L.E.B. and M.S. contributed to final drafting and editing of the manuscript. Ethics of human subject participation: This study was approved by the University of Pittsburgh Institutional Review Board.
Supplementary material
To view supplementary material for this article, please visit https://doi.org/10.1017/S1368980018000538