


CVD are leading causes of death globally(1). An estimated 17·9 million people died from CVD in 2016, representing 31 % of all global deaths(1). In Japan, CVD are the second most common cause of death after cancer, with CVD deaths accounting for 15·8 % of all deaths in 2017(2). Some of the known behavioural risk factors for CVD are physical inactivity, high salt intake, tobacco use and high alcohol consumption(3). These behavioural risk factors cause raised blood pressure (BP), blood glucose, blood lipids, and overweight and obesity(3).
Recent studies have investigated the association between CVD risk and the balance of Na and K intake, evaluated from diet or urine, not Na alone(Reference O’Donnell, Mente and Rangarajan4–Reference Willey, Gardener and Cespedes7). In an international prospective cohort study involving eighteen countries, combined intakes of moderate Na (3–5 g/d) and high K (>3·5 g/d) were associated with the lowest risk of cardiovascular events and all-cause mortality(Reference O’Donnell, Mente and Rangarajan4). Several previous prospective studies have shown that high dietary Na:K ratio increased the risk of stroke or total CVD risk, among the general population(Reference Mirmiran, Bahadoran and Nazeri5–Reference Willey, Gardener and Cespedes7). The dietary or urinary Na:K ratio was associated with higher BP levels or hypertension prevalence(Reference Du, Batis and Wang8–Reference Jackson, Cogswell and Zhao10). A recent cohort study on Chinese adults showed that a higher dietary Na:K ratio was associated with a higher risk of diabetes, defined as either fasting glucose ≥ 126 mg/dl (≥7·0 mmol/l), glycated HbA1c ≥ 6·5 % or using antidiabetic drugs, in the general population(Reference Hao, Liu and Halbert11). The INTERSALT Study reported that East Asians including Chinese, Japanese and Koreans have higher urinary Na:K ratio than Westerners(Reference Iwahori, Miura and Ueshima12).
The Japanese obtain higher salt intakes from foods such as the traditional Japanese seasonings (soya sauce and miso) than those of Western countries(Reference Powles, Fahimi and Micha13). However, we previously reported that larger portion sizes of soya sauce or miso alone might not be risk factors of elevated BP levels among Japanese adults who consume more vegetables, soya products and mushrooms(Reference Okada, Saito and Takimoto14). A high intake of K contained in vegetables, fruits and fish reduces BP and lowers the risk of stroke, as observed in a meta-analysis that included thirty-five randomised controlled trials and cohort studies(Reference Aburto, Hanson and Gutierrez15). In Japan, based on the National Health and Nutrition Survey (NHNS) data(16), decline in salt intake and systolic BP (SBP) was observed. However, few studies reported association between Na:K ratio and either CVD or CVD risk factors among the general population in Asian countries, particularly in Japan. For the primary prevention of CVD, it is important to reduce CVD risk factors such as raised BP, blood glucose or blood lipids.
Hence, we aimed to investigate a possible relationship between dietary Na:K ratio and CVD risk factors among Japanese adults using nationwide pooled data from the 2003–2017 NHNS.
Materials and methods
National Health and Nutrition Survey data
The NHNS is an annual cross-sectional survey (between October and December), which began in 1947 and was conducted by the Ministry of Health, Labour, and Welfare in Japan. Details of the survey design have been described(Reference Ikeda, Takimoto and Imai17,Reference Saito, Imai and Htun18) . Briefly, the NHNS uses a stratified cluster sampling design across forty-seven prefectures. Iwate, Miyagi and Fukushima Prefectures were excluded from the 2011 survey due to the Great East Japan earthquake, while Kumamoto Prefecture was excluded from the 2016 survey due to the Kumamoto Earthquake. Census enumeration areas were drawn from each prefecture, and residents aged ≥1 year in all households were selected from 300 selected census enumeration areas from 2003 to 2017. Exceptions were the 2004, 2012 and 2016 surveys, which were conducted in 298 areas (two areas in Niigata Prefecture were excluded due to the Mid Niigata Prefecture Earthquake), 475 areas and 462 areas, respectively, out of the eligible survey areas. The NHNS comprised three surveys: the dietary intake survey (a self-administered questionnaire including questions on the household status, meal patterns, step counts and dietary records), in addition, the lifestyle survey (a self-administered questionnaire including questions on smoking status, alcohol intake and sleep time) and physical examination (measurement of height, weight, abdominal circumference and BP; blood tests; and a medical interview). Based on official application procedures under Article 33 of the Statistics Act, we obtained approval from the Ministry of Health, Labour, and Welfare of Japan to use individual-level data from the NHNS for this study. In accordance with the Ethical Guidelines of Epidemiological Research(19), our study was exempted from the application of these guidelines as only anonymised data were used.
Dietary assessment
The dietary intake survey, which uses semi-weighed household dietary records to assess dietary intake, was conducted on a single day that was neither a Sunday nor a public holiday. The dietary intake survey was conducted in November, except in 2012 and 2016, when they were conducted between 25 October and 7 December, and 1 October and 30 November, respectively. Trained interviewers visited each household to explain the method for generating the dietary records before the survey. Dietary records were weighed by taking an inventory of all the food and beverage intake, food wastes and leftovers in the household, as well as foods eaten away from home. For shared dishes within the household, the approximate proportions of each food were assigned to individual household members for the estimation of the individual food intakes. Interviewers checked for any missing information and errors during household visits to collect the dietary records.
Nutrient intake was calculated based on the Standard Tables of Food Composition in Japan (5th edition for the 2003–2004 survey; the 5th revised and enlarged edition for the 2005–2010 survey and the 2010 edition for the 2011–2017 survey). Based on the food group tables in the NHNS(20), foods were classified into seventeen large food groups (e.g. cereals, vegetables, fish and shellfish, etc.). These were further classified into thirty-three medium groups (e.g. rice and rice products, wheat flour and wheat products, green and yellow vegetables, other vegetables, raw fish and shellfish, and seafood and processed products), then into ninety-eight small groups (e.g. rice, bread, tomatoes, carrots, horse mackerels and sardines, and salmon and trout). Details of the food groups have been previously reported(21). Dietary Na:K ratio was calculated by dividing the weight of Na consumption (mg) by the weight of K consumption (mg).
Outcome measurement and definition
Participants wore a pedometer on their waist and measured their number of steps on a single day and then recorded it in a self-administered questionnaire regarding dietary intake. Participants’ height and weight were measured by trained fieldworkers. BMI was calculated by dividing the weight (kg) by the square of height (m) (kg/m2). BP was measured twice using the Riva-Rocci mercurial sphygmomanometer and the JIS manchette (BP cuff). The mean values of the two measurements of SBP and diastolic BP (DBP) were used. Hypertension was defined as an SBP ≥ 140 mmHg and/or a DBP ≥ 90 mmHg based on the Guidelines for the Management of Hypertension by the Japanese Society of Hypertension(22). Non-fasting blood samples were collected and analysed for HbA1c concentration and serum lipid concentration. HbA1c concentration was measured using the latex agglutination nephelometry method (measuring instrument: BM9030). High HbA1c levels were defined as high HbA1c concentration ≥6·5 % determined by the National Glycohaemoglobin Standardization Program, based on the diabetes mellitus diagnostic criteria of the Japan Diabetes Society(23). Total cholesterol (TC) was measured using the cholesterol dehydrogenase method, while HDL-cholesterol was measured using the direct method (measuring instrument: BM8060). Non-HDL-cholesterol was calculated by subtracting HDL-cholesterol from TC. A low HDL-cholesterol level was defined as HDL-cholesterol <40 mg/dl (1·03 mmol/l), while high non-HDL-cholesterol levels were defined as non-HDL-cholesterol ≥170 mg/dl (4·39 mmol/l) based on the Japan Atherosclerosis Society Guidelines for Prevention of Atherosclerotic Cardiovascular Diseases(Reference Kinoshita, Yokote and Arai24). Hypercholesterolaemia was defined as TC ≥ 240 mg/dl (6·20 mmol/l)(Reference Kodama, Sasaki and Shimizu25).
Study participants
Of the 190 018 participants in the 2003–2017 survey, participants aged <20 years (n 31 905), pregnant or breast-feeding women (n 1784), those for whom BP measurements and blood tests were not performed (n 81 564) and those who did not complete the dietary intake survey (n 1669) were excluded. Furthermore, participants who were using drugs to lower BP (n 19 273), those using either insulin or oral hypoglycaemic agents (n 1724) and those using drugs to lower the cholesterol (n 3299) were also excluded (including participants who were using multiple drugs). Ultimately, data of 48 800 participants (19 386 men and 29 414 women) aged ≥20 years were included in the analysis.
Statistical analysis
The trend in dietary sodium:potassium ratio
All statistical analyses were performed for each sex. Age-adjusted mean of Na:K ratio was estimated using a regression model, according to the survey years. Age adjustment was conducted using the six age categories (20–29, 30–39, 40–49, 50–59, 60–69 and ≥70 years), which is the standard population based on the 2010 census. The trend analyses were performed by the Joinpoint Regression Program (Joinpoint Regression software, version 4.2, National Cancer Institute). Joinpoint regression analysis uses statistical criteria to determine the minimum number of linear segments needed to describe a trend and to determine the annual percentage change for each segment. The Monte Carlo Permutation method was used to test if a change in the trend was statistically significant(Reference Kim, Fay and Feuer26).
Association between dietary sodium:potassium ratio and CVD risk factors
For the regression models, because consumption of Na and K was correlated with total energy intake (Spearman rank correlation (r s) for Na and K: 0·50 and 0·57 for men and 0·49 and 0·60 for women, respectively), dietary Na:K ratio was energy-adjusted using the residual method according to sex(Reference Willett27). Participants were divided into quintiles based on their energy-adjusted Na:K ratios. The associations between energy-adjusted Na:K ratio, participant characteristics and food and nutrient intake were assessed using simple linear regression analyses for continuous variables, while a χ 2 test was used for categorical variables. Based on the food group tables in the NHNS(20), the large food group variables were used for the analysis on food intake, while those of the medium groups were used for the analysis of rice and rice products, wheat flour and wheat products, and alcohol beverages. Age and multivariate adjusted model linear regression analyses were performed to evaluate the associations between energy-adjusted Na:K ratio and BP (SBP and DBP) and blood profiles (HbA1c, serum TC, HDL-cholesterol and non-HDL-cholesterol). To determine the association between Na:K ratio and risk of hypertension, high HbA1c levels, hypercholesterolaemia, low HDL-cholesterol levels and high non-HDL-cholesterol levels, age and multivariate adjusted model logistic regression analyses were performed. The OR and 95 % CI for hypertension, high HbA1c levels, hypercholesterolaemia, low HDL-cholesterol levels and high non-HDL-cholesterol levels were evaluated using Na:K ratio in the second to fifth quintiles and were compared with those in the first quintile. To examine the linear relationship, P for trend values were obtained using Na:K ratio as continuous variables. The following variables were included in the multivariate models: age (continuous variable), BMI (<18·5, 18·5–24·9, 25·0–29·9, ≥30·0 kg/m2 or unknown), smoking status (current, former, never smoker or unknown), occupation (professional/management, office work, sales/service, manual (security, farming, forestry, fishery, transportation or labour service), housework, unemployed (unemployed or student) or unknown), number of steps (quintiles <3700; 3700–5707; 5708–7811; 7812–10 635; ≥10 636/d for men; <3608; 3608–5365; 5366–7142; 7143–9493; ≥9494/d for women, or unknown), alcohol intake amount (g/d, continuous variable), intake of protein(Reference Budhathoki, Sawada and Iwasaki28,Reference Kurihara, Okamura and Sugiyama29) and SFA(Reference Mente, Dehghan and Rangarajan30,Reference Zhuang, Cheng and Wang31) (g/d, continuous variables) and survey year. Energy-adjusted values of intake of protein and SFA were used in the residual method according to sex(Reference Willett27). All statistical analysis on the association between Na:K ratio and CVD risk factors was performed using the SAS statistical package for Windows (version 9.4, SAS Institute Inc.). Differences were considered statistically significant at P < 0·05.
Results
The trend in dietary Na:K ratio adjusted for age category according to sex is shown in Fig. 1(a) (men) and Fig. 1(b) (women). Joinpoint regression analyses identified a change in the trend for dietary Na:K ratio from 2003 to 2017, with significant decreases in annual percentage change of 0·51 and 0·73 % in men and women, respectively (P < 0·001). The proportion of decrease for Na and K intake was 17·1 and 6·4 %, respectively, for men, and 18·6 and 4·4 %, respectively, for women (mean intake of Na and K for men was 5160 mg and 2609 mg, respectively, in 2003, 4276 mg and 2443 mg in 2017, respectively; for women, mean intake of Na and K was 4361 mg and 2414 mg, respectively, in 2003, and 3552 mg and 2308 mg, respectively, in 2017).
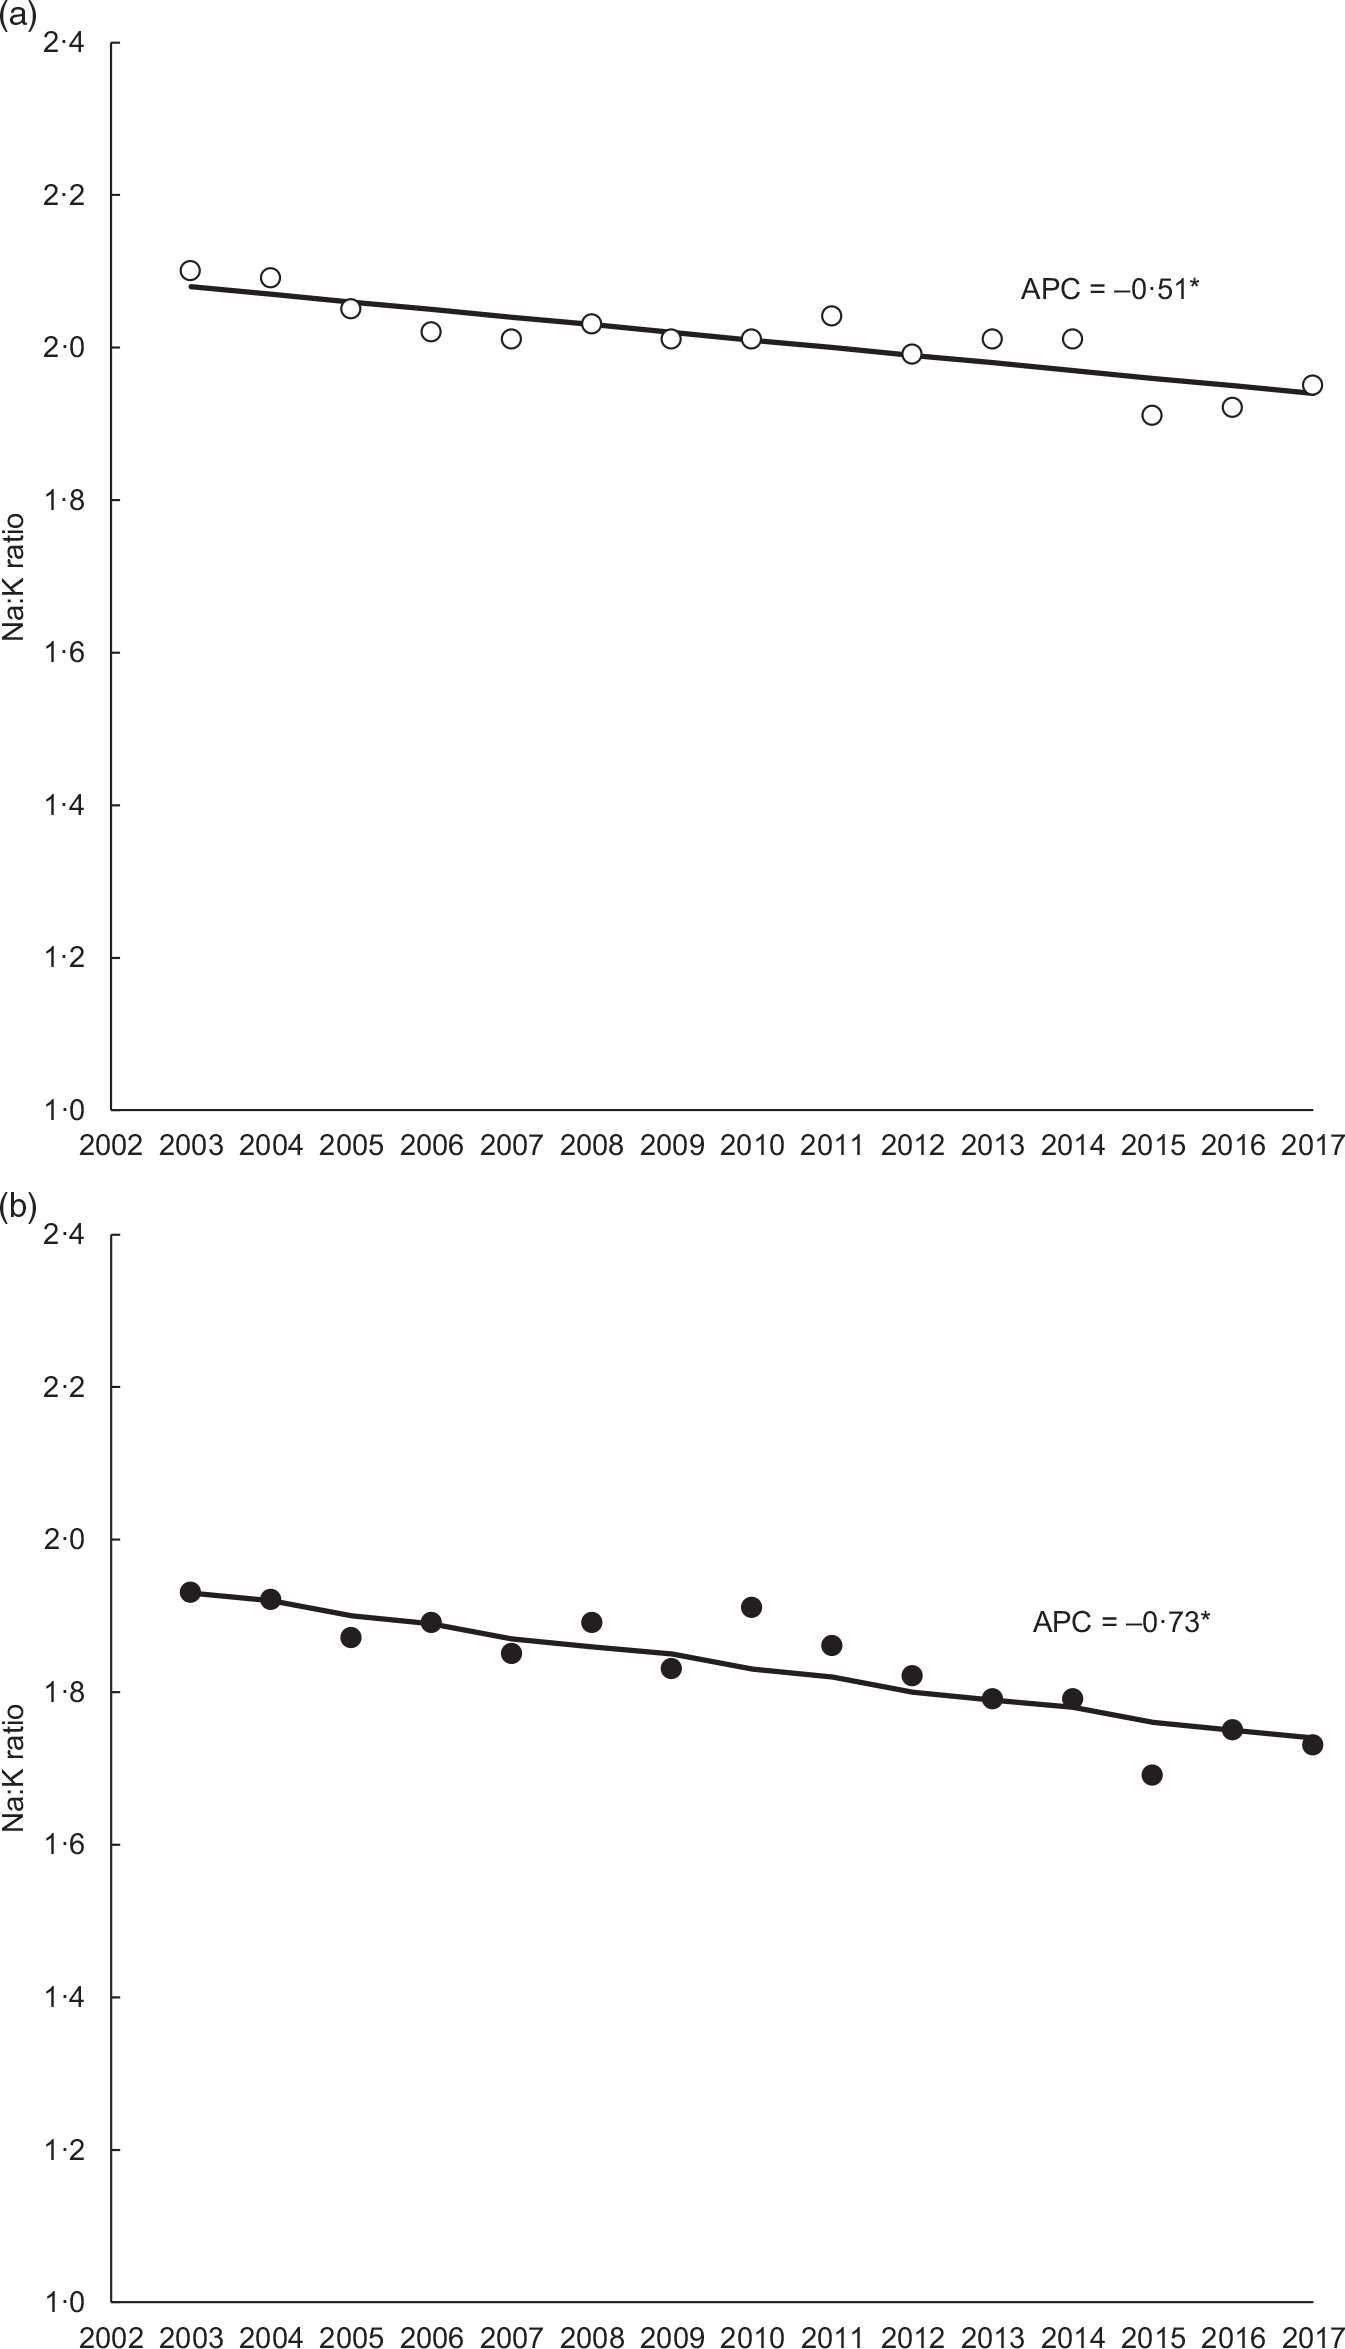
Fig. 1. (a) Trends in dietary sodium:potassium ratio adjusted for age category from 2003 to 2017 in men. * P < 0·001. ![]() , Observed value;
, Observed value; ![]() , modelled value. (b) Trends in dietary sodium:potassium ratio adjusted for age category from 2003 to 2017 in women. * P < 0·001. APC, annual percentage change.
, modelled value. (b) Trends in dietary sodium:potassium ratio adjusted for age category from 2003 to 2017 in women. * P < 0·001. APC, annual percentage change. ![]() , Observed value;
, Observed value; ![]() , modelled value.
, modelled value.
The median dietary Na:K ratios in all survey years were 1·85 for men and 1·70 for women. The demographic characteristics of the participants according to quintiles of dietary Na:K ratio according to sex are shown in Table 1. Participants with higher dietary Na:K ratio were younger and more likely to be smokers and current drinkers.
Table 1. Demographic characteristics of the participants according to quintile of sodium:potassium ratio
(Numbers and percentages; means and standard deviations)
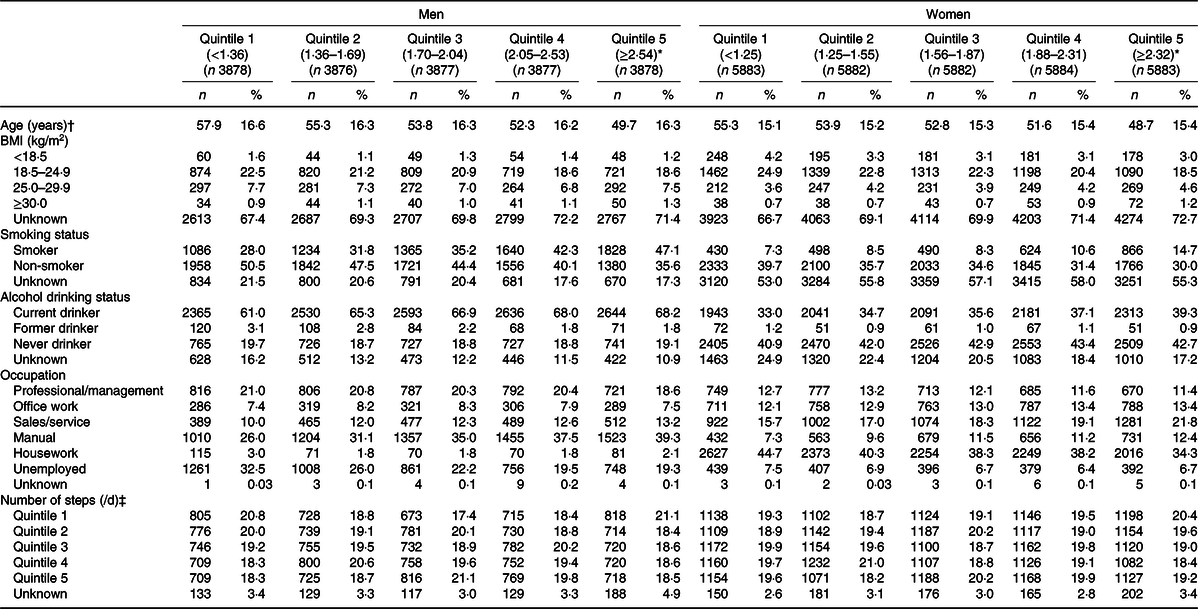
* Simple linear regression analyses and a χ 2 test were used for continuous and categorical variables, respectively. All P < 0·001, except for number of steps in women (P = 0·0074).
† Mean values and standard deviations.
‡ Steps: quintile 1 (<3700 for men, <3608 for women), quintile 2 (3700–5707 for men, 3608–5365 for women), quintile 3 (5708–7811 for men, 5366–7142 for women), quintile 4 (7812–10 635 for men, 7143–9493 for women), and quintile 5 (≥10 636 for men, ≥9494 for women).
Participants’ food intakes according to quintiles of dietary Na:K ratio by sex are shown in Table 2. Participants with higher Na:K ratio had higher intake of cereals, meats, eggs, alcohol beverages, and seasonings and spices. They had lower intake of potatoes, legumes, nuts, vegetables, fruits, mushrooms, fish, milk/milk products and confectioneries. Participants’ nutrient intake according to quintile of dietary Na:K ratio by sex is shown in Table 3. Participants with a higher Na:K ratio also had a lower intake of almost all nutrients such as protein, dietary fibre, vitamins and minerals, except for Na intake, in both men and women.
Table 2. Characteristics of the food intake of the participants according to quintile of sodium:potassium ratio
(Mean values and standard deviations)
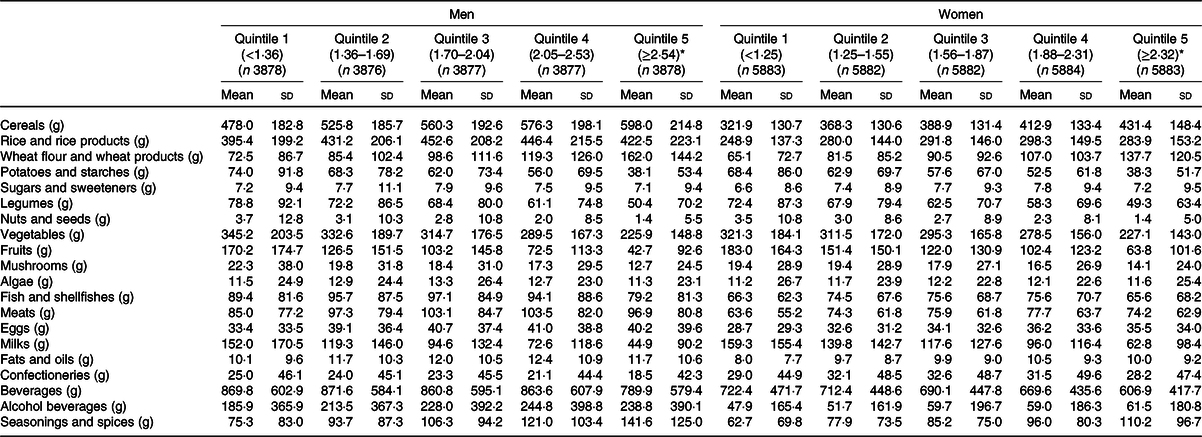
* Simple linear regression analyses were used and all P < 0·001.
Table 3. Characteristics of the nutrient intake of the participants according to quintile of sodium:potassium ratio
(Mean values and standard deviations)
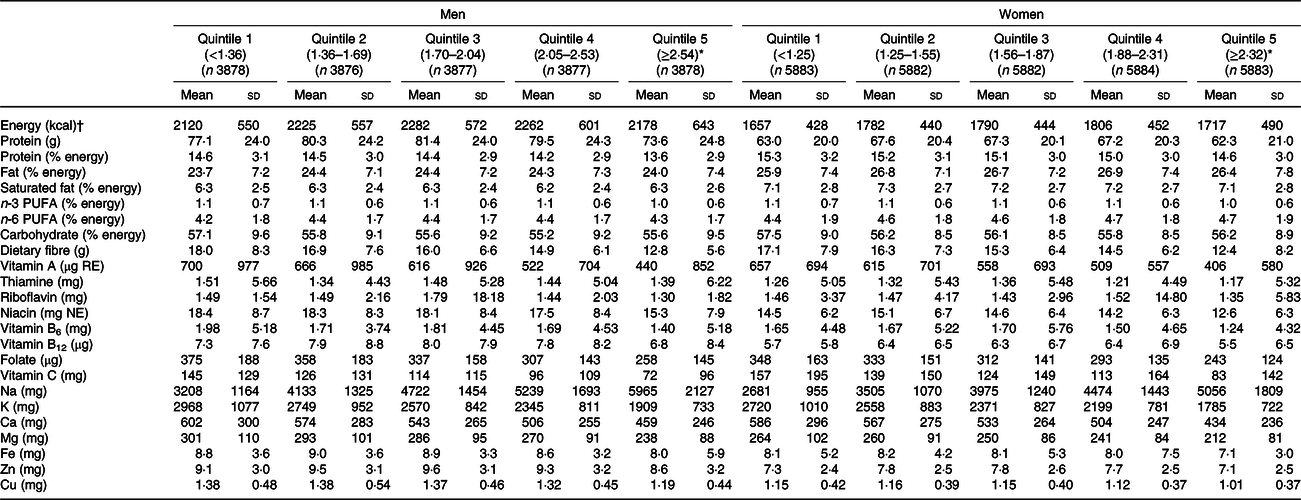
RE, retinol equivalents; NE, niacin equivalents.
* Simple linear regression analyses were used and all P < 0·001.
† To convert kcal to kJ, multiply by 4·184.
Table 4 shows the age- and multivariate-adjusted means of SBP, DBP, HbA1c, TC, HDL-cholesterol and non-HDL-cholesterol according to quintile of dietary Na:K ratio by sex. Higher Na:K ratio was associated with higher SBP and DBP in the multivariate model (SBP: P for trend < 0·001 (both men and women); DBP: P for trend = 0·008 (men) and 0·015 (women)). Higher Na:K ratio was also associated with a higher HbA1c level in the multivariate model (P for trend = 0·003 (both men and women)). In women, a higher Na:K ratio was associated with a lower TC and HDL-cholesterol level in the multivariate model (P for trend < 0·001). No significant association occurred between Na:K ratio and non-HDL-cholesterol level.
Table 4. Adjusted systolic blood pressure (SBP), diastolic blood pressure (DBP), HbA1c, total cholesterol (TC), HDL-cholesterol and non-HDL-cholesterol levels according to quintile of sodium:potassium ratio*
(Least square mean values and 95 % confidence intervals)

* Na:K ratio: quintile 1 (<1·36 for men, <1·25 for women), quintile 2 (1·36–1·69 for men, 1·25–1·55 for women), quintile 3 (1·70–2·04 for men, 1·56–1·87 for women), quintile 4 (2·05–2·53 for men, 1·88–2·31 for women) and quintile 5 (≥2·54 for men, ≥2·32 for women).
† Adjusted for age.
‡ Adjusted for age, BMI, smoking status, number of steps, alcohol intake amount, intake of protein and SFA, and survey year.
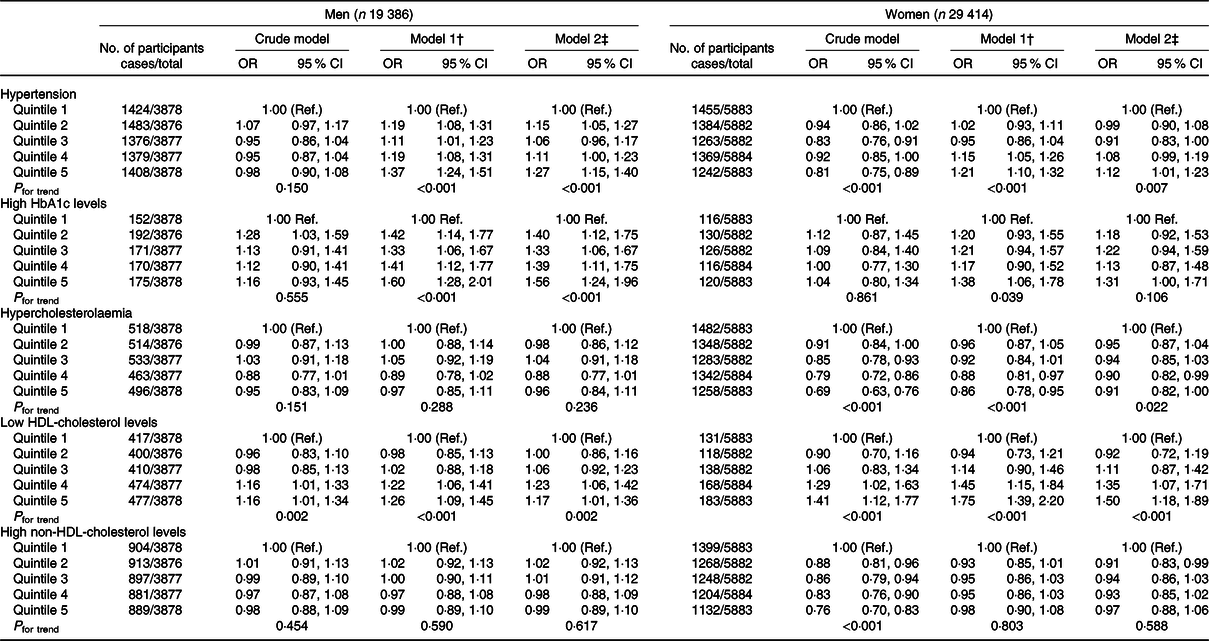
The results of the multivariate logistic regression analyses to determine OR of hypertension, high HbA1c levels, hypercholesterolaemia, low HDL-cholesterol levels and high non-HDL-cholesterol levels according to quintile of dietary Na:K ratio by sex are shown in Table 5. We found that out of all participants, 7070 (14·5 %) had hypertension, 860 (1·76 %) had high HbA1c levels, 2524 (5·17 %) had hypercholesterolaemia, 2178 (4·46 %) had low HDL-cholesterol levels and 4484 (9·19 %) had high non-HDL-cholesterol levels. Association was observed between higher Na:K ratio and higher prevalence of hypertension (OR 1·27; 95 % CI 1·15, 1·40 in the fifth quintile; P for trend < 0·001 for men and OR 1·12; 95 % CI 1·01, 1·23 in the fifth quintile; P for trend = 0·007 for women). Higher Na:K ratio was also associated with higher prevalence of high HbA1c levels in men (OR 1·56; 95 % CI 1·24, 1·96 in the fifth quintile; P for trend < 0·001). Higher prevalence of low HDL-cholesterol levels occurred with higher Na:K ratios in the fifth quintile for both men (OR 1·17; 95 % CI 1·01, 1·36; P for trend = 0·002) and women (OR 1·50; 95 % CI 1·18, 1·89; P for trend < 0·001). In women, no significant difference in OR of hypercholesterolaemia was observed in the fifth quintile of Na:K ratio; however, a decreasing trend according to quintile was observed (P for trend = 0·022). Regarding high non-HDL-cholesterol levels, no significant associations were observed between Na:K ratio in either men or women.
Table 5. Association between quintile of sodium:potassium ratio and hypertension, high HbA1c levels, hypercholesterolaemia, low HDL-cholesterol levels and high non-HDL-cholesterol levels*
(Odds ratios and 95 % confidence intervals)
Ref., reference.
* Na:K ratio: quintile 1 (<1·36 for men, <1·25 for women), quintile 2 (1·36–1·69 for men, 1·25–1·55 for women), quintile 3 (1·70–2·04 for men, 1·56–1·87 for women), quintile 4 (2·05–2·53 for men, 1·88–2·31 for women) and quintile 5 (≥2·54 for men, ≥2·32 for women).
† Adjusted for age.
‡ Adjusted for age, BMI, smoking status, number of steps, alcohol intake amount, intake of protein and SFA, and survey year.
Discussion
We investigated dietary Na:K ratio association with risk factors of CVD among Japanese adults, using the nationwide NHNS data from 2003 to 2017. Dietary Na:K ratio decreased in both men and women from 2003 to 2017. In the present study, a higher dietary Na:K ratio showed a positive association with CVD risk factors for hypertension and low HDL-cholesterol levels in both men and women, and high HbA1c levels in men. Individuals with a higher dietary Na:K ratio had lower consumption of almost all foods (potatoes, legumes, nuts, vegetables, fruits, mushrooms, fishes, milk and milk products, and confectioneries), beverages and almost all nutrients, such as protein, dietary fibre, vitamins and minerals. They also had higher consumption of cereals, meats, eggs and seasonings.
Dietary Na:K ratio, Na intake and K intake all decreased among both men and women from 2003 to 2017. Due to the greater decrease in Na intake than that of K, an annual decrease in dietary Na:K ratio was observed. In China, dietary Na:K ratio, assessed by three consecutive 24-h dietary recalls of condiment and food weights based on data from the China Health and Nutrition Survey, decreased from 1991 to 2009(Reference Du, Batis and Wang8), which is consistent with the results of the present study. In East Asia, particularly in Japan, high salt intake, greater than that of Western countries, is a public health problem(Reference Powles, Fahimi and Micha13). Against this background, population-based projects for reducing salt intake are being implemented at national and local government levels, and by food companies in Japan and other countries(Reference Trieu, Neal and Hawkes32–34). These projects for reducing salt intake might have already led to a decrease in Na:K ratio in Japan. Major food sources of salt for the Japanese are seasonings(Reference Anderson, Appel and Okuda35). In particular, traditional Japanese seasonings such as shoyu (soya sauce) and miso (fermented soya bean paste) have a higher Na content than other seasonings(36). However, we previously noted that, based on the NHNS data, larger portion sizes of soya sauce or miso were not associated with elevated BP levels among Japanese adults who typically have a higher intake of vegetables, soya products and mushrooms(Reference Okada, Saito and Takimoto14). In contrast, the food source of salt varies with age; for example, the proportion of adults consuming miso was higher in the elderly, and the proportions of those consuming Chinese noodles and Japanese curry roux were higher among the younger age groups(Reference Takimoto, Saito and Htun37). Moreover, the intake of vegetables containing a lot of K varies with age, as well(34). Therefore, an age-specific approach is needed to lower Na intake, increase K intake and lower the Na:K ratio, especially for the Japanese.
In this study, a higher dietary Na:K ratio was associated with higher SBP and DBP levels and with higher prevalence of hypertension among men and women. The positive association between dietary Na:K ratio and hypertension is consistent with previous literatures, which showed Na:K ratio assessed by diet or urine to be associated with BP levels or hypertension(Reference Du, Batis and Wang8–Reference Jackson, Cogswell and Zhao10). In a Korean study, dietary Na:K ratio was positively related with BP among men but not in women(Reference Kim, Kim and Shin38). Not only is there a relationship between Na and K intake and BP levels, our study suggests that a relationship also exists between the Na:K ratio and BP levels among Japanese adults.
We found association between higher Na:K ratios and higher prevalence of high HbA1c levels in men. A cohort study of the general Chinese population reported that a higher dietary Na:K ratio was associated with a higher risk of diabetes(Reference Hao, Liu and Halbert11), which is consistent with the results of our study. The study involving Korean population suggested that a high Na:K ratio is related to high insulin resistance and low insulin sensitivity(Reference Park, Kwock and Park39). A previous study has reported that the association between urinary Na:K ratio and DBP was stronger in a group with a higher homoeostasis model assessment of insulin resistance than with a lower homoeostasis model assessment of insulin resistance(Reference Millen, Norton and Majane40). The International Study of Macro-/Micro-nutrients and Blood Pressure (INTERMAP Study) that included Japan, China, the UK and the USA showed that urinary salt intake is positively associated with BMI and the prevalence of overweight and obesity(Reference Zhou, Stamler and Chan41). According to these findings, through increased body weight caused by a higher dietary Na:K ratio, insulin resistance was increased and might have impaired glucose tolerance, as evidenced by elevated HbA1c levels. This study’s participants in the highest quintile of dietary Na:K ratio consumed lower amounts of potatoes and starches, legumes, vegetables, fruits, mushrooms, and milk and dairy products than those in the lowest quintile (Table 2). In a previous meta-analysis, higher intake of vegetables, fruits and dairy was associated with reduced risk for diabetes(Reference Schwingshackl, Hoffmann and Lampousi42). Moreover, we previously showed data based on the NHNS that the dietary pattern, characterised by higher frequent consumption of vegetables, mushrooms, soyabeans and soyabean products, was associated with low prevalence of high HbA1c levels(Reference Okada, Takahashi and Nakamura43). Therefore, we speculate that the current observation regarding a higher dietary Na:K ratio and increased risk of diabetes or high HbA1c levels was due to the differences in intake of these food groups.
No significant difference in adjusted mean HDL-cholesterol levels according to quintiles of dietary Na:K ratio was observed among men; however, higher prevalence of low levels of HDL-cholesterol (<40 mg/dl (1·03 mmol/l)) was observed with higher Na:K ratio in both men and women. In healthy Korean adults, dietary Na:K ratio was positively correlated with serum TC and LDL-cholesterol levels, but not HDL-cholesterol levels(Reference Bu, Kang and Kim44). Some previous studies in Chinese adults have shown that a higher dietary Na:K ratio or urinary Na and K excretion are associated with the metabolic syndrome, with low HDL-cholesterol levels as one of the diagnostic criteria(Reference Li, Guo and Jin45,Reference Ge, Guo and Chen46) . Furthermore, high dietary Na:K ratio increased the risk of stroke or the total CVD risk in the general population(Reference Mirmiran, Bahadoran and Nazeri5–Reference Willey, Gardener and Cespedes7). To enhance public health in Japan, it is important to prevent the development of risk factors that lead to CVD by emphasising behavioural changes in dietary habits to reduce the Na:K ratio in light of the findings of this study.
We observed an association between higher dietary Na:K ratios and lower TC levels and a lower trend in the prevalence of hypercholesterolaemia among women. TC levels are generally higher in postmenopausal woman than in men, and the findings of the NHNS in Japan support this, reporting higher levels in women over the age of 50 years than men(16). The association of dietary Na:K ratio with TC levels and hypercholesterolaemia may have been observed in females alone due to the effects of female hormones. Moreover, factors that are not fully considered as confounding factors, such as exercise habits (not steps) and socio-economic factors, may affect the results. Further studies in different populations are required to clarify the association between the Na:K ratio and TC levels and hypercholesterolaemia.
This study had some limitations. First, owing to the nature of retrospective cross-sectional studies, this study was not able to show causal associations between the Na:K ratio and CVD risk factors. Having excluded participants using BP-lowering drugs, insulin or oral hypoglycaemic agents, or cholesterol-lowering drugs from this analysis, participants’ dietary habits were not likely to be affected by medical treatment or dietary instruction. Second, dietary intake assessed by self-administered dietary records might have been under- or over-reported. The Na:K ratio calculated from dietary records is more likely to be under- or over-estimated, compared with an estimate that is made using the 24-h urinary collection method, which is the gold standard of Na and K intake estimation. Third, we calculated the dietary Na:K ratio from dietary records of households with proportional distribution within the house. Reliance on household representatives to record dietary intakes in the survey might have resulted in misreporting of various foods, since Japanese workers typically eat out for lunch during the week. A previous study investigated the validity of determining consumption by individual family members through household-based and individual-based food weighing methods and showed that total energy and macronutrient consumption of individual participants showed a high level of agreement with the household-based weighing methods(Reference Iwaoka, Yoshiike and Date47). Therefore, dietary records from households with proportional distribution are a valid method to estimate individual intake in the NHNS, a large-scale survey. Fourth, dietary records might not reflect the average individual’s dietary habits, as this survey used dietary records from a single weekday, while individual habitual dietary intakes naturally vary between weekdays and weekends. However, we speculated that NHNS data reflect habitual intake at the population level. Finally, because there were participants who did not participate in the physical examinations and BMI was unavailable for some participants, it is possible that the BMI distribution among groups for the dietary Na:K ratio might be unbalanced/unmatched.
In conclusion, the dietary Na:K ratio decreased among Japanese adults from 2003 to 2017. Dietary Na:K ratio was associated with increased prevalence of hypertension and low HDL-cholesterol levels in both men and women, as well as high HbA1c levels in men. Our findings suggest that lower dietary Na:K ratio, which is higher K intake and lower Na intake, might help in preventing some risk factors of CVD among Japanese people. Further prospective studies are required to examine the association between dietary Na:K ratio and risk of developing CVD.
Acknowledgements
We are grateful to all participants of the 2003–2017 NHNS and the staff members who supported the survey in each local public health centre and the central office.
This research received no specific grant from any funding agency, commercial or not-for-profit sectors.
E. O. analysed the data and wrote the article. H. T., C. O., M. M. and A. F. substantially implemented the survey and consolidated the data. All authors critically revised the article and approved the final manuscript.
The authors declare that there are no conflicts of interest.


