


Hypertension is a major risk factor for CVD across the world. The prevalence of hypertension among adults was one-third of the total population in many countries including Japan(1,2) .
The prevention and control of hypertension have contributed to a substantial decline in stroke mortality in Japan(Reference Ikeda, Saito and Kondo3). Within Japan, however, there has been a regional difference in blood pressure levels and the incidence of stroke; levels were higher in northeastern Japan and lower in western Japan(Reference Kitamura, Sato and Kiyama4), which was attributable in part to high salt intake. In Akita (northeastern Japan), mean daily salt intake among middle-aged men was 20 g/d in 1969 and declined to 14 g/d between 1980 and 1983(Reference Shimamoto, Komachi and Inada5). According to the 2017 National Nutrition and Health Examination Survey, mean salt intake among adults aged ≥20 years was 11·6 g for men and 9·6 g for women, which was still higher than in other regions of Japan(6). The corresponding mean intake in 2017 was 9·9 g for men and 8·4 g for women in Osaka, mid-western Japan(6). Mean salt intakes in both Akita and Osaka are still higher than the recommended values for Japanese residents and far higher than the WHO recommendation (5 g)(7).
Salt taste perception is a factor influencing salt intake(Reference Azinge, Sofola and Silva8,Reference Piovesana, Sampaio and Gallani9) . Previous cross-sectional studies with small sample sizes (n 40–90) showed that lower salt taste perception was associated with higher 24-h urine Na excretion(Reference Azinge, Sofola and Silva8) and higher salt intake(Reference Piovesana, Sampaio and Gallani9), and lower taste perception was associated with a higher prevalence of hypertension(Reference Piovesana, Sampaio and Gallani9–Reference Mattes13), as indicated by increased systolic and diastolic blood pressure (SBP and DBP) levels(Reference Kirsten and Wagner14,Reference Cho, Kim and Jeong15) . A Japanese study of middle-aged men and women aged ≥40 years using Na-impregnated test strips showed that impaired salt taste (high salt recognition threshold) was associated with a higher prevalence of hypertension among women and their husbands(Reference Michikawa, Nishiwaki and Okamura16). In a Japanese study of women aged 40–74 years, the high perception threshold (≥1·0 % of salt) was associated with the masked hypertension (≥135/85 mmHg)(Reference Kubota, Higashiyama and Sugiyama17).
Our a priori hypothesis is that Akita persons show lower salt taste perception (recognition and detection) than Osaka persons because of their habitual higher salt intakes. The low salt recognition and detection may be associated with salt intake behaviours and higher blood pressure levels. Such trends are observed similarly for both men and women of middle and elderly ages. We aimed to clarify the distributions of salt taste perception and its associations with salt intake behaviours and blood pressure levels among population-based samples in Akita and Osaka communities with different salt intake levels.
Methods
Study population
This cross-sectional study was conducted under a cohort study of the Circulatory Risk in Communities Study (CIRCS)(Reference Imano, Kitamura and Sato18,Reference Yamagishi, Muraki and Kubota19) . The surveyed populations were men and women aged 30–74 years living in two communities – Ikawa town (a rural community in Akita Prefecture in northeastern Japan) and the Minami-Takayasu district in Yao City (a suburb community in Osaka Prefecture in mid-western Japan), both of which participated in the cardiovascular risk surveys in 2015 and 2016. A total of 1307 persons (524 men and 783 women) in Ikawa town (Akita) and 1760 persons (577 men and 1183 women) in the Minami–Takayasu district (Osaka) participated in the surveys. Among the survey participants, 1254 (504 men and 750 women) and 1388 (452 men and 936 women), respectively, gave consent to take the salt taste test.
We excluded 396 persons who recognised some taste on the no-Na strip (no salty taste): 222 (seventy-five men and 147 women) in Akita and 174 (fifty-two men and 122 women) in Osaka. Twenty-three persons had missing data in the questionnaire: eight (two men and six women) in Akita and fifteen (five men and ten women) in Osaka. Finally, we used the data of 1024 persons (427 men and 597 women) in Akita and 1199 subjects (395 men and 804 women) in Osaka for the analyses.
Data collection
Salt taste perception test
Our survey was conducted at room in early summer in Akita and in winter in Osaka. However, the room temperature was kept around 20°C. Taste tests were conducted as a part of health checkups where about 70 % of the participants are tested in the morning and about 30 % in the afternoon.
Salt taste perception was determined with a salt-impregnated taste strip, Salsave (Advantech Toyo Co.)(Reference Nishimoto, Hirota and Egawa20), impregnated with sodium chloride at concentrations of 0, 0·6, 0·8, 1·0, 1·2, 1·4 and 1·6 % with the extended lower concentrations of 0·1, 0·2 and 0·4 %. To validate these concentrations, we measured them using a polarised Zeeman atomic absorption spectrophotometer (model ZA-330, Hitachi High-Technologies Corporation). One piece of strip was dipped in 50 ml of distilled water for 48 h, and the sample water was diluted appropriately and applied to measure Na concentrations(Reference Maruyama, Nakamori and Nakanishi21). We confirmed the validity of all Na concentrations in every lot used.
We performed salt taste tests twice on twenty-five persons aged 22–54 years (average age 34·2 years) at 1–3 months apart. The Spearman correlation coefficient for recognition threshold was 0·59 (P = 0·002). The correlation for detection threshold could not be estimated in valid because of the narrow range (0·1 or 0·2 %) in the samples.
Constitutional and behavioural factors
We interviewed the subjects to determine whether they smoked, ate something and/or drank coffee or juice within 2 h before the test, and we asked if they were wearing dentures or had a stuffy/runny nose. We confirmed that these behaviours and symptoms were not related to salt taste perception, so we did not use these data for the analyses.
The detection threshold was defined as the lowest concentration at which the subject recognised change from a no-Na strip (no salty taste) to a Na-impregnated test strip, but the type of taste was not necessarily recognised. The recognition threshold was defined as the lowest concentration at which the subject recognised salty taste in two consecutive strips.
Before the taste test and during the test as needed, the subject’s mouth was moisturised with distilled water. To assess the salty taste, the subject held the 0·1 % strip in the mouth for 3 s and repeated the procedure using the strips of the higher concentrations of sodium chloride. An interviewer asked the subject whether he or she experienced no taste, some taste, sweet taste, salty taste, sour taste or bitter taste. Strips with increasing salt concentrations were applied until the subjects replied ‘salty taste’ for two consecutive concentrations. When the subject replied ‘some taste’ once, it was defined as the detection threshold. When the subject replied ‘salty taste,’ the higher concentration strip was reapplied. The concentration was at which the subjects could properly report a ‘salty taste’ sense. The lower concentration was defined as the value of recognition threshold.
The measurement of arterial SBP and fifth-phase DBP was performed by well-trained physicians using standard mercury sphygmomanometers on the right arm of participants after a rest of 5 min while seated. A second measurement of blood pressure was performed when participants had high blood pressure (130 mmHg SBP or 85 mmHg DBP) at the first measurement for the detection and follow-up of hypertensive subjects. In the present study, the data for the first blood pressure measurement were used for the analyses. Hypertension was defined as SBP ≥ 140 mmHg and/or DBP ≥ 90 mmHg and/or medication use for hypertension. Height in stocking feet and weight in light clothing were measured, and BMI was calculated as weight (kg)/height (m)2. Overweight was defined as BMI ≥ 25 kg/m2. Diabetes was defined as HbA1c (National Glycohemoglobin Standardization Program) ≥6·5 %, and/or a serum glucose level of ≥126 mg/dl (7·0 mmol/l) during fasting or ≥200 mg/dl (11·1 mmol/l) during non-fasting, and/or medication use for diabetes.
An interview was conducted to ascertain the smoking status, usual ethanol intake per week, dietary behaviours, eating behaviours and preference of taste. Smoking status was defined as never, former and current smoker. Ethanol intake status was defined as never, former or current drinker, and for current drinkers, we converted the usual ethanol intake of the Japanese unit ‘go’ into 23 g of ethanol per d. We asked about behaviours of the salty food intake using the questionnaire: ‘Do you season all food salty?’, ‘Do you drink salty soup (miso-soup etc.) ≥2 times per d?’, ‘Do you drink up noodle soup?’, ‘Do you eat salt-preserved food ≥3 times per week?’, ‘Do you put salty soya or Western sauce before checking taste?’, ‘Do you eat salt-preserved pickles ≥2 times per d?’, Other eating behaviours were asked, such as ‘the frequency of eating out ≥1 time per week’ and ‘the frequency of eating delicatessen foods ≥1 time per week’. The salt intake score was defined as counting the number of salty food intake behaviours(Reference Maruyama, Nakamori and Nakanishi21).
Ethics, consent and permissions
This study was conducted according to the guidelines laid down in the Declaration of Helsinki, and all procedures involving research study participants were approved by the Ethics Committee of Osaka University (no. 14285) and the Institutional Review Board of the Osaka Center for Cancer and Cardiovascular Disease Prevention (26-ethics-15). According to the Japanese ethics guidelines, we provided the ethical information on our study at the survey sites and opted out opportunities. Verbal informed consent was obtained from all subjects. The consent was obtained from the area representative (the ‘mayor’) after explaining the purpose of the study.
Statistical analysis
Characteristics of the study subjects were presented as mean values and standard deviations or proportions (%). These characteristics were compared between Akita and Osaka using ANCOVA and the χ 2 test.
The analysis for trends, salt intake score, SBP and DBP according to detection and recognition thresholds was conducted using the median of detection and recognition thresholds in each category. The detection threshold was categorised as the salt concentrations 0·1, 0·2 and ≥0·4 %. The recognition threshold was categorised as the salt concentrations 0·1, 0·2–0·4, 0·6–1·0 and 1·2–1·6 %, and not recognising of 1·6 % salt taste. The potential confounding factors included continuous BMI (kg/m2), smoking status (e.g. former or current) and grams of ethanol intake per d. For sensibility analyses of SBP and DBP according to detection and recognition thresholds, we excluded meidication users for hypertension. All analyses were performed using the SAS statistical package version 9.4 (SAS Institute Inc.). All probability values for statistical tests were two-tailed, and values of P < 0·05 were regarded as indicative of statistical significance.
Results
Table 1 shows sex- and age-specific characteristics of the subjects in Akita (rural) and Osaka (urban) communities. Mean SBP was higher in Akita than in Osaka for women aged 60–74 years, but such a difference was not observed for men and women aged 30–59 years. Mean DBP did not differ between Akita and Osaka for both men and women of both age groups. The proportion of medication use for hypertension was higher in Akita than in Osaka for both men and women aged 60–74 years. Means of BMI were higher in Akita than in Osaka for women of both age groups. The proportion of overweight (BMI ≥ 25·0 kg/m2) was higher in Akita than Osaka for women aged 60–74 years, but the opposite trend was observed for women aged 30–59 years. Such differences were not observed for men. The proportion of diabetes mellitus was higher in Akita than in Osaka for men aged 30–59 years, and the proportion of current smokers did not differ between Akita and Osaka for both men and women of both age groups. The proportion of current drinkers was higher in Akita than in Osaka for men aged 60–74 years, while the opposite trend was observed for women of both age groups.
Table 1. Sex- and age-specific characteristics of study subjects in Akita and Osaka
(Mean values and standard deviations; numbers and percentages)
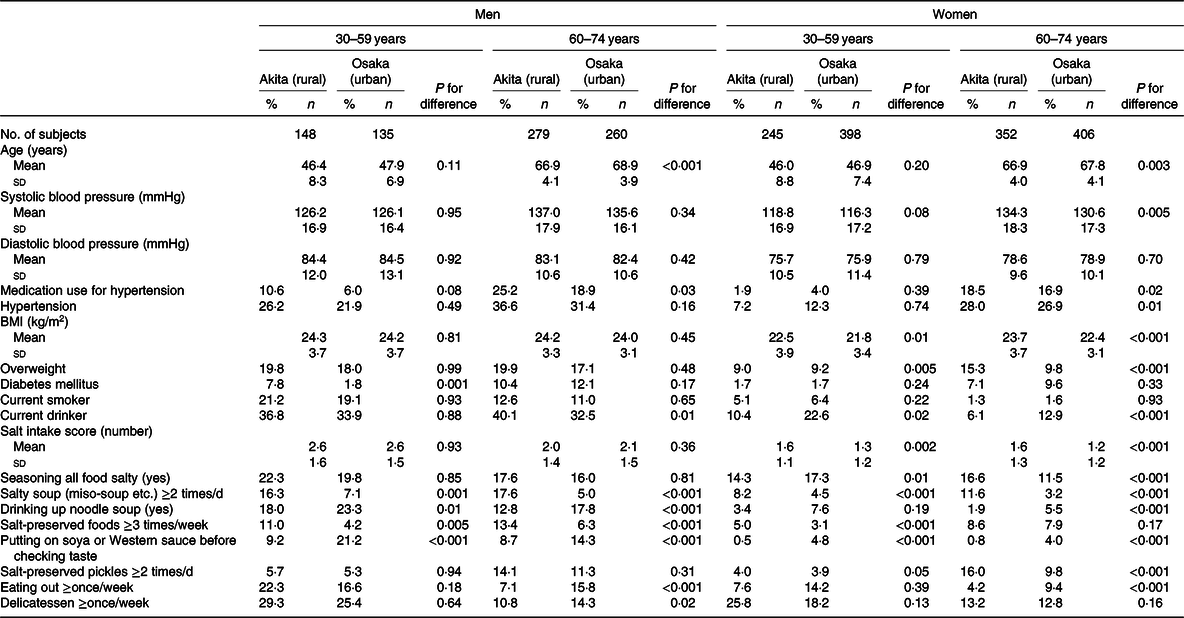
Mean of the salt intake score was higher in Akita than in Osaka for women of both age groups but did not differ between them for men. For men and women of both age groups, the proportion of drinking salty soup (e.g. miso-soup) ≥2 times/d was higher in Akita than in Osaka, while the proportion of adding soya or Western sauce before checking taste was higher in Osaka than in Akita. The proportion of eating salt-preserved food ≥3 times/week was higher in Akita than in Osaka for men of both age groups and for women of 60–74 years, and the proportion of eating salt-preserved pickles ≥2 times/d was higher in Akita than in Osaka for women of both age groups. The proportion of drinking up noodle soup was higher in Osaka than in Akita for men of both age groups and for women of 60–74 years, and the proportion of eating out ≥3 times/week was higher in Osaka than in Akita for men and women of 60–74 years.
The distributions of detection and recognition thresholds are shown in Fig. 1. The proportion of detection for 0·1 % salt was similar between Akita and Osaka for both men and women: 61 and 62 %, respectively, for men and both 79 % for women. The proportion of recognition for 0·1 % salt was 20 % in Akita and 15 % in Osaka for men (P for difference = 0·09) and 32 % and 24 %, respectively, for women (P for difference = 0·01). The proportion of no recognition for 1·6 % salt taste was similar between Akita and Osaka: 34 and 30 %, respectively, for men, but lower in Akita (16 %) than in Osaka (21 %) for women (P for difference = 0·01).
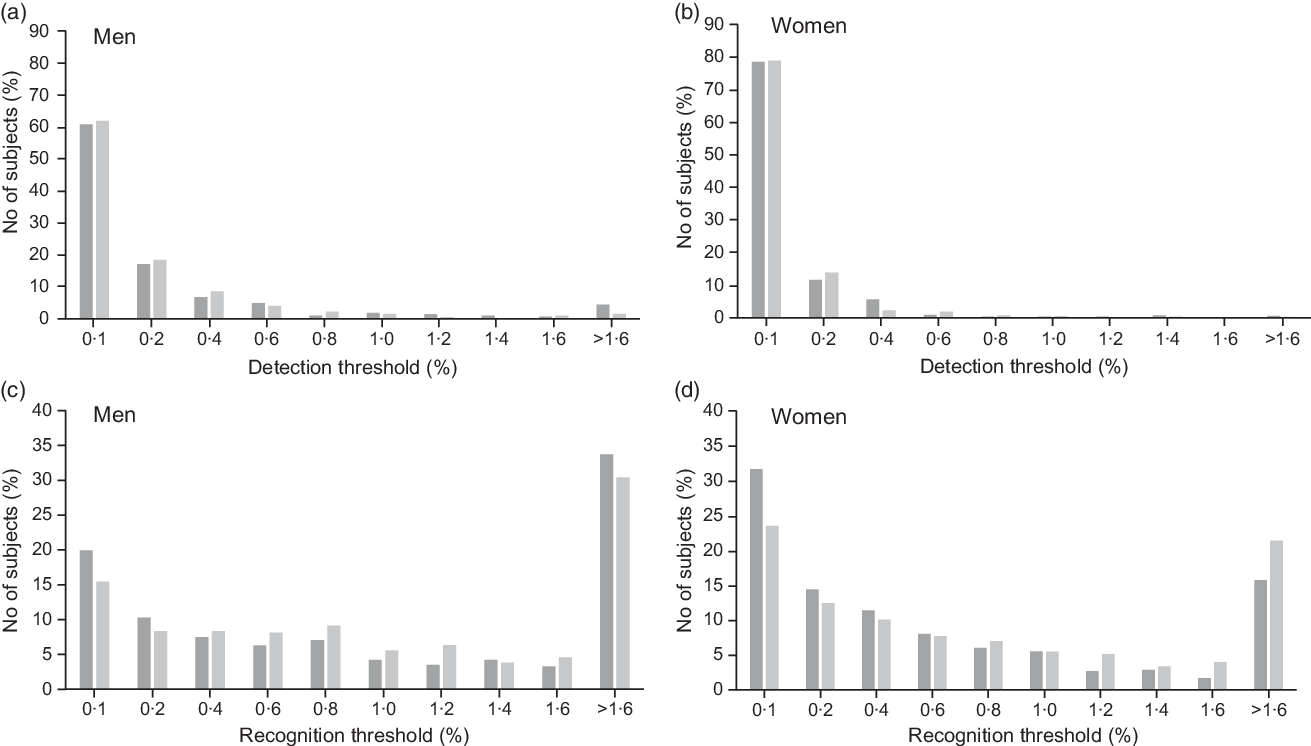
Fig. 1. Distributions of detection (a, b) and recognition (c, d) thresholds to salt taste in Akita (![]() ) and Osaka (
) and Osaka (![]() ). >1·6: not recognising of 1·6% salt taste.
). >1·6: not recognising of 1·6% salt taste.
When we further examined the detection and recognition thresholds by age group (Table 2), the detection threshold distribution was higher in Akita than in Osaka for women aged 60–74 years (P for difference = 0·03) but did not differ between them for men of both age groups and for women of 30–59 years. The recognition threshold distribution was lower in Akita than in Osaka for women of both age groups (P for difference <0·002 in 30–59 years and <0·05 in 60–74 years) but did not differ between them for men.
Table 2. Sex- and age-specific proportions for distributions of detection and recognition thresholds of salt in Akita and Osaka
(Numbers and percentages)
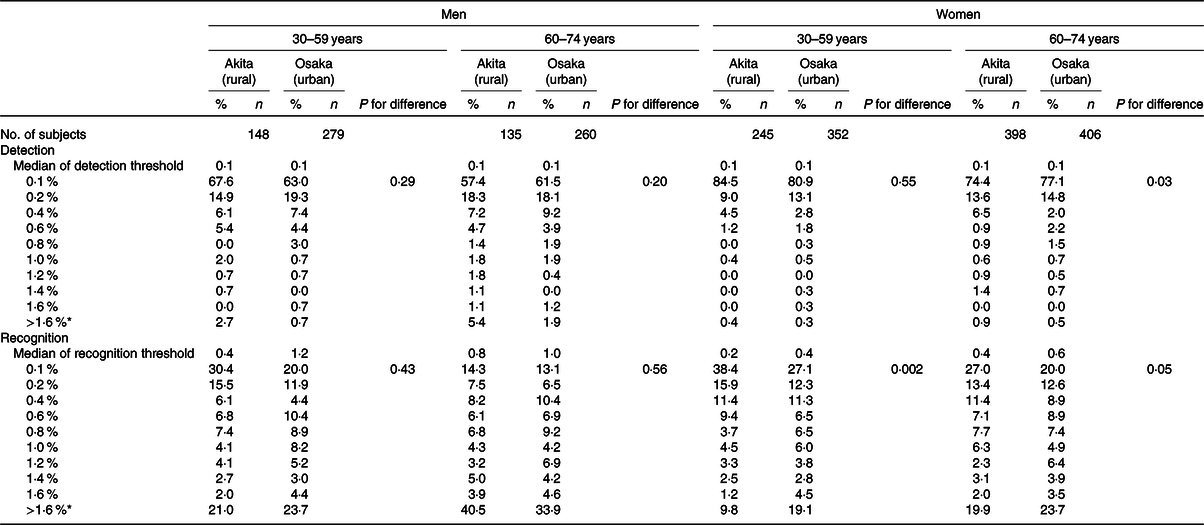
* >1·6 %: not recognising of 1·6 % salt taste.
Sex- and age-specific means and standard errors of salt intake scores according to detection and recognition thresholds in Akita and Osaka are shown in Table 3. Mean salt intake scores tended to be higher with higher detection and recognition thresholds in Akita men aged 30–59 years (P for trend =0·13 and =0·05, respectively). Among Akita women aged 60–74 years, mean salt intake scores tended to be higher with higher detection threshold (P for trend = 0·06); however, mean salt intake scores tended to be lower with higher recognition threshold (P for trend = 0·07). Such trends were not observed for other sex- and age groups in Akita and Osaka. Similar results were observed when we excluded the medication users for sex and age hypertension (online Supplementary Table S1).
Table 3. Salt intake scores according to detection and recognition thresholds in Akita and Osaka
(Sex- and age-specific mean values with their standard errors; numbers)
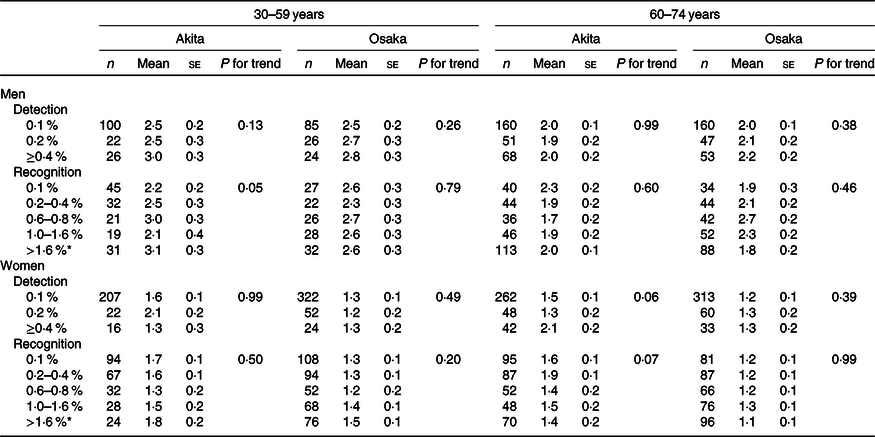
* >1·6 %: not recognising of 1·6 % salt taste.
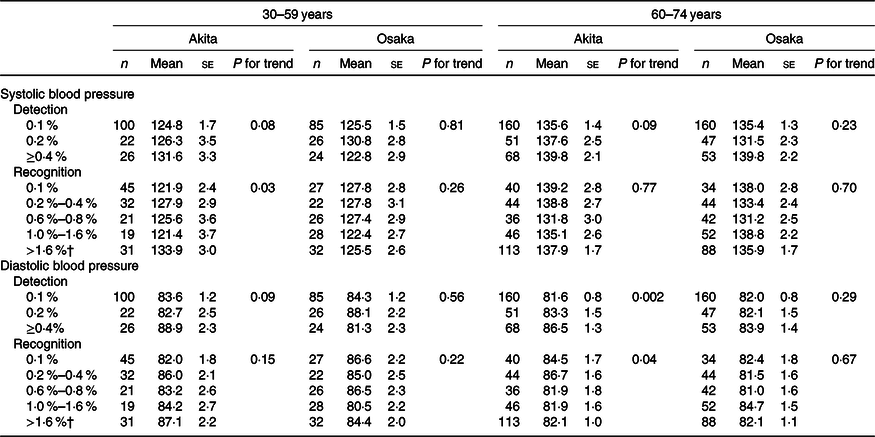
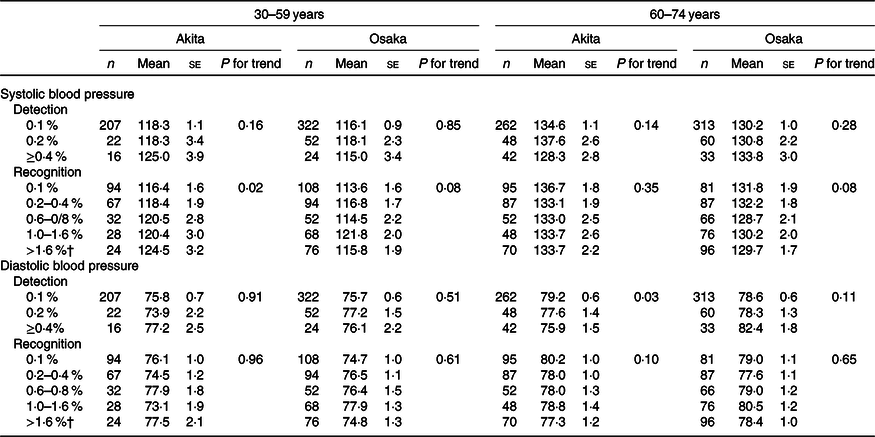
Tables 4 and 5 indicate age-specific means and standard errors of SBP and DBP according to detection and recognition thresholds for men and women, respectively, in Akita and Osaka. Among Akita men aged 30–59 years, mean SBP and DBP tended to be higher with higher detection threshold (P for trend =0·08 for SBP and =0·09 for DBP), and mean DBP was higher with higher recognition threshold (P for trend = 0·03). Among Akita women aged 30–59 years, mean SBP was higher with higher recognition threshold (P for trend = 0·02). Among Akita men aged 60–74 years, mean SBP tended to be higher and mean DBP was higher with higher detection threshold (P for trend =0·09 and =0·002, respectively), while mean DBP was lower with higher recognition threshold (P for trend = 0·04). Among Akita women aged 60–74 years, mean DBP was lower with higher detection threshold (P for trend = 0·03). Similar results were observed when we excluded the medication users for hypertension (online Supplementary Tables S2 and S3).
Table 4. Systolic and diastolic blood pressures according to detection and recognition thresholds for men in Akita and Osaka*
(Age-specific mean values with their standard errors)
* Adjusted for BMI, smoking status and ethanol intake.
† >1·6 %: not recognising of 1·6 % salt taste.
Table 5. Systolic and diastolic blood pressures according to detection and recognition thresholds for women in Akita and Osaka*
(Age-specific mean values with their standard errors)
* Adjusted for BMI, smoking status and ethanol intake.
† >1·6 %: not recognising of 1·6 % salt taste.
Discussion
In this population-based cross-sectional study of Akita and Osaka communities, our findings indicated that women were more likely to recognise salt taste than men in both communities. A previous report from the SONIC study on Japanese aged 69–71 years (477 men and 519 women) and 79–81 years (449 men and 500 women) showed that the recognition for salt taste was better in women than in men of both age groups(Reference Yoshinaka, Ikebe and Uota22). In that study, the proportion of non-recognition for >0·5 % salt was 6·7 % in subjects aged 69–71 years and 13·2 % in those aged 79–81 years.
In the present study, detection and recognition thresholds tended to be associated with higher salt intake scores for Akita men aged 30–59 years, in which SBP was positively associated with detection and recognition thresholds after adjustment for potential confounding factors such as BMI, smoking status and usual ethanol intake. Similarly, DBP tended to be associated with detection and recognition thresholds. A previous cross-sectional study of eighteen hypertensives and twenty-two normotensives aged 19–70 years indicated that higher salt recognition threshold (ranging 0·03 to 2·6 %) was associated with higher 24-h urinary Na excretion(Reference Azinge, Sofola and Silva8). A cross-cultural study of sixty-four Myanmarese men and women aged 53·3 (sd 9·4) years and sixty-seven Korean men and women aged 56·4 (sd 10·7) years in clinical settings showed that Myanmarese adults had higher salt detection and recognition thresholds, salt preference, salt usage behaviour scores and higher mean SBP and DBP than Koreans adults(Reference Cho, Kim and Jeong15). That study also reported that detection and recognition thresholds were positively associated with SBP levels, but confounding factors such as age, sex, BMI and hypertension were not considered. According to a study of 421 Brazilian adolescents aged 14–19 years, salt recognition threshold was positively associated with DBP levels after the adjustment for age, sex, BMI and physical activity(Reference Kirsten and Wagner14). A Japanese study of 344 men and 479 women aged ≥40 years showed that women with high salt recognition threshold (≥1·0 %) compared with <1·0 % recognition were associated with a 2·47 times higher prevalence of hypertension after adjustment for age, BMI, casual blood glucose, total cholesterol, presence of artificial teeth, smoking and alcohol consumption(Reference Michikawa, Nishiwaki and Okamura16). In that study, such an association was not observed for men.
Our a priori hypotheses are that thresholds for salt recognition and detection are higher in Akita than Osaka and that higher thresholds are associated with higher salt intake and blood pressure levels in both communities. Such trends were expected to be observed similarly for both men and middle-aged women. Our findings agreed with our hypothesis, but the findings among other sex, age and area groups did not concur. Among Akita women aged 60–74 years, higher recognition threshold tended to be associated with lower salt intake scores, and higher detection and recognition thresholds were associated with lower blood pressure levels. These results may be due in part to an effect of long-term intervention programmes for the prevention of hypertension and stroke, which has been conducted in the Akita community since 1964(Reference Shimamoto, Komachi and Inada5,Reference Iso, Shimamoto and Naito23) . Along with systematic screenings to detect hypertensives and education programmes for salt reduction, mean salt intake has declined substantially(Reference Kitamura, Sato and Kiyama4). In the UK, the average salt intake of the national representable samples aged 19–64 years gradually decreased from 9·5 g/d in 2003 to 8·1 g/d in 2011 due to a national programme of lowing Na concentrations in processed foods, especially bread (1·23 g salt/100 g bread to 0·98 g/100 g). Mean levels of systolic and diastolic blood pressure levels decreased in parallel by 2·7 and 1·1 mmHg, respectively(Reference Brinsden, He and Jenner24,Reference He, Pombo-Rodrigues and Macgregor25) . In our study populations, we have conducted education for salt reduction, instead of a programme for salt reduction in processed foods. In the elderly in Akita, salt intake behaviour may have been modified by our education programme(Reference Iso, Shimamoto and Naito23).
We assume that salt reduction education may contribute to reduce salt intake and to lower blood pressure in levels, regardless of salt perception. Salt intake in the Osaka community has been lower than in the Akita community; hence, the associations observed in middle-aged Akita men were unlikely to be detected.
A strength of the present study was including large samples in community-based settings, so that our study findings could be generalised to Japanese populations. Second, we defined the recognition thresholds using two consecutive concentrations to confirm them more reliably unlike previous studies(Reference Kirsten and Wagner14–Reference Michikawa, Nishiwaki and Okamura16). However, several limitations should be mentioned. Due to the cross-sectional design, we could not confirm temporal relationships of salt detection and recognition with salt intake and blood pressure levels. A study of twenty-nine chronic kidney patients showed that the average salt recognition thresholds declined after 1 week of Na restriction(Reference Kusaba, Mori and Masami26), but the causality was not confirmed because of no control setting.
In conclusion, we found that the higher thresholds of salt perception were positively associated with salt intake behaviours and higher blood pressure levels among rural men and middle-aged women who may have higher salt intake than other sex, age and area groups. Our findings suggest that salt perception should be taken into account to modify salt intake for populations with high salt intake.
Acknowledgements
The authors acknowledge Dr Megumi Murakami for her contribution to the measurement of Na concentration by a polarised Zeeman atomic absorption spectrophotometer. The authors are grateful for the contributions of the public health nurses, nutritionists, nurses, medical technologists and other staff of the Osaka Medical Center for Health Science and Promotion.
This work had financial support in 2015 from SKYLARK Food Science Institute.
SKYLARK Food Science Institute had no role in the design, analysis or writing of this article.
The authors’ responsibilities were as follows: A. K., A. K., H. I., R. C., M. U., K. Y., T. O., I. M., M. H.-T., M. K. and H. I. all contributed to the conception and design of the study. A. K. analysed the data. A. K., A. K. and H. I. drafted the manuscript. All authors contributed to manuscript preparation and revision for intellectual content.
The authors declare that there are no conflicts of interest.
Supplementary material
For supplementary material referred to in this article, please visit https://doi.org/10.1017/S0007114520002640


 Open access