


Micronutrient deficiencies are rampant in India among all age groups. The intervention strategies include supplementation, fortification and dietary diversification, the latter being the most sustainable approach. This strategy can be promoted through intense education and mass awareness programmes. Lack of culture-appropriate nutrition education has been identified as one of the weakest links of nutrition interventions in India targeting micronutrient malnutrition( Reference Vijayaraghavan 1 ). One of the obstacles for this could be the lack of information on current nutrition knowledge among different population groups, which in turn can be attributed to the lack of validated assessment tools for testing knowledge among target groups. The need for valid and reliable tools in nutrition education research for assessment of knowledge is now well recognized on account of the realization that the poor association between nutritional knowledge and dietary intake may be due to the poor assessment of knowledge( Reference Kline 2 – Reference Stevens, Cornell and Story 12 ).
Development of a valid questionnaire based on pre-defined criteria was suggested by Kline( Reference Kline 2 ). Applying these criteria, a general nutrition knowledge questionnaire was developed for the US adult population which has been translated, pre-tested and used widely( Reference Parmenter and Wardle 3 – Reference Shaaban, Nassar and Abd Elhamid 5 ). Attempts have been made elsewhere to develop reliable questionnaires for nutrition education research, focusing on general nutrition knowledge of adults( Reference Turconi, Celsa and Rezzani 6 , Reference Anderson, Bell and Adamson 7 ). Tools have also been developed for use among elementary-school teachers and children aimed at measuring the dietary intake or general nutrition knowledge( Reference Lambert, Monroe and Wolff 8 – Reference Resnicow, Hearn and Delano 10 ). Additionally, there have been needs-based attempts in the past to develop questionnaires addressing specific areas of nutrition knowledge like fat, fibre and cholesterol( Reference Resnicow, Hearn and Delano 10 , Reference Steenhuis, Brug and Van Assema 11 ). A questionnaire was also developed for assessment of physical activity, diet, weight-related attitudes and cultural identity among American Indian children( Reference Stevens, Cornell and Story 12 ).
Furthermore, studies on the relationship between nutrition knowledge and nutritional status are often restricted to either intake data or body weight( Reference O'Brien and Davies 13 – Reference Worsley 15 ). Studies attempting to relate nutrition knowledge to the biomarkers of nutrients are difficult to find. Such information can however be helpful for strengthening validity in the development of nutrition knowledge questionnaires. A valid and reliable questionnaire can help nutrition scientists to monitor the impact of interventions aimed at improving the dietary intake of micronutrients.
There are no validated tools in the literature to assess knowledge on micronutrients, deficiency of which is an emerging area of concern in developing countries like India. Since adolescence is an age group where maximum behaviour change is possible( 16 ), the aim of the present study was to develop a psychometrically valid and reliable questionnaire for testing knowledge on micronutrients. The study also attempted to apply the validated questionnaire among a group of adolescents whose micronutrient status was already assessed, to understand the relationship between knowledge and biomarkers of micronutrient status.
Methods
All procedures and protocols were approved by the Institutional Ethics Committee. Permission was obtained from the principals of the participating schools and the Directorate of Intermediate Education, Government of Andhra Pradesh – a southern state of India. The study was carried out in 2009–2010 in Government-run schools which cater to students belonging to low- and middle-income families. A written informed consent from parents, and assent from students, was obtained.
Development of questionnaire
The questionnaire was constructed using the method suggested by Kline( Reference Kline 2 ) and Garret and Woodworth( Reference Garret and Woodworth 17 ). The process of questionnaire construction consisted of forming an item pool, carrying out a content analysis, and analysing the item difficulty, discriminative power, validity and reliability.
Item pool
The item pool addressed specific micronutrients on the basis of: (i) those that were known to be deficient among the population; (ii) those that had a reliable biomarker; and (iii) intake data being available. Among the fat-soluble vitamins, vitamins A and E were selected. Vitamin C, vitamin B12 and folic acid were addressed among the water-soluble vitamins. Fe was the only mineral considered on account of its low intake and widespread deficiency. The questions were designed within three major domains: (i) functions; (ii) signs of deficiencies; and (iii) sources of the micronutrients. A few questions on general health, nutrition and national programmes were also included (Table 1). An item pool of 106 questions was constructed from the literature, available validated questionnaires and by consulting experts in the field of nutrition. The item pool was subjected to content analysis.
Table 1 Knowledge segments covered under the domains of function, deficiency and food sources in the item pool
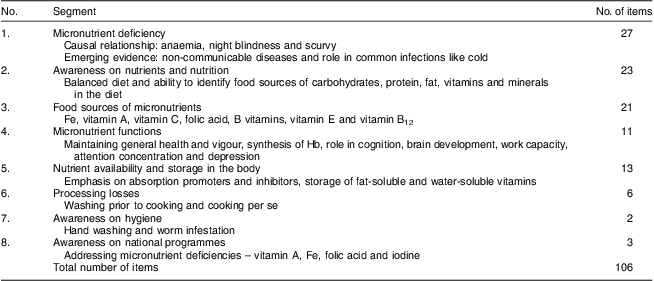
| No. | Segment | No. of items |
| 1. | Micronutrient deficiency | 27 |
| ;Causal relationship: anaemia, night blindness and scurvy | ||
| ;Emerging evidence: non-communicable diseases and role in common infections like cold | ||
| 2. | Awareness on nutrients and nutrition | 23 |
| ;Balanced diet and ability to identify food sources of carbohydrates, protein, fat, vitamins and minerals ;in the diet | ||
| 3. | Food sources of micronutrients | 21 |
| ;Fe, vitamin A, vitamin C, folic acid, B vitamins, vitamin E and vitamin B12 | ||
| 4. | Micronutrient functions | 11 |
| ;Maintaining general health and vigour, synthesis of Hb, role in cognition, brain development, work capacity, ;attention concentration and depression | ||
| 5. | Nutrient availability and storage in the body | 13 |
| ;Emphasis on absorption promoters and inhibitors, storage of fat-soluble and water-soluble vitamins | ||
| 6. | Processing losses | 6 |
| ;Washing prior to cooking and cooking per se | ||
| 7. | Awareness on hygiene | 2 |
| ;Hand washing and worm infestation | ||
| 8. | Awareness on national programmes | 3 |
| ;Addressing micronutrient deficiencies – vitamin A, Fe, folic acid and iodine | ||
| Total number of items | 106 |
Content analysis
Content analysis was done by the judgement method. The questions were direct and no negative phrasing was used. Two independent reviews were carried out by a panel of five experts from the fields of nutrition, psychology, medicine and basic sciences to select the questions that were appropriate, accurate and interpretable. The acceptance, rejection or modification of an item was based on majority opinion.
Pre-test
The questionnaire was translated to the regional language, Telugu, using the forward–backward translation method and pre-tested in a group of adolescents aged 15–19 years studying in 12th grade. The questionnaire was self-administered. The group consisted of equal number of students from science and commerce streams (n 92) from both genders (thirty-seven girls and fifty-five boys).
Scoring
The thirty-one-item questionnaire consisted of twenty-eight closed-end questions and three open-ended questions. The closed-end questions consisted of sixteen ‘yes/no’ questions and twelve multiple-choice questions. There was only one correct answer to each question and an option of ‘not sure’ was used to reduce response bias. The responses were scored by awarding a mark of 1 to the correct response and a mark of 0 to an incorrect or blank response.
Item difficulty index
The item difficulty index (p) was determined by the number of students in the group who performed correctly on the item and expressed as a ratio of correct responses to the total number of questions. An item with a value of p below 0·20 was considered difficult, while p above 0·80 indicated an easy item( Reference Garret and Woodworth 17 ).
Item discrimination index
The steps involved in determining the item discrimination index (D) consisted of identifying the 27 % of students who had the highest overall scores and the 27 % with the lowest scores, representing the tail from the mean of the standard normal distribution of response error( Reference Garret and Woodworth 17 ). The p levels for the upper and lower groups were determined as described above, and then the p levels of the lower group were subtracted from those of the upper group; the resulting values were considered as D. The higher the D, the more discriminating was the item. A value of D = 0·20–0·29 was considered ‘acceptable’, D = 0·30–0·39 as ‘good’ and D > 0·40 was considered ‘excellent’ as per available literature( Reference Ebel 18 ).
Item validity index
The validity index of each item (calculated as point bi-serial r) was determined by the extent to which the given item could discriminate among students who differed sharply in the function measured by the test as a whole and was determined by the inter-correlation between each item in a scale( Reference Anderson, Bell and Adamson 7 ). Point bi-serial r is mathematically equivalent to Pearson product moment correlation and is used when one of the variables is dichotomous. A point bi-serial r of 0·2 was considered valid( Reference Kline 2 ) except in circumstances where an item was considered essential in terms of content validity. In such cases, an r value of ≥0·1 was considered a minimum requirement as described in the literature( Reference Garret and Woodworth 17 ).
Internal consistency
The rational equivalence method using Cronbach's α was employed to assess the reliability of the test. Cronbach's α estimates the reliability of test scores with respect to (i) how well the individual items of the scores fit together and (ii) whether they assess the same construct. It assesses the inter-correlations of the items in the test and the correlations of the items with the test as a whole. A value of α above 0·70 was considered acceptable on the internal consistency as per available literature( Reference Kline 2 , Reference Wilson, Magarey and Mastersson 19 ) and was done using the SPSS statistical software package version 16·0 (SPSS Inc., Chicago, IL, USA).
Test–retest reliability
Considering a minimum of five observations for each item and a drop-out rate of 20 %, in total 108 students were considered sufficient for the study on test–retest reliability of the eighteen-item questionnaire that was developed. The questionnaire was self-administered. The time taken to complete the questionnaire was noted down using a wrist watch. The students were kept unaware of the retest that was done after a gap of 7 d( Reference Zarnowiecki, Dollman and Sinn 9 ). A total of 100 students completed both the contacts of the test–retest. A Bland–Altman plot was constructed and the intra-class correlation coefficient (ICC) was calculated for assessing the agreement between the scores( Reference Myles and Cui 20 , Reference Rosner 21 ). An ICC above 0·75 was considered acceptable( Reference Rosner 21 ).
Relationship between biomarkers and knowledge on micronutrients
The knowledge questionnaire was applied to a group of students participating in a 2-year study on ‘Stress, allostatic load and micronutrient status among students: impact of dietary advice’. For this, five single-gender schools catering to male students from three different geographical locations of Greater Hyderabad Municipal Corporation, Andhra Pradesh, India were selected. Students with congenital anomalies, physical handicaps or any other chronic health problems requiring medical attention and those taking micronutrient tablets for the past year were excluded from the study. A total of 380 students were recruited for the study using probability proportional to size sampling, from whom a blood sample was collected for analysis of micronutrient status in a randomly selected sub-sample of 150. One hundred and nine of these participants were available for testing the validated knowledge questionnaire, which was done after a gap of 6 months.
Micronutrient status
The baseline blood samples were collected after an overnight fast and analysed for Hb( 22 ) and plasma ferritin( Reference Pawashe, Raman and Nair 23 ), folic acid and vitamin B12 (RIA kit by Siemens Inc., LA, USA). Simultaneous determination of plasma retinol and α-tocopherol was carried out by HPLC (Thermo Finnigan, Herts, UK)( Reference Bieri, Tolliver and Catignani 24 ). An ascorbic acid assay was done on the same day using the α,α-bipyridyl micromethod( Reference Zannoni, Lynch and Goldstein 25 ). The ferritin ELISA and HPLC methods for retinol and α-tocopherol were in-house methods and are continuously validated by the VITAL-EQA (Vitamin A Laboratory – External Quality Assurance) programme of the Centers for Disease Control and Prevention (Atlanta, GA, USA). The percentage inadequacy of micronutrient status was computed using cut-off values derived from the literature( Reference Young 26 ).
Economic status
Economic status was derived from the information collected on twelve household assets by computing the standard of living index( 27 ).
Statistical analysis
All statistical analyses were done using SPSS version 16·0. Descriptive statistics were used to summarize the results. Item analysis (item difficulty index p, item discrimination index D, point bi-serial r and Cronbach's α) was done for psychometric validation of the thirty-one-item questionnaire. The Bland–Altman plot was constructed using the MedCalc statistical program version 11·5·1·0 (MedCalc Software, Mariakerke, Belgium). The relationship between knowledge and biomarkers of micronutrient status was tested by the two-tailed independent-samples t test between groups above and below the 50th percentile of knowledge score. For micronutrients which were not normally distributed, the non-parametric Mann–Whitney U test was used. Analysis of covariance was performed taking the standard of living index as a covariate, knowledge as the independent variable and micronutrient status as the dependent variable.
Results
The content analysis of the 106 items resulted in the selection of six multiple-choice questions, twenty-one yes/no questions and four one-word-answer type questions. There was no significant gender difference in the scores of respondents during the pre-test (P = 0·995) and therefore only pooled analysis was done.
Psychometric indices
The item difficulty index p ranged from 0·11 to 0·86. There were three relatively easy questions (p = 0·84–0·86) and three difficult questions (p = 0·11–0·19) and all the rest were in the desirable range of difficulty (Table 2).
Table 2 Difficulty index and discrimination index values of questions in the knowledge questionnaire
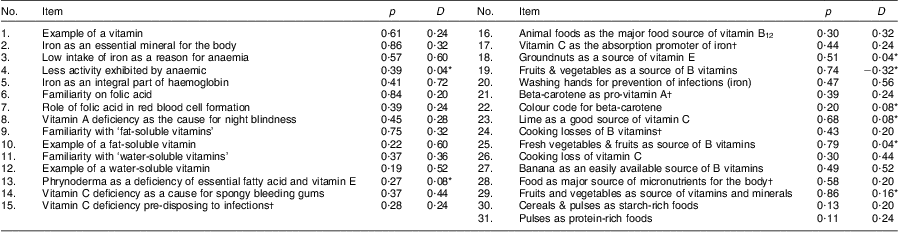
| No. | Item | p | D | No. | Item | p | D |
| 1. | Example of a vitamin | 0·61 | 0·24 | 16. | Animal foods as the major food source of vitamin B12 | 0·30 | 0·32 |
| 2. | Iron as an essential mineral for the body | 0·86 | 0·32 | 17. | Vitamin C as the absorption promoter of iron† | 0·44 | 0·24 |
| 3. | Low intake of iron as a reason for anaemia | 0·57 | 0·60 | 18. | Groundnuts as a source of vitamin E | 0·51 | 0·04* |
| 4. | Less activity exhibited by anaemic | 0·39 | 0·04* | 19. | Fruits & vegetables as a source of B vitamins | 0·74 | −0·32* |
| 5. | Iron as an integral part of haemoglobin | 0·41 | 0·72 | 20. | Washing hands for prevention of infections (iron) | 0·47 | 0·56 |
| 6. | Familiarity on folic acid | 0·84 | 0·20 | 21. | Beta-carotene as pro-vitamin A† | 0·39 | 0·24 |
| 7. | Role of folic acid in red blood cell formation | 0·39 | 0·24 | 22. | Colour code for beta-carotene | 0·20 | 0·08* |
| 8. | Vitamin A deficiency as the cause for night blindness | 0·45 | 0·28 | 23. | Lime as a good source of vitamin C | 0·68 | 0·08* |
| 9. | Familiarity with ‘fat-soluble vitamins’ | 0·75 | 0·32 | 24. | Cooking losses of B vitamins† | 0·43 | 0·20 |
| 10. | Example of a fat-soluble vitamin | 0·22 | 0·60 | 25. | Fresh vegetables & fruits as source of B vitamins | 0·79 | 0·04* |
| 11. | Familiarity with ‘water-soluble vitamins’ | 0·37 | 0·36 | 26. | Cooking loss of vitamin C | 0·30 | 0·44 |
| 12. | Example of a water-soluble vitamin | 0·19 | 0·52 | 27. | Banana as an easily available source of B vitamins | 0·49 | 0·52 |
| 13. | Phrynoderma as a deficiency of essential fatty acid and vitamin E | 0·27 | 0·08* | 28. | Food as major source of micronutrients for the body† | 0·58 | 0·20 |
| 14. | Vitamin C deficiency as a cause for spongy bleeding gums | 0·37 | 0·44 | 29. | Fruits and vegetables as source of vitamins and minerals | 0·86 | 0·16* |
| 15. | Vitamin C deficiency pre-disposing to infections† | 0·28 | 0·24 | 30. | Cereals & pulses as starch-rich foods | 0·13 | 0·20 |
| 31. | Pulses as protein-rich foods | 0·11 | 0·24 |
The item difficulty index p is the ratio of the number of correct responses to the total number of responses (n 92). The higher the index value, lower the difficulty. D is the item discrimination index.
*Indicates the items discarded due to low D.
†Indicates the items discarded due to low item validity index (r) value of 0·0335 to 0·1319.
The item discriminative index D ranged from −0·32 to 0·72. Eight items with a discriminative index below 0·20 were discarded as poorly discriminating questions (Table 2).
Twelve questions had item validity index r above 0·2. Due to good content validity, six items in the range of r from 0·1 to 0·2 were retained, resulting in an eighteen-item questionnaire (Table 3).
Table 3 Summary of psychometric properties of the eighteen selected items
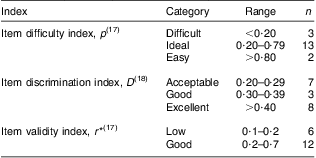
| Index | Category | Range | n |
| Item difficulty index, p ( Reference Garret and Woodworth 17 ) | Difficult | <0·20 | 3 |
| Ideal | 0·20–0·79 | 13 | |
| Easy | >0·80 | 2 | |
| Item discrimination index, D ( Reference Ebel 18 ) | Acceptable | 0·20–0·29 | 7 |
| Good | 0·30–0·39 | 3 | |
| Excellent | >0·40 | 8 | |
| Item validity index, r*( Reference Garret and Woodworth 17 ) | Low | 0·1–0·2 | 6 |
| Good | 0·2–0·7 | 12 |
n, number of items.
*Values less than 0·1 not considered.
A Cronbach's α value of 0·71 was obtained for the eighteen-item scale. The domains were combined in the shortened version. The Bland–Altman plot showed a mean of 0·8 with few outliers (Fig. 1). The ICC of 0·80 was significant at P < 0·01. The final questionnaire consisted of twelve items on functions/deficiencies, five items on dietary source and one question on hand washing (hygiene). The questionnaire took about 15 min to complete.
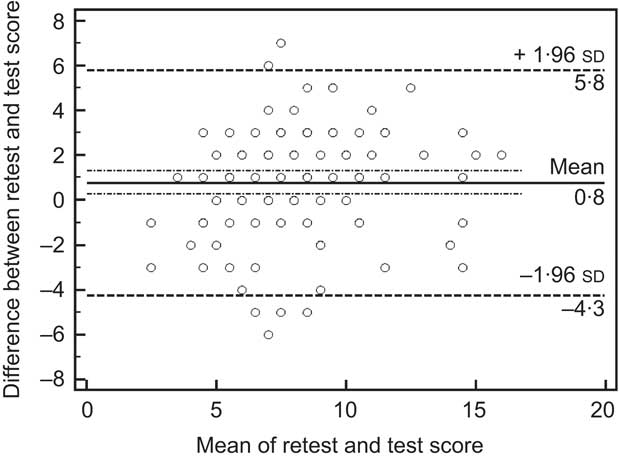
Fig. 1 Bland–Altman plot showing the agreement between test and retest scores on the knowledge questionnaire on nutrients among 15–19-year-old students, Hyderabad, India (n 100). The differences between the retest and test scores were plotted against the means and the limits of agreement were calculated. —— represents the mean difference between the retest and the test (bias); – · – · – represent the 95 % confidence interval of bias; - - - - - represent the upper and lower 95 % limits of agreement
Relationship between the valid eighteen-item questionnaire and micronutrient status
The mean age of the students was 16·6 (sd 1·24) years; their mean height was 163·7 (sd 6·95) cm, mean weight was 47·5 (sd 7·37) kg and mean BMI was 17·7 (sd 2·23) kg/m2.
The knowledge scores of the students ranged from 0 to 14, with a mean of 5·2 (sd 2·68). Fifty-nine per cent of the students scored below the 50th percentile of knowledge score, i.e. a score of less than 5·0.
Micronutrient status
The mean values of micronutrients were 13·9 (sd 1·63) g/dl for Hb, 44·6 (sd 80·1) ng/ml for ferritin, 0·42 (sd 0·29) mg/dl for ascorbic acid, 26·3 (sd 7·4) μg/dl for plasma retinol, 328·9 (sd 164·42) μg/dl for α-tocopherol, 5·5 (sd 1·9) ng/ml for folic acid and 246·0 (sd 110·00) pg/ml for vitamin B12.
Knowledge and micronutrient status among students
Plasma retinol status was significantly different between the groups below and above the 50th percentile of knowledge score (P = 0·022). Other biomarkers of micronutrient status did not show any significant relationship with knowledge score (Table 4). The analysis of covariance performed with micronutrient status as the dependent variable and standard of living index as a covariate also confirmed a significant difference in retinol status based on knowledge score (P = 0·018).
Table 4 Indicators of micronutrient status according to knowledge score below or above the 50th percentile: 15–19-year-old students, Hyderabad, India
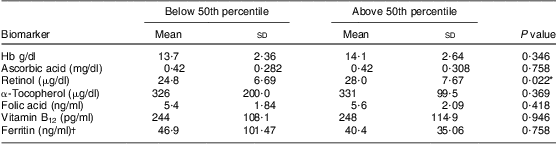
| Below 50th percentile | Above 50th percentile | ||||
| Biomarker | Mean | sd | Mean | sd | P value |
| Hb g/dl | 13·7 | 2·36 | 14·1 | 2·64 | 0·346 |
| Ascorbic acid (mg/dl) | 0·42 | 0·282 | 0·42 | 0·308 | 0·758 |
| Retinol (μg/dl) | 24·8 | 6·69 | 28·0 | 7·67 | 0·022* |
| α-Tocopherol (μg/dl) | 326 | 200·0 | 331 | 99·5 | 0·369 |
| Folic acid (ng/ml) | 5·4 | 1·84 | 5·6 | 2·09 | 0·418 |
| Vitamin B12 (pg/ml) | 244 | 108·1 | 248 | 114·9 | 0·946 |
| Ferritin (ng/ml)† | 46·9 | 101·47 | 40·4 | 35·06 | 0·758 |
The knowledge score ‘below 50th percentile’ indicates a score of ≤5·0 (n 64) and ‘above 50th percentile’ indicates a score of >5·0 (n 45). Comparisons are made between the means along the rows.
*Significantly different means.
†The high variation observed is due to one extreme value of 821 ng/ml. The data were analysed after logarithmic transformation.
Discussion
Several studies assessing knowledge have been found to report on a questionnaire being ‘pre-tested’ without providing the statistical attributes that establish its reliability and validity( Reference Lakshman, Sharp and Ong 28 – Reference Nazni and Vimala 31 ). A structured approach of scaling is of prime importance for the construction of a knowledge questionnaire in order to establish its validity. To our understanding, there are no validated questionnaires addressing micronutrients, deficiency of which is of major concern in developing countries like India. Therefore, our study is the first of its kind in constructing and psychometrically validating a knowledge questionnaire on micronutrients. Further, we also tested the relationship of knowledge assessed by this questionnaire with biomarkers of micronutrient status among adolescents.
The item pool used for the questionnaire development addressed the micronutrients which had an established evidence of deficiency or where a national database was available with reference to the intake or widespread deficiency( 32 ). Even though Zn and vitamin D deficiencies are emerging problems in India, there was no national database on intake or deficiency nor was there any RDA for these nutrients in India at the time of designing the study. In addition, there are no reliable markers for mapping Zn deficiency( Reference Brown and Rivera 33 ). For these reasons we did not include Zn and vitamin D in the item pool. Iodine was not included on account of the universal salt iodization programme( 34 ) currently in operation in the country.
The selection of questions from the item pool was perhaps the most difficult step involved in our study. The expertise of the panel with regard to the domain of knowledge tested and the anticipated difficulty level of the item were considered while selecting questions. The nutrition component in the school curriculum, and nutrition messages propagated by the Government of India through the popular electronic media (television), were the basis for this. Accordingly, a number of questions on dietary sources that were judged to be inappropriate were deleted from the item pool. Questions related to nutrient absorption were also deleted as they were judged to be too technical for the group being studied. Care was also taken to select items which were simple, easily understandable and suitable for 15–19-year-old adolescent students of low and middle income level of economic status. Thus the selected thirty-one questions mostly attempted to test basic knowledge on micronutrients.
To obtain a valid questionnaire applying appropriate statistical methods, the thirty-one items were pre-tested in a group of adolescents. The statistical tools applied, such as item difficulty index, item discrimination index, item validity index and reliability test, provided an eighteen-item questionnaire. The spread of data, difficulty level and discriminative power of this eighteen-item questionnaire were within acceptable ranges. Nine items belonging to the domain of dietary sources did not show significant item to total correlation and were discarded. Some of the items had low inter-correlations but were retained due to content validity. The reliability of the questionnaire of α = 0·71 was also within the acceptable range and is in agreement with the widely accepted general nutrition knowledge test( Reference Parmenter and Wardle 3 ) and a knowledge questionnaire developed for US children which had an α of 0·7( Reference Stevens, Cornell and Story 12 ). Thus we constructed a short self-administered questionnaire that required 15 min to complete with no gender-specific items and so can be used for adolescents. This had an added advantage of easy assessment of knowledge useful in pre–post knowledge assessment studies on micronutrients.
In an attempt to understand whether true knowledge will be reflected in biomarkers of micronutrient status, we applied this questionnaire in a group of adolescent boys. The prevalence of anaemia among this study group was 21 %, which is similar to the anaemia prevalence among males (15–49 years) in the State of Andhra Pradesh as well as the national average( 34 ). Further, the prevalence of subclinical vitamin A deficiency of 17·5 % and ascorbic acid deficiency of 75·0 % reported in the present study were similar to those in a study among apparently healthy adults from western India which reported 21 % and 77 % respectively( Reference Chiplonkar, Agte and Mengale 35 ). The other micronutrient deficiencies observed in the study population were similar to those reported in the literature in a similar group from a similar location( Reference Sivakumar, Nair and Sreeramulu 36 ), implying the representativeness of the study sample.
Among the micronutrients tested, plasma retinol alone showed a positive relationship with knowledge score, suggesting that knowledge on micronutrients can influence the status of at least some nutrients. This relationship persisted after controlling for economic status, a known confounder for micronutrient status on account of affordability and thereby intake( Reference Monsivais, Aggarwal and Drewnowski 37 ).
Evidence relating knowledge, dietary intake and biomarkers is meagre except for one study among nineteen volunteers that evaluated the impact of dietary counselling among cancer survivors, with an experimental group receiving dietary counselling to increase fruit and vegetable consumption. The plasma levels tested were for carotenoids, vitamin C, α-tocopherol and cholesterol. Plasma carotenoid levels and ascorbic acid showed a change with acceptance and compliance to diet therapy( Reference Le Marchand, Hankin and Carter 38 ). Another study from western India, where population characteristics were similar to our study group, examined the relationship between dietary habits, plasma retinol and plasma ascorbic acid among 214 men and 108 women. Results showed a dose–response relationship of intake with serum retinol alone and not with vitamin C( Reference Chiplonkar, Agte and Mengale 35 ). The findings were explained on the basis that vitamin A is fat soluble, can be stored in the body and therefore better reflects the dietary habits of the individual. The present study findings can also be explained along similar lines, with knowledge influencing dietary habits which are reflected in biomarker levels. Data on fat intake were not collected. However, the study in western India was done in a population where socio-economic status was similar to our study participants, and it is believed that fat intake would also be similar in both groups. In the absence of any other reported literature, it would not be wrong to consider retinol status as a good biomarker sensitive to knowledge on micronutrients and which may change with changes in knowledge following dietary advice.
The implications of our study findings are varied. First, they emphasize the need to use validated questionnaires in nutrition research involving qualitative aspects like knowledge. Second, they show that knowledge on micronutrients, if assessed correctly, may relate to the blood levels of specific micronutrients of the target group as reported herein for plasma retinol. Increasing the knowledge of the population increases the sustainability of interventions as well as voluntary compliance by the target population.
Although parental factors can influence food choices, the participants of the present study were close to adulthood and therefore culturally possessed a certain amount of autonomy in their food choices. The majority of the participants had a higher educational qualification than their parents and contributed in performing family food chores. This background information on the study participants gives us sufficient confidence in using them as ‘change agents’.
There are limitations that need to be considered when interpreting the study results. The generalizability of the test–retest data may be limited since the study was done in girls alone, even though the pre-test showed no gender difference in scoring. Dietary intake data were not collected, which could have provided more conclusive evidence for the relationship we found. A positive relationship of knowledge with micronutrients like folic acid (where body stores are not available) cannot be ruled out, on account of the time lag of 6 months between the assessments of micronutrient status and knowledge.
Acknowledgements
The authors wish to acknowledge the funding received from the Indian Council of Medical Research for carrying out the study. The Fellowship received by L.F.A. from the University Grants Commission, Government of India, is also acknowledged. The authors declare that there is no conflict of interest. All authors have participated in the research reported and all have agreed to be an author of this paper. K.M.N. conceptualized and designed the study, supervised the study protocol and edited the manuscript. S.V. conceptualized the psychometric validation of the test scale, was involved in development of the questionnaire at various stages and edited the manuscript. L.F.A. was responsible for designing the questionnaire, conduct of studies, analysis of ferritin and has written the manuscript. A.L. did clinical examination for the project and applied inclusion/exclusion criteria. M.V.R. was responsible for data analysis. S.F.R. was responsible for application of the validated scale in the study on ‘Stress, allostatic load and micronutrient status among students: impact of dietary advice’ and was involved in interpreting the test scales. P.R. analysed biomarkers of micronutrient status and V.V.R. analysed plasma retinol and α-tocopherol. All authors have read and contributed to the final manuscript. The authors thank the Nutrition Society of India for the opportunity to present part of the results of the study at its 42nd Annual Conference held in Mumbai, India, 19–20 November 2010. They also thank Dr B. Sesikeran MD, Director, National Institute of Nutrition, for his support and encouragement.


